2020 Property Compendium - Creating extraordinary places, connecting and enriching communities - AFR

Page created by George Arnold
 
CONTINUE READING
2020 Property Compendium - Creating extraordinary places, connecting and enriching communities - AFR
2020 Property Compendium

Creating extraordinary places, connecting                         31 December 2020
and enriching communities                   Scentre Group Limited ABN 66 001 671 496
2020 Property Compendium - Creating extraordinary places, connecting and enriching communities - AFR
Creating extraordinary places, connecting and enriching communities

Contents
Portfolio Overview ___________________________ 1        Westfield Knox, VIC__________________________ 28
Operating Performance ________________________ 3        Westfield Kotara, NSW________________________ 29
Retailers and Lease Expiry Profile ________________ 4   Westfield Liverpool, NSW______________________ 30
Portfolio Details ______________________________ 6      Westfield Manukau, NZ________________________ 31
Scentre Group Property Profiles ________________ 7      Westfield Marion, SA_________________________ 32
Westfield Airport West, VIC_____________________ 8      Westfield Miranda, NSW_______________________ 33
Westfield Albany, NZ__________________________ 9        Westfield Mt Druitt, NSW______________________ 34
Westfield Belconnen, ACT_____________________ 10        Westfield Newmarket, NZ______________________ 35
Westfield Bondi Junction, NSW_________________ 11       Westfield North Lakes, QLD____________________ 36
Westfield Booragoon, WA_____________________ 12         Westfield Parramatta, NSW_____________________ 37
Westfield Burwood, NSW______________________ 13         Westfield Penrith, NSW________________________ 38
Westfield Carindale, QLD______________________ 14       Westfield Plenty Valley, VIC____________________ 39
Westfield Carousel, WA_______________________ 15        Westfield Riccarton, NZ_______________________ 40
Westfield Chatswood, NSW____________________ 16         Westfield Southland, VIC______________________ 41
Westfield Chermside, QLD_____________________ 17        Westfield St Lukes, NZ________________________ 42
Westfield Coomera, QLD______________________ 18         Westfield Sydney, NSW_______________________ 43
Westfield Doncaster, VIC______________________ 19       Westfield Tea Tree Plaza, SA___________________ 44
Westfield Eastgardens, NSW___________________ 20        Westfield Tuggerah, NSW______________________ 45
Westfield Fountain Gate, VIC___________________ 21      Westfield Warringah Mall, NSW_________________ 46
Westfield Garden City, QLD____________________ 22       Westfield West Lakes, SA______________________ 47
Westfield Geelong, VIC_______________________ 23        Westfield Whitford City, WA____________________ 48
Westfield Helensvale, QLD_____________________ 24       Westfield Woden, ACT________________________ 49
Westfield Hornsby, NSW_______________________ 25        Glossary___________________________________ 50
Westfield Hurstville, NSW______________________ 26      Directory and Disclaimer______________________ 51
Westfield Innaloo, WA_________________________ 27

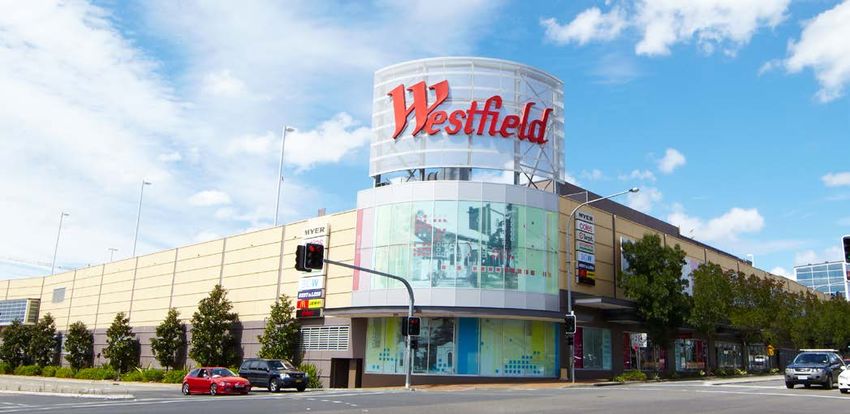
                                                                   FRONT COVER IMAGE: WESTFIELD BONDI JUNCTION
2020 Property Compendium - Creating extraordinary places, connecting and enriching communities - AFR
Creating extraordinary places, connecting and enriching communities

Portfolio Overview
Scentre Group owns and operates 42              Living Centres across Australia and New Zealand
which are important to our customers and essential to the community.

Our customer focused strategy delivers extraordinary experiences, every day, delivering the first
choice platform for retail and brand partners to connect and interact with customers.

Our portfolio is strategically located close to where customers live. Approximately 20 million people
live within close proximity to a Westfield Living Centre.

Our Plan – to create the places more people choose to come, more often, for longer – is based on
the principle that we compete for the time and attention of our customers.

We aspire for our Westfield Living Centres to be regarded as an integral part of our customers’ and
communities’ lives – a ‘third place’ after their home and workplace. Our plan is to create places where
our customers feel welcome, inspired and compelled to visit often because what we offer meets their
needs and wants.

Demand for space within Westfield Living Centres is strong with the portfolio 98.5% leased as at
31 December 2020. The Group completed 2,625 lease deals during the year, including 848 new
merchants. Importantly, the structure of leases has not changed and remains based on the mutual
agreement to pay a fixed base rent.

Our ability to understand what our customer wants drives demand and high visitation and creates
more opportunities for our retail partners to connect and interact with customers.

During 2020, we had more than 450 million customer visits, spending $22 billion with our retail
partners. On average, customers spent approximately one and a half hours of their time each visit.

We continue to implement initiatives that support our strategy to operate as a responsible,
sustainable business. During the year, we announced our target to achieve Net Zero Carbon
Emissions across our wholly owned portfolio by 2030 and publicly committed to the Task Force for
Climate-Related Financial Disclosures (TCFD).

Scentre Group owns 7 of the top 10 centres in Australia, and 4 of the top 5 centres in New Zealand.

 WESTFIELD BONDI JUNCTION

Page 1   Scentre Group Property Compendium 2020                                                                      Link To Disclaimer
2020 Property Compendium - Creating extraordinary places, connecting and enriching communities - AFR
Creating extraordinary places, connecting and enriching communities

Scentre Group Portfolio
The strategic locations of our portfolio enables brands and retail partners to efficiently connect
with more customers

                                                                                                                                              Australia &
                                                                                                                                          New Zealand Portfolio

                                                                                                                                         42                   > 450m
                                                                                                                                      Westfield
                                                                                                                                                                Customer
                                                                                                                                   Living Centres
                                                                                                                                                              visits in 2020
                                                                                    Brisbane     6 CENTRES

       Perth                                          Adelaide                             Sydney
      4 CENTRES
                                                       3 CENTRES           Canberra
                                                                                               15 CENTRES
                                                                                                                                    Auckland
                                                                             2 CENTRES

                                                                   Melbourne

                                                                        7 CENTRES

                                                                                                                                                              NZ

20 million                                                                                                                      Christchurch
                                                                                                                                                          5 CENTRES

people live within close proximity to a
         Living Centre

As at 31 December 2020, Scentre Group’s portfolio included
42          Living Centres spread across Australia and New Zealand,
with the Group’s ownership interests valued at $34.1 billion.

Portfolio by GLA
                              NSW                                                    VIC                               QLD                  SA          WA         ACT      NZ

                              36%                                                    19%                               18%                  8%           8%        4%       7%

Portfolio By Asset Value (SCG Share)
                                         NSW                                                                VIC                       QLD            SA        WA       ACTNZ

                                          51%                                                               14%                       17%            4%        7%        3% 4%

 [1. Pro forma post sale of four Australian assets, settlement expected Q3 2015]

Page 2            Scentre Group Property Compendium 2020                                                                                                                   Link To Disclaimer
2020 Property Compendium - Creating extraordinary places, connecting and enriching communities - AFR
Creating extraordinary places, connecting and enriching communities

                                                                                                      WESTFIELD NEWMARKET

Operating Performance
  Scentre Group’s portfolio has a long track record of delivering strong
  operating metrics, and the portfolio has remained in excess of 98%
  leased for more than 20 years.

  2020 reported sales and visitation have been impacted by the COVID
  pandemic which caused restrictions to trading during the year.

   Operating Performance of
   Scentre Group’s Portfolio

  Combined Portfolio                                                                                  2020                     2019

  Total Annual Sales                                                                             $22.0bn                 $25.0bn
  Average Sales per Specialty Store ('000)                                                         $1,403                  $1,525
  Average Specialty Store Rent (psm)                                                               $1,712                  $1,689

  Specialty Sales MAT $psm (
2020 Property Compendium - Creating extraordinary places, connecting and enriching communities - AFR
Creating extraordinary places, connecting and enriching communities

Retailers and Lease Expiry Profile
Anchor Retailers
Scentre Group is the major landlord and an integral partner to major household retail brands such as David Jones, Myer,
Farmers, Target, Kmart, Big W, Coles, Woolworths and Aldi. Anchor retailers generally have lease terms of 15 to 25 years
with stepped increases throughout the term that can be fixed, linked to the consumer price index (CPI) or sales turnover
based. As of 31 December 2020, anchor retailers represented 51% of GLA and 17% of rental income. The following table
outlines the anchor retailers in Scentre Group’s portfolio as of 31 December 2020:

  Anchor Retailers                                  No. of               GLA                         % of       Average Lease Term
                                                    Stores             (000’s                       Retail        Remaining (years)
                                                                         sqm)                        GLA

  Department Stores
  Myer                                                23             405.1                         10.7%                        8.3
  David Jones                                         19             244.7                          6.5%                        8.6
  Farmers                                              5              41.2                          1.1%                        6.7
  Harris Scarfe                                       10              29.5                          0.8%                        7.0
  Sub Total                                           57             720.5                         19.1%                        8.2

  Discount Department Stores
  Target                                              33             245.1                          6.5%                        8.7
  Kmart                                               28             195.4                          5.2%                        9.7
  BIG W                                               19             154.6                          4.1%                        8.1
  Sub Total                                           80             595.0                         15.8%                        8.9

  Supermarkets
  Coles                                               36             141.7                          3.8%                        9.4
  Woolworths                                          33             139.5                          3.7%                        8.0
  Aldi                                                19              29.4                          0.8%                        8.5
  Countdown                                            3              11.3                          0.3%                        9.8
  Pak N Save                                           1               6.3                          0.2%                        3.5
  Spudshed                                             1               4.7                          0.1%                        9.4
  New World                                            1               3.4                          0.1%                        1.7
  Sub Total                                           94             336.3                          8.9%                        8.5

  Cinemas
  EventCinemas                                        18             108.6                          2.9%                        9.9
  Hoyts                                               11              55.2                          1.5%                        8.2
  Village Roadshow                                     6              38.3                          1.0%                        7.0
  Birch Carroll & Coyle                                2              14.2                          0.4%                       10.8
  ReadingCinemas                                       1               4.3                          0.1%                        8.9
  Sub Total                                           38             220.7                          5.9%                        9.0

  Others
  Harvey Norman                                        5               25.9                         0.7%                        4.5
  Bunnings Warehouse                                   2               12.0                         0.3%                        2.4
  Dan Murphys                                          7                9.8                         0.3%                        6.3
  Sub Total                                           14               47.8                         1.3%                        4.3

  Grand Total                                        283           1,920.3                         51.0%                        8.5

Page 4     Scentre Group Property Compendium 2020                                                                               Link To Disclaimer
2020 Property Compendium - Creating extraordinary places, connecting and enriching communities - AFR
Creating extraordinary places, connecting and enriching communities

Other Retailers
Specialty retailers generally have lease terms of 5 to 7 years, and for larger stores 5 to 10 years. Specialty store retailers
generally have leases with annual contracted increases of CPI plus 2% to 3%. For the year ended 31 December 2020, the
10 largest specialty store retailers represented 8% of GLA and contributed 11% of rental income.

The following table outlines the 10 largest specialty store retailers as of 31 December 2020:

   Retailers                                                                                             No of          GLA           % of
                                                                                                        Stores        (000's         Retail
                                                                                                                        sqm)          GLA

   Super Retail Group                                                                                         44         59.1         1.6%
     (Rebel Sport, Macpac, Supercheap Auto)
   Cotton On Group                                                                                        148            46.7         1.2%
     (Cotton On, Cotton On Kids, Cotton On Body, Typo, Rubi Shoes, Factorie,
      Supre)
   JB Hi Fi                                                                                                   35         41.2         1.1%
     (JB Hi Fi, JB Hi Fi Home)
   H&M                                                                                                        14         33.7         0.9%
     (H & M, COS)
   The Just Group                                                                                         219            31.2         0.8%
     (Just Jeans, Jay Jays, Jacqui E, Peter Alexander, Portmans,
     Dotti, Smiggle)
   ZARA                                                                                                       10         21.2         0.6%
   Australian Pharmaceutical Industries                                                                       55         21.2         0.6%
     (Priceline, Priceline Pharmacy, Soul Pattinson Chemist, Clear Skincare Clinics)
   Best & Less                                                                                                19         20.4         0.5%
   Country Road Group                                                                                         87         19.7         0.5%
     (Country Road, Trenery, Witchery, Mimco, Politix)
   Accent Group                                                                                           137            19.0         0.5%
     (Hype DC, The Athletes Foot, Platypus Shoes, Skechers, Merrell,
      Vans, The Trybe, Dr Martens, Timberland)

   Total                                                                                                 768          313.3          8.3%

Lease Expiry Profile
For the year ended 31 December 2020, Scentre Group completed 2,625 lease deals, covering an aggregate of
366,880 square metres. Scentre Group has a 6.0 year weighted average unexpired lease term across the portfolio.

 Total Portfolio % Leased Area                                 Specialty Store Retailers
                                                               % Leased Area

  20%                                                           20%

  15%                                                           15%
                                                                      16%   16%

                                                                                  13%
  10%          12%                                              10%                     11%
        9%           9%
                               8%                                                             9%
                          7%
   5%                                                            5%                                7%
                                    5%
                                         4%        4%                                                    4%
                                              3%        3%                                                     3%   3%    2%
   0%                                                            0%
Expiring 2021 2022 2023 2024 2025 2026 2027 2028 2029 2030    Expiring 2021 2022 2023 2024 2025 2026 2027 2028 2029 2030

Page 5         Scentre Group Property Compendium 2020                                                                                  Link To Disclaimer
2020 Property Compendium - Creating extraordinary places, connecting and enriching communities - AFR
Portfolio Details                                                                             Creating extraordinary places, connecting and enriching communities

2020 reported sales and visitation have been impacted by the COVID pandemic which caused restrictions to trading during the year

At                         Ownership             Book Capitalisation         Economic          Total   Average              Gross        Number           2020
31 December 2020             Interest            Value         Rate              Yield 1       Sales  Sales Per           Lettable    of Tenants          Visits
                                                  SCG                                           MAT Spec’ Store              Area
                                    (%)           ($m)                                          ($m)       ($’000)    (000’s sqm)                            (m)
Australia
Australian Capital Territory
Belconnen                  100%                760.0            5.75%           6.15%          480.8        1,259            95.0            275             9.7
Woden                        50%               305.0            5.75%           6.53%          348.0        1,139            72.1            237             8.3
New South Wales
Bondi Junction             100%              3,013.9            4.25%           4.51%        1,011.6        2,249          131.1             456           17.7
Burwood                      50%               522.7            4.75%           5.41%          408.6        1,025           63.2             232           11.5
Chatswood                  100%              1,295.6            4.50%           4.80%          433.3        1,396           81.0             251           14.4
Eastgardens                  50%               592.5            4.50%           5.08%          572.0        1,193           83.0             273           10.6
Hornsby                    100%              1,055.3            5.25%           5.60%          612.2        1,290           97.2             309           15.3
Hurstville                   50%               406.5            5.25%           6.00%          496.6        1,336           61.0             241           16.5
Kotara                     100%                875.0            5.50%           5.87%          455.1        1,164           82.4             276            7.4
Liverpool                    50%               487.7            5.25%           5.97%          451.6        1,101           82.3             326           12.3
Miranda                      50%             1,173.0            4.50%           5.06%          848.3        1,641          128.4             438           13.2
Mt Druitt                    50%               303.5            5.50%           6.29%          382.7        1,101           60.5             230           10.7
Parramatta                   50%             1,001.9            4.50%           5.15%          713.7        1,437          137.6             446           23.6
Penrith                      50%               650.0            5.00%           5.68%          589.0        1,619           91.4             314           14.8
Sydney 2                   100%              4,039.4            4.30%           4.57%          760.2        2,641           91.7             288           22.7
Tuggerah                   100%                745.0            5.63%           5.99%          471.9        1,301           84.2             244            8.0
Warringah Mall               50%               840.0            5.00%           5.64%          659.4        1,259          131.4             370           10.9
Queensland
Carindale 3                  50%               724.1            5.00%           5.71%          839.9        1,654          136.4             396           12.8
Chermside                  100%              2,544.0            4.50%           4.78%          964.6        1,821          177.4             475           15.2
Coomera                      50%               195.0            5.75%           6.57%          248.7        1,159           57.7             158            6.0
Garden City                100%              1,490.0            5.00%           5.34%          746.9        1,428          142.4             390           14.5
Helensvale                   50%               191.0            6.00%           6.89%          299.6        1,092           44.8             181            6.5
North Lakes                  50%               460.0            5.00%           5.71%          699.3        1,484          115.1             275           12.1
South Australia
Marion                       50%               638.0            5.25%           6.06%          761.1        1,518          137.1             316           11.3
Tea Tree Plaza               50%               343.0            5.50%           6.43%          481.5        1,242           99.3             250           10.1
West Lakes                   50%               197.5            6.25%           7.32%          389.0        1,187           71.2             237            6.6
Victoria
Airport West                 50%               177.5            6.00%           6.94%         298.1          882            52.8             164            6.0
Doncaster                    50%             1,115.5            4.50%           5.09%         629.8        1,301           123.2             430           10.7
Fountain Gate              100%              1,920.0            4.50%           4.81%         779.1        1,197           178.1             442           10.9
Geelong                      50%               217.5            6.00%           6.94%         213.0          902            52.0             166            6.3
Knox                         50%               425.0            5.50%           6.41%         436.5        1,038           141.0             393            8.5
Plenty Valley                50%              250.0             5.25%           6.09%         327.9        1,085            62.5             191            6.8
Southland                    50%               720.0            5.00%           5.70%         587.2          969           129.4             377           10.0
Western Australia
Booragoon                    50%               475.0            5.00%           5.70%         558.6        2,188            72.3             243            7.7
Carousel                   100%              1,405.0            4.75%           5.10%         640.3        1,471           110.5             353           11.5
Innaloo                    100%                291.0            6.00%           6.52%         330.8          967            47.4             161            7.6
Whitford City                50%               250.0            6.00%           7.01%         433.2        1,137            84.8             280            6.5
New Zealand (NZD)
Albany                       51%              286.9             6.00%           6.85%         361.1        1,703           53.3             148            6.8
Manukau                      51%              188.7             6.75%           7.75%         263.2        1,534           45.0             182            6.3
Newmarket                    51%              589.7             5.50%           6.03%         396.7        1,679           88.1             257           10.0
Riccarton                    51%              288.2             6.75%           7.65%         476.0        2,039           55.1             192            9.9
St Lukes                     51%              206.6             6.75%           7.68%         282.8        1,163           39.5             172            5.4
Total Portfolio (AUD)                      33,558.8             4.89% 4         5.35%      22,037.5        1,403        3,890.1          12,035          453.7

1.   Capitalisation Rate adjusted for the benefit of internal and external        3.   Carindale Property Trust (CPT) has a 50% interest in this shopping
     management.                                                                       centre. As at 31 December 2020, the Group has a 62.6% interest
2.   Sydney comprises Sydney Central Plaza and the Sydney City                         in CPT.
     retail complex. As at 31 December 2020, the weighted average                 4.   Weighted average capitalisation rate including non-retail assets.
     capitalisation rate of Sydney was 4.30%, comprising Sydney City              5.   Experiece based offering includes dining, entertainment, health,
     4.25% and Sydney Central Plaza 4.50%.                                             fitness, finance, education and beauty services, which can only be
                                                                                       consumed on-site.

Page 6        Scentre Group Property Compendium 2020                                                                                                   Link To Disclaimer
2020 Property Compendium - Creating extraordinary places, connecting and enriching communities - AFR
Scentre Group
Property Profiles

                    WESTFIELD DONCASTER
2020 Property Compendium - Creating extraordinary places, connecting and enriching communities - AFR
Trade Area Map         Westfield Local Heroes     Responsible Business Report

Airport West, VIC
29-35 LOUIS STREET, AIRPORT WEST VIC 3042

Westfield Airport West is conveniently located just 10 minutes from
Tullamarine Airport and currently caters to a trade area population just over
340,000 residents, with a total accessible market of 2.1 million residents.
The centre boasts a reliable retail offer that includes Coles, Woolworths and
ALDI, discount department stores, and over 150 specialty stores.
High rates of home ownership, and household incomes that are in line with
the Melbourne metropolitan average, are found in the Main Trade Area.
Family composition is broadly in line with the Melbourne average, with 26%
of households being families with children under 15 years.
The Total Trade Area retail spend in 2020 was estimated to be $4.7 billion
with the Main Trade Area spend estimated to be $1.5 billion with retail
spend per capita ($14,756) broadly in line with the Melbourne metro
average ($14,945). Average household incomes in the Main Trade Area as
at the 2016 Census were $97,194 per annum which was also broadly in line
with the Melbourne metro average ($99,752).

                                                                                                                                             164                   52,751m2                    $298.1 m                          2,640
                                                                                                                                                                                               TOTAL ANNUAL RETAIL
                                                                                                                                        NUMBER OF RETAILERS        GROSS LETTABLE AREA                                        CAR PARKING SPACES
                                                                                                                                                                                                      SALES

2020 reported sales and visitation have been impacted by the COVID pandemic which caused restrictions to trading during the year
Customer & Demographics                                                                                                              Ownership & Site
Annual Visits 2020 (million)                                                                                              6.0        Centre Owner                                        Scentre Group (50%), Perron (50%)
Annual Visits 2019 (million)                                                                                              7.4        Site Area (ha)                                                                   16.2
Customer Advocacy - Net Promoter Score                                                                                    25         Acquisition Date                                                                1982
                                                                                                                         TTA         Book Value ($million) SCG Share                                               $177.5
Retail Expenditure ($ billion)                                                                                          $4.7         Book Value ($million)                                                         $355.0
Average Household Income                                                                                             $95,046         Capitalisation Rate 1                                                          6.00%
                                                                                                                                     Economic Yield 2                                                               6.94%
Drive Time                                                                                                          30 mins
                                                                                                                                     Centre Opened                                                                   1976
Population - accessible market                                                                                    2,090,000
                                                                                                                                     Centre Redeveloped                                           1986, 1989, 1996, 1999
Total Household Income ($ billion)                                                                                    $56.2
                                                                                                                                     Retailers
                                                                                                                                     Number of Retailers                                                                           164
                                                                                                                                     Experience based offering % 3                                                                 45%
                                                                                                              30 Minutes
                                                                                                                                     Centre Composition by GLA                                                   GLA               %
                                                                                                                                     Target                                                                    7,230           13.7%
                                                                                                                                     Kmart                                                                     6,918           13.1%
                                                                                                                                     Coles                                                                     4,000            7.6%
                                                                                                                                     Woolworths                                                                3,661            6.9%
                                                                                                                                     Harris Scarfe                                                             2,675            5.1%
                                                                                                                                     Cinemas                                                                   2,618            5.0%
                                                                                                                                     Aldi                                                                      1,606            3.0%
                                                                                                                                     Majors Total                                                             28,708           54.4%
                                                                                                                                     Specialties                                                              23,655           44.8%
                                                                                                                                     Offices                                                                     388            0.7%
                                                                                                                                     Total                                                                    52,751          100.0%
                                                                                                                                     Retailer In-store Sales Information                     2018              2019              2020
                                                                                                                                     Total Sales - MAT $m                                    $345              $363              $298
                                                                                                                                     Total Specialty Sales MAT $m                            $140              $145              $109
                                                                                                                                     Avg Sales per Specialty Store ($’000)                  $1,141            $1,164             $882
Specialty Sales Category Contribution 4
                                                                                                                                     Specialty Sales MAT $psm (
Trade Area Map         Westfield Local Heroes     Responsible Business Report

Albany, NZ
219 DON MCKINNON DRIVE, AUCKLAND 0632, NEW ZEALAND

Westfield Albany is located north of the Waitemata Harbour approximately
15 kilometres northwest of the Auckland CBD in one of the city’s newest
suburbs. The centre currently caters to a trade area population of nearly
420,000 residents, with a total accessible market of 920,000 residents.
Westfield Albany is home to some of New Zealand’s best-known retailers
including Farmers, Kmart, New World and JB Hi-Fi as well as Event Cinemas
and approximately 140 specialty stores.
The total retail spend in Westfield Albany’s Total Trade Area in 2020 was
estimated at $6.2 billion while the total retail spend in the Main Trade
Area was estimated at $3.4 billion. The total retail spend per capita for the
Westfield Albany Main Trade Area was estimated at $14,492 per annum in
2020, which is broadly in line with the Auckland Region average ($14,009).

                                                                                                                                    148                   53,349m2                    $ 361.1m                          2,373
                                                                                                                                                                                      TOTAL ANNUAL RETAIL
                                                                                                                               NUMBER OF RETAILERS        GROSS LETTABLE AREA                                        CAR PARKING SPACES
                                                                                                                                                                                             SALES
                                                                                             All Currency in NZD

2020 reported sales and visitation have been impacted by the COVID pandemic which caused restrictions to trading during the year
Customer & Demographics                                                                                                     Ownership & Site
Annual Visits 2020 (million)                                                                                       6.8      Centre Owner                                         Scentre Group (51%), GIC (49%)
Annual Visits 2019 (million)                                                                                       8.3      Site Area (ha)                                                                 20.8
Customer Advocacy - Net Promoter Score                                                                             37       Acquisition Date                                                              2007
                                                                                                                  TTA       Book Value ($million) SCG Share                                             $286.9
Retail Expenditure ($ billion)                                                                                    $6.2      Book Value ($million)                                                       $562.5
Average Household Income                                                                                            na      Capitalisation Rate 1                                                        6.00%
                                                                                                                            Economic Yield 2                                                             6.85%
Drive Time                                                                                                  30 mins
                                                                                                                            Centre Opened                                                                 2007
Population - accessible market                                                                              920,000
                                                                                                                            Centre Redeveloped                                                            2007
Total Personal Income ($ billion)                                                                             $26.4
                                                                                                                            Retailers
                                                                                                                            Number of Retailers                                                                           148
                                                                                                                            Experience based offering % 3                                                                 37%
                                                                                                     30 Minutes
                                                                                                                            Centre Composition by GLA                                                   GLA               %
                                                                                                                            Farmers                                                                   9,946           18.6%
                                                                                                                            Cinemas                                                                   6,778           12.7%
                                                                                                                            Kmart                                                                     6,742           12.6%
                                                                                                                            New World                                                                 3,387            6.3%
                                                                                                                            Majors Total                                                             26,853           50.3%
                                                                                                                            Specialties                                                              25,616           48.0%
                                                                                                                            Offices                                                                     880            1.6%
                                                                                                                            Total                                                                    53,349          100.0%
                                                                                                                            Retailer In-store Sales Information                    2018              2019              2020
                                                                                                                            Total Sales - MAT $m                                   $423              $417              $361
                                                                                                                            Total Specialty Sales MAT $m                           $256              $246              $196
                                                                                                                            Avg Sales per Specialty Store ($’000)                 $2,046            $1,964            $1,703
                                                                                                                            Specialty Sales MAT $psm (
Trade Area Map           Westfield Local Heroes     Responsible Business Report

Belconnen, ACT
BENJAMIN WAY, BELCONNEN ACT 2617

Located in the northern suburbs of Canberra, Westfield Belconnen is one
of Canberra’s largest retail destinations. Located 13 kilometres from the
CBD, the centre has a total accessible market of 470,000 residents.
Westfield Belconnen is home to some of Australia’s most well-known
retailers including Kmart, Target, Coles, Woolworths and ALDI and more
than 250 specialty stores. In 2020, Westfield Belconnen completed a
refurbishment of its Myer store which now spans two levels.
The centre’s Total Trade Area retail spend was estimated at $8.3 billion in
2020 while the total retail spend for the Main Trade Area was estimated at
$3.7 billion.
The Main Trade Area was characterised at the 2016 Census by a high
average household income of $116,925 per annum, 4% above the Sydney
Metro average ($112,106).
The total annual retail spend per capita in the Main Trade Area is estimated
at $17,352, 16% above the Sydney Metro average ($14,982).
There is a high concentration of professional workers in the centre’s
Main Trade Area owing to the abundance of sizeable commercial and
government employers in the area. 67% own their own home or are
paying off a mortgage, while 32% of households are families with children
under 15.

                                                                                                                                    275                   94,961m2                     $ 480.8m                          2,880
                                                                                                                                                                                        TOTAL ANNUAL RETAIL
                                                                                                                               NUMBER OF RETAILERS        GROSS LETTABLE AREA                                          CAR PARKING SPACES
                                                                                                                                                                                               SALES

2020 reported sales and visitation have been impacted by the COVID pandemic which caused restrictions to trading during the year
Customer & Demographics                                                                                                     Ownership & Site
Annual Visits 2020 (million)                                                                                    9.7         Centre Owner                                                     Scentre Group (100%)
Annual Visits 2019 (million)                                                                                  11.0          Site Area (ha)                                                                     8.3
Customer Advocacy - Net Promoter Score                                                                          33          Acquisition Date                                                                 1986
                                                                                                               TTA          Book Value ($million) SCG Share                                                $760.0
Retail Expenditure ($ billion)                                                                                $8.3          Book Value ($million)                                                          $760.0
Average Household Income                                                                                  $117,706          Capitalisation Rate 1                                                           5.75%
                                                                                                                            Economic Yield 2                                                                6.15%
Drive Time                                                                                                  30 mins
                                                                                                                            Centre Opened                                                                    1978
Population - accessible market                                                                              470,000
                                                                                                                            Centre Redeveloped                                  1988, 1995, 1996, 1997, 2010/2011
Total Household Income ($ billion)                                                                            $14.6
                                                                                                                            Retailers
                                                                                                                            Number of Retailers                                                                             275
                                                                                                                            Experience based offering % 3                                                                   47%
                                                                                                     30 Minutes
                                                                                                                            Centre Composition by GLA                                                    GLA                %
                                                                                                                            Myer                                                                      11,756            12.4%
                                                                                                                            Kmart                                                                      7,654             8.1%
                                                                                                                            Target                                                                     6,807             7.2%
                                                                                                                            Woolworths                                                                 4,820             5.1%
                                                                                                                            Cinemas                                                                    4,380             4.6%
                                                                                                                            Coles                                                                      4,151             4.4%
                                                                                                                            Harris Scarfe                                                              2,103             2.2%
                                                                                                                            Aldi                                                                       1,525             1.6%
                                                                                                                            Dan Murphys                                                                1,328             1.4%
                                                                                                                            Majors Total                                                              44,524            46.9%
                                                                                                                            Specialties                                                               50,019            52.7%
                                                                                                                            Offices                                                                      418             0.4%
                                                                                                                            Total                                                                     94,961           100.0%
                                                                                                                            Retailer In-store Sales Information                       2018             2019              2020
                                                                                                                            Total Sales - MAT $m                                      $540             $538              $481
Specialty Sales Category Contribution 4
                                                                                                                            Total Specialty Sales MAT $m                              $250             $241              $230
                                                                     Refer to Glossary for detailed category descriptions   Avg Sales per Specialty Store ($’000)                    $1,244           $1,198            $1,259
30%
                                                                                                                            Specialty Sales MAT $psm (
Trade Area Map         Westfield Local Heroes     Responsible Business Report

Bondi Junction, NSW
500 OXFORD STREET, BONDI JUNCTION NSW 2022

Westfield Bondi Junction is one of Sydney’s iconic retail destinations.
Situated in the heart of the Eastern Suburbs, one of the city’s most desirable
and affluent areas, the centre is only six kilometres from the Sydney CBD.
Currently servicing a trade area population of approximately 465,000, with
a total accessible market of 1.5 million residents, the centre is one of the
strongest performers in the Scentre Group portfolio.
The centre is defined by a premium retail and experience offer that caters to
its discerning and style-conscious customers. International luxury brands sit
alongside local designers and some of the most coveted high-street brands.
The retail mix is complemented by a customer service offer that includes valet
parking, a styling suite, ‘hands-free’ shopping and a concierge service.
Westfield Bondi Junction is home to Australia’s leading retailers, including
David Jones, Myer, Coles and Woolworths and over 300 specialty stores. In
2021, the centre’s Target store will be transformed into a Kmart store as part
of the Kmart Group’s plans to optimise its store network within the Westfield
Living Centre portfolio.
The centre’s Total Trade Area spend was estimated at $8.4 billion in
2020 while the total retail spend in the Main Trade Area was estimated at
$4.0 billion.
Average household income in 2016 (Census) in the Total Trade Area was
$120,703 per annum, which is 8% higher than the Sydney Metro average
($112,106), with a high retail spend per capita of $18,113 per annum, 21% above
the Sydney Metro average ($14,982).
The Total Trade Area includes large pockets of high density living with 63%
of households being flats, units or apartments. Workers from the trade area                                                         456                   131,126m2                 $1,011.6 m                          3,304
skew towards managers/professionals and there is also a higher proportion                                                                                                             TOTAL ANNUAL RETAIL
of younger residents aged between 25-39 years compared with the Sydney
                                                                                                                               NUMBER OF RETAILERS        GROSS LETTABLE AREA                                        CAR PARKING SPACES
                                                                                                                                                                                             SALES

Metro average.
2020 reported sales and visitation have been impacted by the COVID pandemic which caused restrictions to trading during the year
Customer & Demographics                                                                                                     Ownership & Site
Annual Visits 2020 (million)                                                                                  17.7          Centre Owner                                                          Scentre Group (100%)
Annual Visits 2019 (million)                                                                                  20.8          Site Area (ha)                                                                          2.8
Customer Advocacy - Net Promoter Score                                                                          44          Acquisition Date                                                                      1994
                                                                                                               TTA          Book Value ($million) SCG Share                                                   $3,013.9
Retail Expenditure ($ billion)                                                                                $8.4          Book Value ($million)                                                             $3,013.9
Average Household Income                                                                                  $120,703          Capitalisation Rate 1                                                                4.25%
                                                                                                                            Economic Yield 2                                                                     4.51%
Drive Time                                                                                                 30 mins
                                                                                                                            Centre Opened                                                                         1970
Population - accessible market                                                                           1,490,000
                                                                                                                            Centre Redeveloped                                                                    2004
Total Household Income ($ billion)                                                                           $52.6
                                                                                                                            Retailers
                                                                                                                            Number of Retailers                                                                           456
                                                                                                                            Experience based offering % 3                                                                 36%
                                                                                                     30 Minutes
                                                                                                                            Centre Composition by GLA                                                 GLA                  %
                                                                                                                            David Jones                                                            19,234              14.7%
                                                                                                                            Myer                                                                   17,887              13.6%
                                                                                                                            Cinemas                                                                 6,719               5.1%
                                                                                                                            Target                                                                  5,311               4.0%
                                                                                                                            Coles                                                                   4,758               3.6%
                                                                                                                            Woolworths                                                              3,750               2.9%
                                                                                                                            Harvey Norman                                                           1,500               1.1%
                                                                                                                            Majors Total                                                           59,159              45.1%
                                                                                                                            Specialties                                                            50,638              38.6%
                                                                                                                            Offices                                                                21,329              16.3%
                                                                                                                            Total                                                                 131,126              100%
                                                                                                                            Retailer In-store Sales Information                     2018             2019              2020
                                                                                                                            Total Sales - MAT $m                                   $1,132           $1,172            $1,012
                                                                                                                            Total Specialty Sales MAT $m                            $636             $666              $605
                                                                                                                            Avg Sales per Specialty Store ($’000)                  $2,273           $2,380            $2,249
Specialty Sales Category Contribution 4
                                                                                                                            Specialty Sales MAT $psm (
Trade Area Map         Westfield Local Heroes     Responsible Business Report

Booragoon, WA
125 RISELEY STREET, BOORAGOON WA 6154

Westfield Booragoon is located approximately 13 kilometres from the Perth
CBD in the city’s south-western suburbs. The centre currently caters to a
trade area population of approximately 507,000 residents and has a total
accessible market of 1.1 million residents. It is home to some of Australia’s
most recognised brands including David Jones, Myer, Kmart, Coles and
Woolworths. There is also a Hoyts cinemas complex on site and more than
160 specialty stores including Apple, Zara and JB Hi Fi.
The total retail spend in the Westfield Booragoon Total Trade Area was
estimated at $7.6 billion in 2020 while the total retail spend by the Main
Trade Area was estimated at $2.6 billion.
At $15,578 per annum in 2020 the retail spend per capita in the Main
Trade Area is 7% higher than the Perth metro average ($14,493). Westfield
Booragoon’s Main Trade Area also has a high average annual household
income of $110,225 per annum in 2016 (Census), which is 5% above
the Perth Metro average. In the Main Trade Area, 79% of workers are
professional or other white-collar workers, which is above the Perth Metro
average of 68%.

                                                                                        243                   72,279m2                   $ 558.6m                           4,250
                                                                                                                                          TOTAL ANNUAL RETAIL
                                                                                   NUMBER OF RETAILERS        GROSS LETTABLE AREA                                        CAR PARKING SPACES
                                                                                                                                                 SALES

2020 reported sales and visitation have been impacted by the COVID pandemic which caused restrictions to trading during the year
Customer & Demographics                                                         Ownership & Site
Annual Visits 2020 (million)                                              7.7   Centre Owner                                          Scentre Group (50%), AMP (50%)
Annual Visits 2019 (million)                                               na   Site Area (ha)                                                                  18.6
Customer Advocacy - Net Promoter Score                                    30    Acquisition Date                                                               2019
                                                                         TTA    Book Value ($million) SCG Share                                              $475.0
Retail Expenditure ($ billion)                                          $7.6    Book Value ($million)                                                        $950.0
Average Household Income                                            $106,184    Capitalisation Rate 1                                                         5.00%
                                                                                Economic Yield 2                                                              5.70%
Drive Time                                                            30 mins
                                                                                Centre Opened                                                                  1972
Population - accessible market                                      1,100,000
                                                                                Centre Redeveloped                                                1983, 1995, 2000
Total Household Income ($ billion)                                      $34.4
                                                                                Retailers
                                                                                Number of Retailers                                                                           243
                                                                                Experience based offering % 3                                                                 30%
                                                                 30 Minutes
                                                                                Centre Composition by GLA                                                   GLA               %
                                                                                Myer                                                                     16,404           22.7%
                                                                                David Jones                                                               8,182           11.3%
                                                                                Kmart                                                                     6,873            9.5%
                                                                                Cinemas                                                                   4,579            6.3%
                                                                                Coles                                                                     4,126            5.7%
                                                                                Woolworths                                                                3,400            4.7%
                                                                                Majors Total                                                             43,564           60.3%
                                                                                Specialties                                                              27,601           38.2%
                                                                                Offices                                                                   1,114            1.5%
                                                                                Total                                                                    72,279          100.0%
                                                                                Retailer In-store Sales Information                       2018             2019            2020
                                                                                Total Sales - MAT $m                                        na               na            $559
                                                                                Total Specialty Sales MAT $m                                na               na            $324
                                                                                Avg Sales per Specialty Store ($’000)                       na               na           $2,188
                                                                                Specialty Sales MAT $psm (
Trade Area Map         Westfield Local Heroes     Responsible Business Report

Burwood, NSW
100 BURWOOD ROAD, BURWOOD NSW 2134

Westfield Burwood is centrally located within Sydney’s Inner West,
approximately 12 kilometres from the CBD. Strategically positioned within
easy reach of Burwood Railway Station on the bustling commercial strip,
the centre currently caters to a trade area population just over 480,000
residents, with a total accessible market of 2.5 million residents.
Westfield Burwood is home to some of Australia’s most well-known
retailers, including David Jones, Kmart, Target, Coles and Woolworths.
The centre also boasts an Event Cinemas complex as well as over 200
specialty stores.
The Total Trade Area retail spend is estimated at $7.0 billion while the
Main Trade Area spend is estimated to be $3.8 billion.
Westfield Burwood’s spend per capita for the Main Trade Area is
estimated at $15,093 which is broadly in line with the Sydney Metro
average ($14,982).
The centre’s catchment area has a diverse population with 49% of the
Main Trade Area born outside Australia, and 36% born in Asia. A high
proportion of workers are professionals or other white-collar workers, and
there are pockets of high density living with nearly 49% of homes being
flats, units or apartments.

                                                                                                                                    232                   63,197m2                   $ 408.6m                           3,014
                                                                                                                                                                                      TOTAL ANNUAL RETAIL
                                                                                                                               NUMBER OF RETAILERS        GROSS LETTABLE AREA                                        CAR PARKING SPACES
                                                                                                                                                                                             SALES

2020 reported sales and visitation have been impacted by the COVID pandemic which caused restrictions to trading during the year
Customer & Demographics                                                                                                     Ownership & Site
Annual Visits 2020 (million)                                                                                  11.5          Centre Owner                                        Scentre Group (50%), Perron (50%)
Annual Visits 2019 (million)                                                                                  14.4          Site Area (ha)                                                                    3.2
Customer Advocacy - Net Promoter Score                                                                          23          Acquisition Date                                                                1992
                                                                                                               TTA          Book Value ($million) SCG Share                                               $522.7
Retail Expenditure ($ billion)                                                                                $7.0          Book Value ($million)                                                       $1,045.4
Average Household Income                                                                                  $104,904          Capitalisation Rate 1                                                          4.75%
                                                                                                                            Economic Yield 2                                                               5.41%
Drive Time                                                                                                 30 mins
                                                                                                                            Centre Opened                                                                   1966
Population - accessible market                                                                           2,505,000
                                                                                                                            Centre Redeveloped                                                 1972, 1976, 2000
Total Household Income ($ billion)                                                                           $72.6
                                                                                                                            Retailers
                                                                                                                            Number of Retailers                                                                           232
                                                                                                                            Experience based offering % 3                                                                 40%
                                                                                                     30 Minutes
                                                                                                                            Centre Composition by GLA                                                   GLA               %
                                                                                                                            David Jones                                                              14,658           23.2%
                                                                                                                            Kmart                                                                     6,121            9.7%
                                                                                                                            Target                                                                    5,933            9.4%
                                                                                                                            Cinemas                                                                   5,697            9.0%
                                                                                                                            Coles                                                                     3,919            6.2%
                                                                                                                            Woolworths                                                                3,625            5.7%
                                                                                                                            Majors Total                                                             39,953           63.2%
                                                                                                                            Specialties                                                              23,244           36.8%
                                                                                                                            Total                                                                    63,197          100.0%
                                                                                                                            Retailer In-store Sales Information                    2018              2019              2020
                                                                                                                            Total Sales - MAT $m                                   $480              $494              $409
                                                                                                                            Total Specialty Sales MAT $m                           $241              $245              $196
                                                                                                                            Avg Sales per Specialty Store ($’000)                 $1,204            $1,214            $1,025
                                                                                                                            Specialty Sales MAT $psm (
Trade Area Map         Westfield Local Heroes     Responsible Business Report

Carindale, QLD
1151 CREEK ROAD, CARINDALE QLD 4152

Westfield Carindale is situated in an affluent quarter of Brisbane’s south‑eastern
suburbs approximately 12 kilometres from the CBD. The centre currently
services a trade area population of nearly 700,000, and has a total accessible
market of 1.4 million residents with the nearby Gateway Motorway offering
convenient access to the centre.
One of the city’s leading retail and lifestyle destinations, Westfield Carindale is
home to many of Australia’s most well-known retailers including David Jones,
Myer, Big W, Target, Coles, Woolworths, ALDI and Apple, as well as a host of
premium fashion brands. An Event Cinemas complex and a range of other
retailers including approximately 380 specialty stores complete the retail offer
while the adjoining Carindale Home & Leisure Centre offers bulky goods retail.
In 2020, a $50 million development was completed which saw David Jones
consolidate from two levels to one to introduce the latest format store. This
provided an opportunity to introduce Kmart on the second level, a brand that is
much-loved and sought-after by our customers.
The total retail spend by the Westfield Carindale Total Trade Area in 2020 was
estimated at $9.9 billion while the total retail spend by the Main Trade Area was
estimated at $4.2 billion.
The centre’s total annual retail spend per capita in the Total Trade Area is
estimated at $14,239, 4% above the Brisbane Metro average ($13,728), while
the Main Trade Area is estimated to be $14,728, which is 7% above the Brisbane
Metro average ($13,728).
Westfield Carindale’s Main Trade Area had a high average household income
in 2016 of $110,814 per annum which is 11% above the Brisbane Metro average
($100,034). Household composition is in line with the Brisbane Metro average
with 29% being families with children under 15 years of age.
In the Main Trade Area, 78% of workers are professional or other white-collar
workers, which is above the Brisbane Metro average of 70%.                                                                          396                  136,362m2                   $ 839.9m                           5,897
                                                                                                                                                                                      TOTAL ANNUAL RETAIL
                                                                                                                               NUMBER OF RETAILERS        GROSS LETTABLE AREA                                        CAR PARKING SPACES
                                                                                                                                                                                             SALES

2020 reported sales and visitation have been impacted by the COVID pandemic which caused restrictions to trading during the year
Customer & Demographics                                                                                                     Ownership & Site
Annual Visits 2020 (million)                                                                                  12.8          Centre Owner                 Carindale Property Trust (50%), APPF (50%)
Annual Visits 2019 (million)                                                                                  14.0          Site Area (ha)                                                      15.8
Customer Advocacy - Net Promoter Score                                                                          43          Acquisition Date                                                   1999
                                                                                                               TTA          Book Value ($million) SCG Share                                  $724.1
Retail Expenditure ($ billion)                                                                                $9.9          Book Value ($million)                                          $1,448.2
Average Household Income                                                                                  $103,063          Capitalisation Rate 1                                            5.00%
                                                                                                                            Economic Yield 2                                                 5.71%
Drive Time                                                                                                 30 mins
                                                                                                                            Centre Opened                                                      1979
Population - accessible market                                                                           1,420,000
                                                                                                                            Centre Redeveloped                                           2012, 2020
Total Household Income ($ billion)                                                                           $40.3
                                                                                                                            Retailers
                                                                                                                            Number of Retailers                                                                           396
                                                                                                                            Experience based offering % 3                                                                 39%
                                                                                                     30 Minutes
                                                                                                                            Centre Composition by GLA                                                 GLA                 %
                                                                                                                            Myer                                                                   20,840             15.3%
                                                                                                                            Big W                                                                   8,527              6.3%
                                                                                                                            Target                                                                  8,020              5.9%
                                                                                                                            David Jones                                                             7,635              5.6%
                                                                                                                            Kmart                                                                   7,418              5.4%
                                                                                                                            Harvey Norman                                                           4,814              3.5%
                                                                                                                            Coles                                                                   4,167              3.1%
                                                                                                                            Woolworths                                                              3,971              2.9%
                                                                                                                            Cinemas                                                                 3,805              2.8%
                                                                                                                            Harris Scarfe                                                           2,589              1.9%
                                                                                                                            Aldi                                                                    1,672              1.2%
                                                                                                                            Majors Total                                                           73,458             53.9%
                                                                                                                            Specialties                                                            62,510             45.8%
                                                                                                                            Offices                                                                   394              0.3%
                                                                                                                            Total                                                                 136,362            100.0%
Specialty Sales Category Contribution 4
                                                                                                                            Retailer In-store Sales Information                    2018              2019              2020
                                                                     Refer to Glossary for detailed category descriptions   Total Sales - MAT $m                                   $896              $895              $840
30%
                                                                                                                            Total Specialty Sales MAT $m                           $505              $512              $483
25%
                                                                                                                            Avg Sales per Specialty Store ($’000)                 $1,660            $1,700            $1,654
20%                                                                                                                         Specialty Sales MAT $psm (
Trade Area Map         Westfield Local Heroes     Responsible Business Report

Carousel, WA
1382 ALBANY HWY, CANNINGTON WA 6107

Westfield Carousel is located on the Albany Highway in Perth’s south-
east, just 12 kilometres from the CBD. It currently caters to nearly one third
of the city’s population with the Total Trade Area population exceeding
655,000 and a total accessible market of 1.2 million residents. The centre
also benefits from its close proximity to two of Perth’s major university
campuses, Curtin University’s Bentley Campus and the South Street
Campus of Murdoch University.
A $350 million redevelopment, completed in 2018, delivered a new David
Jones department store as well as 70 new specialty stores, including 20
restaurants and 50 fashion retailers. Westfield Carousel now comprises 350
retailers across fashion, food, lifestyle, dining and entertainment.
The open-air rooftop dining and entertainment precinct features a fully
refurbished HOYTS, including a 14-screen complex and an upgraded LUX
Lounge. An iPlay, a dedicated kid’s play area and outdoor amphitheatre on
the rooftop provides casual entertainment for customers, day and night.
As part of the redevelopment, Westfield Carousel introduced a range of
new services including WA’s first shopping centre valet service, dedicated
Uber pick up and drop off zones and Park+.
In 2020 the total retail spend by the Westfield Carousel Total Trade Area
was estimated at $9.3 billion, with the total retail spend per capita for the
Total Trade Area estimated at $14,192, broadly in line with the Perth Metro
average ($14,493).

                                                                                                                                    353                  110,533m2                   $ 640.3m                           4,300
                                                                                                                                                                                      TOTAL ANNUAL RETAIL
                                                                                                                               NUMBER OF RETAILERS        GROSS LETTABLE AREA                                        CAR PARKING SPACES
                                                                                                                                                                                             SALES

2020 reported sales and visitation have been impacted by the COVID pandemic which caused restrictions to trading during the year
Customer & Demographics                                                                                                     Ownership & Site
Annual Visits 2020 (million)                                                                                   11.5         Centre Owner                                                          Scentre Group (100%)
Annual Visits 2019 (million)                                                                                   13.8         Site Area (ha)                                                                         21.6
Customer Advocacy - Net Promoter Score                                                                           40         Acquisition Date                                                                      1996
                                                                                                                TTA         Book Value ($million) SCG Share                                                  $1,405.0
Retail Expenditure ($ billion)                                                                                 $9.3         Book Value ($million)                                                             $1,405.0
Average Household Income                                                                                    $98,502         Capitalisation Rate 1                                                                4.75%
                                                                                                                            Economic Yield 2                                                                     5.10%
Drive Time                                                                                                 30 mins
                                                                                                                            Centre Opened                                                                         1972
Population - accessible market                                                                           1,155,000
                                                                                                                            Centre Redeveloped                                                             1999, 2018
Total Household Income ($ billion)                                                                           $34.4
                                                                                                                            Retailers
                                                                                                                            Number of Retailers                                                                           353
                                                                                                                            Experience based offering % 3                                                                 42%
                                                                                                     30 Minutes
                                                                                                                            Centre Composition by GLA                                                 GLA                 %
                                                                                                                            Myer                                                                   11,944             10.8%
                                                                                                                            David Jones                                                             8,662              7.8%
                                                                                                                            Cinemas                                                                 8,362              7.6%
                                                                                                                            Target                                                                  7,760              7.0%
                                                                                                                            Kmart                                                                   6,966              6.3%
                                                                                                                            Woolworths                                                              4,352              3.9%
                                                                                                                            Coles                                                                   4,041              3.7%
                                                                                                                            Majors Total                                                           52,087             47.1%
                                                                                                                            Specialties                                                            58,446             52.9%
                                                                                                                            Total                                                                 110,533            100.0%
                                                                                                                            Retailer In-store Sales Information                    2018              2019              2020
                                                                                                                            Total Sales - MAT $m                                   $536              $660              $640
                                                                                                                            Total Specialty Sales MAT $m                           $288              $376              $400
                                                                                                                            Avg Sales per Specialty Store ($’000)                 $1,084            $1,377            $1,471
                                                                                                                            Specialty Sales MAT $psm (
Trade Area Map         Westfield Local Heroes     Responsible Business Report

Chatswood, NSW
1 ANDERSON STREET, CHATSWOOD NSW 2067

Westfield Chatswood is located on Sydney’s affluent North Shore,
approximately 11 kilometres from the CBD. Conveniently situated within
easy reach of Chatswood train station, a major bus interchange and the
Pacific Highway, the centre currently caters to a trade area population of
approximately 485,000, with a total accessible market of 1.9 million, in
addition to a sizeable local workforce.
Westfield Chatswood is home to some of Australia’s leading retailers
including Myer, Target, Coles, Hoyts and ALDI as well as approximately 250
specialty stores including Zara and Uniqlo.
The total annual retail spend per capita for the Westfield Chatswood Total
Trade Area is estimated at $18,468, which is 23% above the Sydney Metro
average ($14,982) and the highest in the Scentre Group portfolio. The total
annual retail spend per capita for the Westfield Chatswood Main Trade
Area is estimated at $18,510 which is also 24% above the Sydney Metro
average ($14,982).
The total retail spend by the Westfield Chatswood Total Trade Area in 2020
was estimated at $9.0 billion and the total retail spend by the Main Trade
Area was estimated at $4.2 billion.
Average household income of the Main Trade Area in 2016 was $137,230
per annum which is 22% above the Sydney Metro average ($112,106), while
40% of households had incomes over $156,000 per annum.
90% of the trade area’s workers are managers, professionals or other white-
collar workers, which is well above the Sydney Metro average of 75%.
The centre has a culturally diverse market with 40% of the Main Trade Area
population being born outside of Australia including 24% in Asia.                                                                   251                   81,036m2                   $433.3 m                           2,831
                                                                                                                                                                                      TOTAL ANNUAL RETAIL
                                                                                                                               NUMBER OF RETAILERS        GROSS LETTABLE AREA                                        CAR PARKING SPACES
                                                                                                                                                                                             SALES

2020 reported sales and visitation have been impacted by the COVID pandemic which caused restrictions to trading during the year
Customer & Demographics                                                                                                     Ownership & Site
Annual Visits 2020 (million)                                                                                  14.4          Centre Owner                                                          Scentre Group (100%)
Annual Visits 2019 (million)                                                                                  18.3          Site Area (ha)                                                                          2.3
Customer Advocacy - Net Promoter Score                                                                          34          Acquisition Date                                                                      1993
                                                                                                               TTA          Book Value ($million) SCG Share                                                  $1,295.6
Retail Expenditure ($ billion)                                                                                $9.0          Book Value ($million)                                                             $1,295.6
Average Household Income                                                                                  $133,815          Capitalisation Rate 1                                                                4.50%
                                                                                                                            Economic Yield 2                                                                     4.80%
Drive Time                                                                                                 30 mins
                                                                                                                            Centre Opened                                                                         1987
Population - accessible market                                                                           1,870,000
                                                                                                                            Centre Redeveloped                                                       1994, 1999, 2015
Total Household Income ($ billion)                                                                           $65.8
                                                                                                                            Retailers
                                                                                                                            Number of Retailers                                                                           251
                                                                                                                            Experience based offering % 3                                                                 42%
                                                                                                     30 Minutes
                                                                                                                            Centre Composition by GLA                                                   GLA               %
                                                                                                                            Myer                                                                     23,429           28.9%
                                                                                                                            Target                                                                    8,757           10.8%
                                                                                                                            Cinemas                                                                   5,301            6.5%
                                                                                                                            Coles                                                                     2,217            2.7%
                                                                                                                            Aldi                                                                      1,637            2.0%
                                                                                                                            Majors Total                                                             41,341           51.0%
                                                                                                                            Specialties                                                              39,695           49.0%
                                                                                                                            Total                                                                    81,036          100.0%
                                                                                                                            Retailer In-store Sales Information                    2018              2019              2020
                                                                                                                            Total Sales - MAT $m                                   $579              $564              $433
                                                                                                                            Total Specialty Sales MAT $m                           $352              $358              $285
                                                                                                                            Avg Sales per Specialty Store ($’000)                 $1,614            $1,627            $1,396
                                                                                                                            Specialty Sales MAT $psm (
Trade Area Map        Westfield Local Heroes      Responsible Business Report

Chermside, QLD
GYMPIE & HAMILTON ROAD, CHERMSIDE QLD 4032

Westfield Chermside, located approximately 10 kilometres north of the
Brisbane CBD, is one of the strongest performing assets within Scentre
Group’s portfolio. The centre currently caters to a sizeable trade area
population of more than 840,000, with a total accessible market of 1.4
million residents.
Westfield Chermside is home to some of Australia’s most well-known
retailers including David Jones, Myer, Big W, Kmart, Target, Coles,
Woolworths and Apple. The centre also boasts an Event Cinemas complex
and approximately 450 specialty stores.
A $355 million redevelopment, completed in 2017 added approximately 95
new stores to the retail mix, including Brisbane’s first Sephora, H&M, Zara,
Uniqlo and a host of other local and international brands. A new leisure
and dining precinct set in a resort-style landscape features a selection of
boutique cafes and al fresco restaurants and has quickly become one of the
city’s most attractive dining destinations.
In 2020, the total retail spend in the Westfield Chermside Total Trade Area
was estimated at $12.1 billion while the total retail spend in the Main Trade
Area was estimated at $4.8 billion. The total annual retail spend per capita
is estimated at $14,500 for the Main Trade Area, which is 6% above the
Brisbane Metro average ($13,728).
Westfield Chermside’s Main Trade Area average household income in 2016
was $104,397 per annum, which is 4% above the Brisbane Metro average
($100,034), with 21% of households earning more than $156,000. The area
also has a high proportion of workers who are managers or other white-
collar workers (76%) compared to the Brisbane Metro average of 70%.
                                                                                                                                    475                  177,441m2                    $ 964.6m                          7,200
                                                                                                                                                                                      TOTAL ANNUAL RETAIL
                                                                                                                               NUMBER OF RETAILERS        GROSS LETTABLE AREA                                        CAR PARKING SPACES
                                                                                                                                                                                             SALES

2020 reported sales and visitation have been impacted by the COVID pandemic which caused restrictions to trading during the year
Customer & Demographics                                                                                                     Ownership & Site
Annual Visits 2020 (million)                                                                                  15.2          Centre Owner                                                       Scentre Group (100%)
Annual Visits 2019 (million)                                                                                  17.7          Site Area (ha)                                                                      22.1
Customer Advocacy - Net Promoter Score                                                                          44          Acquisition Date                                                                   1996
                                                                                                               TTA          Book Value ($million) SCG Share                                                $2,544.0
Retail Expenditure ($ billion)                                                                               $12.1          Book Value ($million)                                                          $2,544.0
Average Household Income                                                                                  $100,895          Capitalisation Rate 1                                                             4.50%
                                                                                                                            Economic Yield 2                                                                  4.78%
Drive Time                                                                                                 30 mins
                                                                                                                            Centre Opened                                                                      1957
Population - accessible market                                                                           1,430,000
                                                                                                                            Centre Redeveloped                                               1998, 2000, 2006, 2017
Total Household Income ($ billion)                                                                           $42.2
                                                                                                                            Retailers
                                                                                                                            Number of Retailers                                                                           475
                                                                                                                            Experience based offering % 3                                                                 42%
                                                                                                     30 Minutes
                                                                                                                            Centre Composition by GLA                                                 GLA                 %
                                                                                                                            Myer                                                                   15,528              8.8%
                                                                                                                            David Jones                                                            12,573              7.1%
                                                                                                                            Big W                                                                   8,157              4.6%
                                                                                                                            Target                                                                  7,791              4.4%
                                                                                                                            Cinemas                                                                 7,372              4.2%
                                                                                                                            Kmart                                                                   6,439              3.6%
                                                                                                                            Harris Scarfe                                                           4,043              2.3%
                                                                                                                            Coles                                                                   4,023              2.3%
                                                                                                                            Woolworths                                                              3,975              2.2%
                                                                                                                            Dan Murphys                                                             1,243              0.7%
                                                                                                                            Majors Total                                                           71,144             40.1%
                                                                                                                            Specialties                                                            83,392             47.0%
                                                                                                                            Offices                                                                22,905             12.9%
                                                                                                                            Total                                                                 177,441            100.0%
                                                                                                                            Retailer In-store Sales Information                    2018              2019              2020
Specialty Sales Category Contribution 4
                                                                                                                            Total Sales - MAT $m                                  $1,025            $1,055             $965
                                                                     Refer to Glossary for detailed category descriptions   Total Specialty Sales MAT $m                           $655              $672              $630
30%
                                                                                                                            Avg Sales per Specialty Store ($’000)                 $1,760            $1,827            $1,821
25%
                                                                                                                            Specialty Sales MAT $psm (
Trade Area Map         Westfield Local Heroes     Responsible Business Report

Coomera, QLD
FOXWELL ROAD, COOMERA QLD 4209

Westfield Coomera was Scentre Group’s first greenfield development. Completed
in 2018, the $470 million development delivered an unrivalled experience in retail,
dining, lifestyle and entertainment to the fast-growing corridor on the Gold Coast in
South-East Queensland.
Spanning 59,000 square metres (sqm) of indoor-outdoor retail and leisure
space, Westfield Coomera offers 140 specialty stores, a two-level dining and
entertainment precinct, market-style fresh food, quick eateries and a never-seen-
before purpose-built and expertly curated outdoor space for children and families,
The Backyard.
Westfield Coomera is home to iPlay Adventure featuring activities such as Clip
N Climb, a high-ropes course and laser-tag. Also, from the creators of iPlay, The
Park Coomera features a ‘putt-putt meets beer garden’ style venue with a bar and
pizzeria, full lane bowling, live music and more.
Complementing Westfield Coomera’s extensive dining, entertainment and leisure
credentials, the new Living Centre features Coles, Woolworths, Kmart, Target,
JB Hi-Fi, Rebel and Event Cinemas, including Gold Class. Catering to all ages,
the centre includes a carefully curated fashion mix and more than 140 specialty
retailers.
The centre is conveniently located just 500 metres off the Pacific Motorway (M1)
and next to the Coomera train station.
The centre currently services a Total Trade Area population of nearly 185,000
people, with a total accessible market of 765,000.
The total retail spend by the Westfield Coomera Total Trade Area in 2020 was
estimated at $2.5 billion while the total retail spend by the Main Trade Area was
estimated at $2.0 billion.
The average household income in the Total Trade Area in 2016 was $99,244 per
annum which was broadly in line with the Brisbane Metro average ($100,034).
                                                                                                                                    158                   57,729m2                   $ 248.7m                           2,433
Household composition skews towards families, with 39% of households                                                                                                                  TOTAL ANNUAL RETAIL
comprising families with children under 15 years of age, a figure that is well above                                           NUMBER OF RETAILERS        GROSS LETTABLE AREA
                                                                                                                                                                                             SALES
                                                                                                                                                                                                                     CAR PARKING SPACES

the Brisbane Metro average of 29%.
2020 reported sales and visitation have been impacted by the COVID pandemic which caused restrictions to trading during the year
Customer & Demographics                                                                                                     Ownership & Site
Annual Visits 2020 (million)                                                                                     6.0        Centre Owner                                            Scentre Group (50%), QIC (50%)
Annual Visits 2019 (million)                                                                                     6.7        Site Area (ha)                                                                    14.6
Customer Advocacy - Net Promoter Score                                                                           43         Acquisition Date                                                                 2018
                                                                                                                TTA         Book Value ($million) SCG Share                                                $195.0
Retail Expenditure ($ billion)                                                                                 $2.5         Book Value ($million)                                                          $390.0
Average Household Income                                                                                    $99,244         Capitalisation Rate 1                                                           5.75%
                                                                                                                            Economic Yield 2                                                                6.57%
Drive Time                                                                                                  30 mins
                                                                                                                            Centre Opened                                                                    2018
Population - accessible market                                                                              765,000
                                                                                                                            Centre Redeveloped                                                               2018
Total Household Income ($ billion)                                                                            $18.3
                                                                                                                            Retailers
                                                                                                                            Number of Retailers                                                                           158
                                                                                                                            Experience based offering % 3                                                                 49%
                                                                                                     30 Minutes
                                                                                                                            Centre Composition by GLA                                                   GLA               %
                                                                                                                            Kmart                                                                     6,533           11.3%
                                                                                                                            Cinemas                                                                   6,045           10.5%
                                                                                                                            Target                                                                    6,021           10.4%
                                                                                                                            Woolworths                                                                4,222            7.3%
                                                                                                                            Coles                                                                     3,763            6.5%
                                                                                                                            Majors Total                                                             26,584           46.0%
                                                                                                                            Specialties                                                              30,909           53.5%
                                                                                                                            Offices                                                                     236            0.4%
                                                                                                                            Total                                                                    57,729          100.0%
                                                                                                                            Retailer In-store Sales Information                       2018            2019             2020
                                                                                                                            Total Sales - MAT $m                                        na            $234             $249
                                                                                                                            Total Specialty Sales MAT $m                                na            $122             $135
                                                                                                                            Avg Sales per Specialty Store ($’000)                       na           $1,005           $1,159
                                                                                                                            Specialty Sales MAT $psm (
Trade Area Map         Westfield Local Heroes     Responsible Business Report

Doncaster, VIC
DONCASTER ROAD, DONCASTER VIC 3108

Westfield Doncaster is a world class Living Centre situated 17 kilometres from
the Melbourne CBD and currently catering to a trade area population over
770,000 residents, with a total accessible market of 2.3 million residents.
One of Melbourne’s largest shopping centres, Doncaster is home to many
of Australia’s leading brands including David Jones, Myer, Big W, Coles,
Woolworths, Apple and Zara. The centre boasts one of the best fashion offers
in the city with approximately 420 specialty stores, and complemented by
valet parking, electric car charging and styling services. This year, the centre’s
Target store will be transformed Into a Kmart store as part of the Kmart
Group’s plans to optimise its store network within the Westfield Living Centre
portfolio.
In 2020, a $30 million redevelopment of Westfield Doncaster’s level two
dining and entertainment precinct was completed. The new rooftop modern-
village style indoor/outdoor dining and entertainment precinct features 14
restaurants and has become a convenient and social dining destination for
Melbourne’s East.
The total retail spend in Westfield Doncaster’s Total Trade Area in 2020 was
estimated at $12.4 billion while the total retail spend in the Main Trade Area
is estimated at $6.0 billion. The total annual retail spend per capita for the
Westfield Doncaster Total Trade Area is estimated at $16,018 which is 7%
above the Melbourne metro average ($14,945).
The average household income in 2016 in the Main Trade area was $105,678
per annum which was 6% above the Melbourne Metro average ($99,752).
There are high levels of home ownership in the area with 76% of households
in the Main Trade Area owning their home or paying a mortgage, and also a
high proportion (81%) of all workers in the area are managers, professionals or                                                     430                  123,165m2                   $ 629.8m                           5,397
other white-collar workers.                                                                                                    NUMBER OF RETAILERS        GROSS LETTABLE AREA
                                                                                                                                                                                      TOTAL ANNUAL RETAIL
                                                                                                                                                                                             SALES
                                                                                                                                                                                                                     CAR PARKING SPACES

2020 reported sales and visitation have been impacted by the COVID pandemic which caused restrictions to trading during the year
Customer & Demographics                                                                                                     Ownership & Site
Annual Visits 2020 (million)                                                                                  10.7          Centre Owner          Scentre Group (50%), M&G Asia Fund (25%) ISPT (25%)
Annual Visits 2019 (million)                                                                                  15.5          Site Area (ha)                                                       14.3
Customer Advocacy - Net Promoter Score                                                                          41          Acquisition Date                                                    1993
                                                                                                               TTA          Book Value ($million) SCG Share                                  $1,115.5
Retail Expenditure ($ billion)                                                                               $12.4          Book Value ($million)                                            $2,231.0
Average Household Income                                                                                  $105,678          Capitalisation Rate 1                                              4.50%
                                                                                                                            Economic Yield 2                                                   5.09%
Drive Time                                                                                                 30 mins
                                                                                                                            Centre Opened                                                       1969
Population - accessible market                                                                           2,315,000
                                                                                                                            Centre Redeveloped                               1979, 1995, 2007/2008
Total Household Income ($ billion)                                                                           $64.7
                                                                                                                            Retailers
                                                                                                                            Number of Retailers                                                                           430
                                                                                                                            Experience based offering % 3                                                                 38%
                                                                                                     30 Minutes
                                                                                                                            Centre Composition by GLA                                                 GLA                 %
                                                                                                                            Myer                                                                   18,581             15.1%
                                                                                                                            David Jones                                                            14,846             12.1%
                                                                                                                            Big W                                                                   8,221              6.7%
                                                                                                                            Target                                                                  7,574              6.1%
                                                                                                                            Cinemas                                                                 5,208              4.2%
                                                                                                                            Woolworths                                                              4,278              3.5%
                                                                                                                            Coles                                                                   4,182              3.4%
                                                                                                                            Majors Total                                                           62,890             51.1%
                                                                                                                            Specialties                                                            56,990             46.3%
                                                                                                                            Offices                                                                 3,285              2.7%
                                                                                                                            Total                                                                 123,165            100.0%
                                                                                                                            Retailer In-store Sales Information                    2018              2019              2020
                                                                                                                            Total Sales - MAT $m                                   $935              $945              $630
                                                                                                                            Total Specialty Sales MAT $m                           $608              $622              $394
                                                                                                                            Avg Sales per Specialty Store ($’000)                 $1,816            $1,880            $1,301
Specialty Sales Category Contribution 4
                                                                                                                            Specialty Sales MAT $psm (
Trade Area Map         Westfield Local Heroes     Responsible Business Report

Eastgardens, NSW
152 BUNNERONG ROAD, EASTGARDENS NSW 2036

Westfield Eastgardens is located approximately 10 kilometres from the
Sydney CBD in the city’s south-eastern suburbs. Scentre Group manages
the centre and in 2018, acquired a 50% interest in Westfield Eastgardens,
with the remaining half owned by Terrace Tower Group.
Westfield Eastgardens is one of the top 30 shopping centres in Australia,
currently catering to a trade area population of approximately 315,000
residents, with a total accessible market of 2 million residents. Westfield
Eastgardens is home to some of Australia’s most trusted retailers including
Myer, Big W, Kmart, Target, Coles, Woolworths, and ALDI. There is also
a Hoyts cinema on site as well as a broad mix of retailers including
approximately 260 specialty stores.
The total retail spend by the Westfield Eastgardens Total Trade Area in
2020 was estimated at $5.2 billion while the total retail spend by the Main
Trade Area was estimated at $2.5 billion.
The total annual per capita retail spend for the Westfield Eastgardens Main
Trade Area is estimated at $14,950, which is broadly in line with the Sydney
Metro average ($14,982).
The centre serves a culturally diverse community with 41% of the Main Trade
Area population born in a country outside Australia including 24% born
in Asia.

                                                                                                                                    273                   83,010m2                   $572.0 m                           3,148
                                                                                                                                                                                      TOTAL ANNUAL RETAIL
                                                                                                                               NUMBER OF RETAILERS        GROSS LETTABLE AREA                                        CAR PARKING SPACES
                                                                                                                                                                                             SALES

2020 reported sales and visitation have been impacted by the COVID pandemic which caused restrictions to trading during the year
Customer & Demographics                                                                                                     Ownership & Site
Annual Visits 2020 (million)                                                                                  10.6          Centre Owner              Scentre Group (50%), Terrace Tower Group (50%)
Annual Visits 2019 (million)                                                                                  11.7          Site Area (ha)                                                       9.3
Customer Advocacy - Net Promoter Score                                                                          41          Acquisition Date                                                   2018
                                                                                                               TTA          Book Value ($million) SCG Share                                  $592.5
Retail Expenditure ($ billion)                                                                                $5.2          Book Value ($million)                                           $1,185.0
Average Household Income                                                                                  $109,202          Capitalisation Rate 1                                             4.50%
                                                                                                                            Economic Yield 2                                                  5.08%
Drive Time                                                                                                 30 mins
                                                                                                                            Centre Opened                                                      1987
Population - accessible market                                                                           2,040,000
                                                                                                                            Centre Redeveloped                                           2002, 2013
Total Household Income ($ billion)                                                                           $65.5
                                                                                                                            Retailers
                                                                                                                            Number of Retailers                                                                           273
                                                                                                                            Experience based offering % 3                                                                 44%
                                                                                                     30 Minutes
                                                                                                                            Centre Composition by GLA                                                  GLA                %
                                                                                                                            Myer                                                                    11,624            14.0%
                                                                                                                            Big W                                                                    7,905             9.5%
                                                                                                                            Kmart                                                                    7,422             8.9%
                                                                                                                            Target                                                                   7,342             8.8%
                                                                                                                            Coles                                                                    5,190             6.3%
                                                                                                                            Woolworths                                                               4,168             5.0%
                                                                                                                            Cinemas                                                                  3,873             4.7%
                                                                                                                            Aldi                                                                     1,660             2.0%
                                                                                                                            Majors Total                                                            49,184            59.3%
                                                                                                                            Specialties                                                             29,812            35.9%
                                                                                                                            Offices                                                                  4,014             4.8%
                                                                                                                            Total                                                                   83,010           100.0%
                                                                                                                            Retailer In-store Sales Information                     2018             2019              2020
                                                                                                                            Total Sales - MAT $m                                    $595             $608              $572
                                                                                                                            Total Specialty Sales MAT $m                            $251             $247              $228
Specialty Sales Category Contribution 4
                                                                                                                            Avg Sales per Specialty Store ($’000)                  $1,196           $1,230            $1,193
                                                                     Refer to Glossary for detailed category descriptions   Specialty Sales MAT $psm (
Trade Area Map         Westfield Local Heroes     Responsible Business Report

Fountain Gate, VIC
352 PRINCES HIGHWAY, FOUNTAIN GATE VIC 3805

Westfield Fountain Gate is located in one of Victoria’s fastest growing
municipalities, approximately 45 kilometres south-east of the Melbourne
CBD. The centre currently caters to a trade area population of approximately
585,000 residents, with a total accessible market of 1.6 million, and is one of
the largest shopping centres in Australia.
Westfield Fountain Gate is home to some of Australia’s leading brands
including Myer, Big W, Kmart, Target, Coles, Woolworths, ALDI and Apple.
There is also a Village Roadshow cinema and a diverse mix of retailers
including approximately 430 specialty stores.
The total retail spend by the Westfield Fountain Gate Total Trade Area is
estimated at $7.9 billion with the total retail spend by the Main Trade Area is
estimated at $5.4 billion.
There is a high level of home ownership in the local community with 78%
of residents in the Main Trade Area owning their own homes or paying a
mortgage, a figure well above the Melbourne Metro average of 69%. There is
also a high proportion of family households: 38% of households are families
with children under the age of 15 compared to the Melbourne average
of 28%.
The centre serves a diverse community, with 62% of Total Trade Area
residents employed as managers, professionals or other white-collar
occupations while 38% of residents work in blue collar roles.

                                                                                                                                    442                  178,123m2                    $779.1 m                          6,493
                                                                                                                                                                                      TOTAL ANNUAL RETAIL
                                                                                                                               NUMBER OF RETAILERS        GROSS LETTABLE AREA                                        CAR PARKING SPACES
                                                                                                                                                                                             SALES

2020 reported sales and visitation have been impacted by the COVID pandemic which caused restrictions to trading during the year
Customer & Demographics                                                                                                     Ownership & Site
Annual Visits 2020 (million)                                                                                   10.9         Centre Owner                                                          Scentre Group (100%)
Annual Visits 2019 (million)                                                                                   15.2         Site Area (ha)                                                                         46.1
Customer Advocacy - Net Promoter Score                                                                           36         Acquisition Date                                                                      1995
                                                                                                                TTA         Book Value ($million) SCG Share                                                   $1,920.0
Retail Expenditure ($ billion)                                                                                 $7.9         Book Value ($million)                                                             $1,920.0
Average Household Income                                                                                    $87,613         Capitalisation Rate 1                                                                4.50%
                                                                                                                            Economic Yield 2                                                                     4.81%
Drive Time                                                                                                 30 mins
                                                                                                                            Centre Opened                                                                         1970
Population - accessible market                                                                           1,575,000
                                                                                                                            Centre Redeveloped                                                       1980, 2001, 2012
Total Household Income ($ billion)                                                                           $40.3
                                                                                                                            Retailers
                                                                                                                            Number of Retailers                                                                           442
                                                                                                                            Experience based offering % 3                                                                 40%
                                                                                                     30 Minutes
                                                                                                                            Centre Composition by GLA                                                       GLA               %
                                                                                                                            Myer                                                                   12,000               6.7%
                                                                                                                            Cinemas                                                                 9,240              5.2%
                                                                                                                            Target                                                                  8,460              4.7%
                                                                                                                            Big W                                                                   8,052              4.5%
                                                                                                                            Kmart                                                                   7,998              4.5%
                                                                                                                            Harvey Norman                                                           7,030              3.9%
                                                                                                                            Woolworths                                                              4,303              2.4%
                                                                                                                            Coles                                                                   4,203              2.4%
                                                                                                                            Harris Scarfe                                                           2,900              1.6%
                                                                                                                            Aldi                                                                    1,739              1.0%
                                                                                                                            Majors Total                                                           65,925             37.0%
                                                                                                                            Specialties                                                           110,291             61.9%
                                                                                                                            Offices                                                                 1,907              1.1%
                                                                                                                            Total                                                                 178,123            100.0%
                                                                                                                            Retailer In-store Sales Information                    2018              2019              2020
Specialty Sales Category Contribution 4
                                                                                                                            Total Sales - MAT $m                                  $1,053            $1,071             $779
                                                                     Refer to Glossary for detailed category descriptions   Total Specialty Sales MAT $m                           $539              $552              $382
30%
                                                                                                                            Avg Sales per Specialty Store ($’000)                 $1,566            $1,619            $1,197
25%
                                                                                                                            Specialty Sales MAT $psm (
Trade Area Map         Westfield Local Heroes     Responsible Business Report

Garden City, QLD
CNR KESSELS & LOGAN RD, UPPER MT GRAVATT QLD 4122

Westfield Garden City is located in a thriving regional hub 12 kilometres
south of the Brisbane CBD. Well-served by major arterial roads, the centre
sits adjacent to a Queensland State Government-owned bus terminal
servicing Brisbane and the Gold Coast. It currently caters to a sizable trade
area population of nearly 640,000 residents, with a total accessible market
of 1.6 million residents.
Westfield Garden City is home to some of Australia’s most well-known
brands including David Jones, Myer, Big W, Kmart, Target, Coles,
Woolworths and ALDI. There is also an Event Cinemas complex on site as
well a broad mix of retailers including approximately 380 specialty stores.
The total retail spend by the Westfield Garden City Total Trade Area in 2020
was estimated at $8.6 billion while the total retail spend by the Main Trade
Area was estimated at $3.9 billion.
The total annual retail spend per capita for the Westfield Garden City Total
Trade Area is estimated at $13,547 per annum in 2020, which is broadly in
line with the Brisbane Metro average ($13,728).
The centre’s community is culturally diverse with 39% of the Main Trade
Area population born in a country outside Australia and 26% born in Asia.

                                                                                                                                    390                  142,404m2                   $746.9m                            6,254
                                                                                                                                                                                      TOTAL ANNUAL RETAIL
                                                                                                                               NUMBER OF RETAILERS        GROSS LETTABLE AREA                                        CAR PARKING SPACES
                                                                                                                                                                                             SALES

2020 reported sales and visitation have been impacted by the COVID pandemic which caused restrictions to trading during the year
Customer & Demographics                                                                                                     Ownership & Site
Annual Visits 2020 (million)                                                                                  14.5          Centre Owner                                                        Scentre Group (100%)
Annual Visits 2019 (million)                                                                                  18.1          Site Area (ha)                                                                       24.4
Customer Advocacy - Net Promoter Score                                                                          45          Acquisition Date                                                                    2003
                                                                                                               TTA          Book Value ($million) SCG Share                                                 $1,490.0
Retail Expenditure ($ billion)                                                                                $8.6          Book Value ($million)                                                          $1,490.0
Average Household Income                                                                                   $97,036          Capitalisation Rate 1                                                              5.00%
                                                                                                                            Economic Yield 2                                                                   5.34%
Drive Time                                                                                                 30 mins
                                                                                                                            Centre Opened                                                                       1971
Population - accessible market                                                                           1,610,000
                                                                                                                            Centre Redeveloped                                               1980, 2000, 2004, 2014
Total Household Income ($ billion)                                                                           $45.2
                                                                                                                            Retailers
                                                                                                                            Number of Retailers                                                                           390
                                                                                                                            Experience based offering % 3                                                                 45%
                                                                                                     30 Minutes
                                                                                                                            Centre Composition by GLA                                                 GLA                 %
                                                                                                                            David Jones                                                            14,331             10.1%
                                                                                                                            Myer                                                                   12,898              9.1%
                                                                                                                            Big W                                                                  10,050              7.1%
                                                                                                                            Cinemas                                                                 8,839              6.2%
                                                                                                                            Kmart                                                                   7,119              5.0%
                                                                                                                            Target                                                                  6,936              4.9%
                                                                                                                            Harvey Norman                                                           6,220              4.4%
                                                                                                                            Woolworths                                                              4,285              3.0%
                                                                                                                            Coles                                                                   3,615              2.5%
                                                                                                                            Aldi                                                                    1,516              1.1%
                                                                                                                            Majors Total                                                           75,809             53.2%
                                                                                                                            Specialties                                                            66,507             46.7%
                                                                                                                            Offices                                                                    88              0.1%
                                                                                                                            Total                                                                 142,404            100.0%
                                                                                                                            Retailer In-store Sales Information                    2018              2019             2020
Specialty Sales Category Contribution 4                                                                                     Total Sales - MAT $m                                   $798              $815             $747
                                                                     Refer to Glossary for detailed category descriptions   Total Specialty Sales MAT $m                           $455              $454             $416
30%
                                                                                                                            Avg Sales per Specialty Store ($’000)                 $1,394            $1,437           $1,428
25%                                                                                                                         Specialty Sales MAT $psm (
You can also read