Property Compendium 31 December 2019 - Scentre Group

Page created by Tammy Ramos
 
CONTINUE READING
Property Compendium 31 December 2019 - Scentre Group
Property Compendium
31 December 2019
Property Compendium 31 December 2019 - Scentre Group
Contents

        Portfolio Overview ......................................1
           Operating Performance ............................... 3
           Retailers and Lease Expiry Profile ............ 4
           Portfolio Details .............................................. 6
        Scentre Group Property Profiles .............. 7
           Westfield Airport West, VIC......................... 8               Westfield Liverpool, NSW..........................30
           Westfield Albany, NZ..................................... 9          Westfield Manukau, NZ...............................31
           Westfield Belconnen, ACT..........................10                 Westfield Marion, SA...................................32
           Westfield Bondi Junction, NSW................. 11                    Westfield Miranda, NSW.............................33
           Westfield Booragoon, WA..........................12                  Westfield Mt Druitt, NSW...........................34
           Westfield Burwood, NSW...........................13                  Westfield Newmarket, NZ..........................35
           Westfield Carindale, QLD........................... 14               Westfield North Lakes, QLD.....................36
           Westfield Carousel, WA...............................15              Westfield Parramatta, NSW....................... 37
           Westfield Chatswood, NSW.......................16                    Westfield Penrith, NSW...............................38
           Westfield Chermside, QLD......................... 17                 Westfield Plenty Valley, VIC......................39
           Westfield Coomera, QLD............................18                 Westfield Riccarton, NZ..............................40
           Westfield Doncaster, VIC............................19               Westfield Southland, VIC............................ 41
           Westfield Eastgardens, NSW....................20                     Westfield St Lukes, NZ................................42
           Westfield Fountain Gate, VIC....................21                   Westfield Sydney, NSW..............................43
           Westfield Garden City, QLD......................22                   Westfield Tea Tree Plaza, SA....................44
           Westfield Geelong, VIC..............................23               Westfield Tuggerah, NSW..........................45
           Westfield Helensvale, QLD.......................24                   Westfield Warringah Mall, NSW...............46
           Westfield Hornsby, NSW............................25                 Westfield West Lakes, SA.......................... 47
           Westfield Hurstville, NSW..........................26                Westfield Whitford City, WA......................48
           Westfield Innaloo, WA................................. 27            Westfield Woden, ACT................................49
           Westfield Knox, VIC.....................................28           Glossary.......................................................... 50
           Westfield Kotara, NSW................................29              Directory...........................................................51

WESTFIELD NEWMARKET

 PAGE b / SCENTRE GROUP PROPERTY COMPENDIUM 2019                                                          FRONT COVER IMAGE: WESTFIELD NEWMARKET
Property Compendium 31 December 2019 - Scentre Group
Portfolio Overview

           Scentre Group owns and operates an extraordinary platform of 42                 Living
           Centres with over 548 million annual customer visits.
           Valued at $56 billion and generating $25 billion of annual retail in-store sales, Westfield
           Living Centres are regarded as the first choice platform for retail and brand partners to
           connect and interact with customers.
           Scentre Group owns 7 of the top 10 centres in Australia, and 4 of the top 5 centres in
           New Zealand. More than 33% of Scentre Group’s portfolio generates annual retail sales
           of greater than $1 billion, and more than 80% generates annual retail sales of greater
           than $500 million.
           Scentre Group has unrivalled access to potential customers, with over 65% of the
           Australian population living within a 30 minute drive of a Westfield Living Centre.
           Our portfolio comprises 12,000 retailers and represents a diverse range of 3,600
           brands, including 344 new brands which were introduced during 2019, and 279 existing
           brands which continued to grow and open new stores with us.
           Over 7.5% of all retail sales in Australia occur in a Westfield Living Centre. This
           demonstrates the important role of physical stores in attracting and retaining customers,
           building brand advocacy and influencing sales across the retail ecosystem.
           Currently 43% of the stores across our platform are experience-based offerings,
           providing retail services and experiences like dining, entertainment, health, fitness,
           financial, education and beauty services, which can only be consumed on-site.
           Scentre Group’s portfolio has been over 99% leased for more than 20 years, and has
           had over 60 years of continuous comparable net income growth.
           Scentre Group has a vertically integrated operating platform with proven capability in
           development, design, construction, leasing and management, with current and future
           development activity in excess of $3.8 billion.

WESTFIELD SYDNEY                                                                                 WESTFIELD NEWMARKET

    PAGE 1 / SCENTRE GROUP PROPERTY COMPENDIUM 2019
Property Compendium 31 December 2019 - Scentre Group
Scentre Group Portfolio
       High quality retail property – strategically located within high population-growth trade areas.

                                                                                                                                                               Australia &
                                                                                                                                                           New Zealand Portfolio

                                                                                                                                                          42
                                                                                                                                                       Westfield        > 548m
                                                                                                                                                    Living Centres        Annual

                                                                                         Brisbane    $6.3bn
                                                                                                                       3.1m
                                                                                                                    Population
                                                                                                                                            $38.2bn                1     Customer
                                                                                                                                                                           visits
                                                                                                                       6 CENTRES
                                                                                                                                               SCG share of AUM

                                                                Adelaide                            Sydney             5.7m
                         Perth                                                                     Sydney            Population

       2.0m              $2.6bn2                                      $1.3bn                       $18.6bn
                                                    1.4m                            Canberra                           15 CENTRES

      Population                                  Population                             $1.2bn
        4 CENTRES                                                              Melbourne                                            Auckland
                                                                                                              0.5m
                                                    3 CENTRES

                                                                                    $5.7bn                   Population
                                                                   5.1m                                        2 CENTRES
                                                                Population
                                                                  7 CENTRES

         Book value of assets as at 31 December 2019                                                                                                 2.3m
                                                                                                                                                    Population
 1.   Includes construction in progress and assets held for development of $0.6bn                                                                    5 CENTRESS
 2.   Includes the acquisition of Westfield Booragoon                                                                               Christchurch
                                                                                                                                                   NZ$1.7bn

            As at 31 December 2019, Scentre Group’s
            portfolio included 42         living centres
            spread across Australia and New Zealand,
            with the Group’s ownership interests valued
            at $38.2 billion 1.

        Portfolio by GLA
                                        NSW                                                  VIC                                    QLD                   SA       WA    ACT     NZ

                                        36%                                                  19%                                    18%                  8%        8%    4%      7%

        Portfolio By Asset Value (SCG Share)
                                                   NSW                                                             VIC                             QLD            SA    WA    ACTNZ

                                                    50%                                                            15%                             17%            4%    7%     3% 4%

           [1. Pro forma post sale of four Australian assets, settlement expected Q3 2015]

PAGE 2 / SCENTRE GROUP PROPERTY COMPENDIUM 2019
Property Compendium 31 December 2019 - Scentre Group
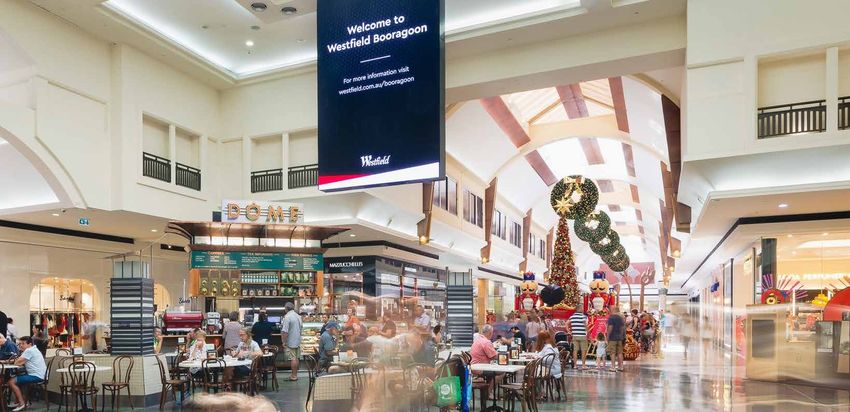
WESTFIELD BONDI JUNCTION

       Operating Performance
        Scentre Group’s portfolio has a long track record of
        delivering strong operating metrics, and the portfolio has
        remained in excess of 99% leased for more than 20 years.

         Operating Performance of
         Scentre Group’s Portfolio

         Combined Portfolio                                                                           2019              2018
         Total Annual Sales                                                                        $25.0bn           $24.0bn
         Comparable Specialty Store Sales Growth                                                      2.2%               1.5%
         Average Sales per Specialty Store (‘000)                                                   $1,525             $1,468
         Specialty Store Rent (psm)                                                                 $1,689             $1,654
         Comparable Net Property Income Growth                                                        2.0%               2.5%

         Specialty Sales MAT $psm (
Property Compendium 31 December 2019 - Scentre Group
Retailers and Lease Expiry Profile
       Anchor Retailers
       Scentre Group is the major landlord and an integral partner to major household retail
       brands such as David Jones, Myer, Farmers, Target, Kmart, BIG W, Coles, Woolworths
       and Aldi. Anchor retailers generally have lease terms of 15 to 25 years with stepped
       increases throughout the term that can be fixed, linked to the consumer price index
       (CPI) or sales turnover based. As of 31 December 2019, anchor retailers represented
       51% of GLA and 17% of rental income. The following table outlines the anchor retailers
       in Scentre Group’s portfolio as of 31 December 2019:

       Anchor Retailers                              No. of              GLA          % of     Average Lease
                                                     Stores            (000’s        Retail   Term Remaining
                                                                         sqm)         GLA             (years)

       Department Stores
       Myer                                             23              411.0        10.9%               8.8
       David Jones                                      19             244.7          6.5%               9.1
       Farmers                                           5               41.2         1.1 %              7.7
       Harris Scarfe                                    10               29.5         0.8%               2.6
       Sub Total                                        57             726.4         19.3%               8.6
       Discount Department Stores
       Target                                           33             247.3          6.6%               8.9
       Kmart                                            28             195.4          5.2%              10.2
       BIG W                                            19             154.6           4.1%              8.0
       Sub Total                                        80             597.3         15.8%               9.1
       Supermarkets
       Coles                                            36             141.3          3.7%               9.7
       Woolworths                                       33             139.5          3.7%               6.0
       Aldi                                             18              27.5          0.7%               7.9
       Countdown                                         3              11.3          0.3%              10.8
       Pak N Save                                        1               6.3          0.2%               4.5
       Spudshed                                          1               4.7           0.1%              4.9
       New World                                         1               3.4           0.1%              2.7
       Sub Total                                        93             333.9          8.9%               7.8
       Cinemas
       Event Cinemas                                    18             107.6          2.9%               7.3
       Hoyts                                            11              55.2          1.5%               8.4
       Village Roadshow                                  6              38.5          1.0%               7.9
       Birch Carroll & Coyle                             2              14.2          0.4%              11.8
       Reading Cinemas                                   1               4.3           0.1%              0.0
       Sub Total                                        38             219.8          5.8%               7.8
       Others
       Harvey Norman                                     5               25.9         0.7%               3.0
       Bunnings Warehouse                                3               17.8         0.5%               2.5
       Dan Murphy’s                                      7                9.8         0.3%               6.0
       Sub Total                                        15               53.5         1.4%               3.4

       Grand Total                                    283            1,930.9         51.2%               8.4

                                            SCENTRE GROUP PROPERTY COMPENDIUM 2016

PAGE 4 / SCENTRE GROUP PROPERTY COMPENDIUM 2019               -4-
Property Compendium 31 December 2019 - Scentre Group
Other Retailers
       Specialty retailers generally have lease terms of 5 to 7 years, and for larger stores
       5 to 10 years. Specialty store retailers generally have leases with annual contracted
       increases of CPI plus 2% to 3%. For the year ended 31 December 2019, the 10 largest
       specialty store retailers represented 8% of GLA and contributed 10% of rental income.
       The following table outlines the 10 largest specialty store retailers as of
       31 December 2019:

        Retailers                                                                                         No of             GLA             % of
                                                                                                         Stores           (000's           Retail
                                                                                                                            sqm)            GLA

        Super Retail Group                                                                                       44             58.1           1.5%
         (Rebel Sport, Macpac, Supercheap Auto)
        Cotton On Group                                                                                          154            47.7           1.3%
          (Cotton On, Cotton On Kids, Cotton On Body, Typo,
           Rubi Shoes, Factorie, Supre)
        JB Hi Fi                                                                                                 35             41.5           1.1%
         (JB Hi Fi, JB Hi Fi Home)
        The Just Group                                                                                           219            31.2           0.8%
         (Just Jeans, Jay Jays, Jacqui E, Peter Alexander, Portmans, Dotti, Smiggle)
        H&M                                                                                                       11            29.2           0.8%
        Best & Less                                                                                              20             21.6           0.6%
        ZARA                                                                                                     10              21.2          0.6%
        Country Road Group                                                                                        91            20.9           0.6%
         (Country Road, Trenery, Witchery, Mimco, Politix)
        Australian Pharmaceutical Industries                                                                      51            19.8           0.5%
         (Priceline, Priceline Pharmacy, Soul Pattinson Chemist, Clear Skincare Clinics)
        Mosaic Brands Ltd                                                                                        126            19.0           0.5%
         (Noni B, Rockmans, W Lane, Beme, Millers, Katies, Crossroads, Rivers, Autograph)

        Total                                                                                                761          310.2                8.2%

       Lease Expiry Profile
       For the year ended 31 December 2019, Scentre Group completed 2,566 lease deals, covering an aggregate of
       420,239 square metres. Scentre Group has a 6.0 year weighted average unexpired lease term across the portfolio.

         Total Portfolio % Leased Area                                       Specialty Store Retailers
                                                                             % Leased Area

         25%                                                                 25%

        20%                                                                  20%    16.6

                                                                                           14.6

         15%                                                                  15%
                                                                                                  11.6    11.6
                                                                                                                   10.1
         10%    10.5
                             9.8
                                                                              10%
                       8.6         8.8
                                         7.4   6.9                                                                        5.6      5.9
          5%                                                                   5%
                                                     4.7                                                                                 3.5
                                                           3.4         3.8
                                                                 2.6                                                                             2.4   2.5

          0%                                                                   0%
       Expiring 2020 2021 2022 2023 2024 2025 2026 2027 2028 2029            Expiring 2020 2021 2022 2023 2024 2025 2026 2027 2028 2029

PAGE 5 / SCENTRE GROUP PROPERTY COMPENDIUM 2019
Property Compendium 31 December 2019 - Scentre Group
Portfolio Details
   At               Ownership                 Book Capitalisation       Economic           Total  Average        Gross    Number                  Annual
   31 December 2019   Interest                Value         Rate            Yield 1        Sales Sales Per    Lettable of Tenants                  Visits
                                               SCG                                          MAT Spec’ Store       Area
                                   (%)         ($m)                                         ($m)   ($’000) (000’s sqm)                                (m)
   Australia
   Australian Capital Territory
   Belconnen                    100%          890.0           5.50%           5.86%       538.3         1,198           96.1          277           11.0
   Woden                          50%         350.0           5.50%           6.23%       377.9         1,167           72.9          244             9.9
   New South Wales
   Bondi Junction               100%        3,305.9           4.13%           4.40%     1,172.2         2,380         131.3           469           20.8
   Burwood                        50%         575.1           4.75%           5.40%       494.1         1,214           63.2          236           14.4
   Chatswood                    100%        1,407.4           4.50%           4.81%       563.7         1,627           81.1          257           18.3
   Eastgardens                    50%         720.0           4.25%           4.78%       608.2         1,230           82.7          279           11.7
   Hornsby                      100%        1,095.3           5.25%           5.62%       679.3         1,284           99.5          317           17.6
   Hurstville                     50%         442.5           5.13%           5.86%       565.2         1,386           61.2          250           19.6
   Kotara                       100%        1,080.0           5.00%           5.32%       495.0         1,178           82.4          280             8.3
   Liverpool                      50%         545.1           5.25%           5.97%       511.8         1,152           82.5          333           14.8
   Miranda                        50%       1,316.0           4.38%           4.94%       966.7         1,681         128.3           444           15.4
   Mt Druitt 3                    50%         322.5           5.50%           6.27%       414.5         1,056           60.4          232           12.0
   Parramatta                     50%       1,109.4           4.50%           5.13%       879.6         1,632         137.2           457           33.5
   Penrith                        50%         757.5           4.75%           5.36%       691.6         1,782           91.3          322           17.2
   Sydney 4                     100%        4,220.0           4.11%           4.38%     1,271.7         3,667           91.7          297           42.0
   Tuggerah                     100%          810.0           5.38%           5.74%       484.4         1,276           83.3          251             9.4
   Warringah Mall                 50%         925.0           5.00%           5.62%       746.5         1,328         131.6           381           12.4
   Queensland
   Carindale 3,5                  50%         840.1           4.75%           5.41%       894.8         1,700         136.2           404           14.0
   Chermside                    100%        2,838.5           4.13%           4.40%     1,055.4         1,827         177.4           489           17.7
   Coomera                        50%         210.5           5.50%           6.30%       233.7         1,005           58.2          160             6.7
   Garden City                  100%        1,740.0           4.75%           5.08%       814.5         1,437         142.4           397           18.1
   Helensvale                     50%         225.0           5.75%           6.56%       329.1         1,120           44.9          186             7.2
   North Lakes                    50%         484.0           5.00%           5.71%       702.1         1,372         115.0           277           12.4
   South Australia
   Marion                         50%         680.0           5.25%           6.08%       847.9         1,586         136.7           325           13.3
   Tea Tree Plaza                 50%         399.5           5.38%           6.26%       543.1         1,312           99.3          259           11.3
   West Lakes                     50%         240.5           6.00%           6.98%       416.8         1,172           71.2          243             7.1
   Victoria
   Airport West                   50%         206.5           5.75%           6.60%       363.4         1,164           53.0          169             7.4
   Doncaster                      50%       1,266.0           4.25%           4.82%       945.2         1,880         122.7           432           15.5
   Fountain Gate                100%        2,285.0           4.13%           4.41%     1,071.4         1,619         178.1           448           15.2
   Geelong                        50%         268.5           5.65%           6.50%       279.6         1,106           51.6          171             8.6
   Knox                           50%         577.5           5.50%           6.28%       635.9         1,302         142.0           409           13.5
   Plenty Valley                  50%         263.0           5.25%           6.10%        418.1         1,267          63.4           195            8.7
   Southland                      50%         850.0           4.62%           5.27%       857.0         1,379         129.0           385           14.6
   Western Australia
   Booragoon                      50%         570.0           4.75%           5.31%          na             na          72.9          258             na
   Carousel                     100%        1,450.0           5.00%           5.24%       660.3          1,377         109.8          362            13.8
   Innaloo                      100%          310.0           5.75%           6.24%       339.2           951           47.0          168             8.2
   Whitford City                  50%         297.5           5.75%           6.68%       478.5         1,075           85.1          291             7.1
   New Zealand (NZD)
   Albany                         51%         316.2           5.88%           6.65%       416.9         1,964           53.3          145             8.3
   Manukau                        51%         220.3           6.38%           7.27%       308.4         1,666           45.2          187             8.1
   Newmarket 2                    51%         621.6           5.25%           5.79%          na 7           na          88.2          258             3.6 7
   Riccarton                      51%         334.1           6.38%           7.24%       531.4         2,048           55.3          193           12.6
   St Lukes                       51%         247.4           6.63%           7.54%       359.5         1,428           39.8          171             7.0
   Total Portfolio (AUD)                  37,542.8            4.72% 6         5.19%   25,000.3          1,525       3,894.3        12,308         548.0
  1   Capitalisation Rate adjusted for the benefit of internal and external       5   Carindale Property Trust (CPT) has a 50% interest in this shopping
      management.                                                                     centre. As at 31 December 2019, the Group has a 62.6% interest in CPT.
  2   Development completed during the year.                                      6   Weighted average capitalisation rate including non-retail assets.
  3   Properties currently under redevelopment.                                   7   Part year of trading.
  4   Sydney comprises Sydney Central Plaza and the Sydney City retail            8   Experience based offering includes dining, entertainment, health,
      complex. As at 31 December 2019, the weighted average capitalisation            fitness, financial, education, and beauty services, which can only be
      rate of Sydney was 4.11%, comprising Sydney City 4.00% and Sydney               consumed on-site.
      Central Plaza 4.50%.
PAGE 6 / SCENTRE GROUP PROPERTY COMPENDIUM 2019
Property Compendium 31 December 2019 - Scentre Group
Scentre Group
       Property Profiles

                                                  WESTFIELD CAROUSEL

    Westfield Chatswood

PAGE 7 / SCENTRE GROUP PROPERTY COMPENDIUM 2019
Property Compendium 31 December 2019 - Scentre Group
Westfield
        Airport West, VIC
        29-35 LOUIS STREET, AIRPORT WEST VIC 3042

                                                                                                                              Westfield Airport West is conveniently located just 10 minutes from
                                                                                                                              Tullamarine Airport and caters to a trade area population of approximately
                                                                                                                              335,000 residents.
                                                                                                                              The centre boasts a reliable retail offer that includes Coles, Woolworths and
                                                                                                                              ALDI, discount department stores, and over 150 specialty stores.
                                                                                                                              High rates of home ownership, and household incomes that are in line with
                                                                                                                              the Melbourne metropolitan average, are found in the Main Trade Area.
                                                                                                                              Family composition is broadly in line with the Melbourne average, with 26%
                                                                                                                              of households being families with children under 15 years.
                                                                                                                              The Total Trade Area retail spend in 2019 was estimated to be $4.6 billion
                                                                                                                              with the Main Trade Area spend estimated to be $1.5 billion with retail
                                                                                                                              spend per capita ($14,633) broadly in line with the Melbourne metro
                                                                                                                              average ($14,821). Average household incomes in the Main Trade Area as
                                                                                                                              at the 2016 Census were $97,194 per annum which was also broadly in line
                                                                                                                              with the Melbourne metro average ($99,752).

                                                                                                                                        Link to Trade Area Map

                                                                                                                                        Link to Westfield Local Heroes
     169
      171                     52,976
                               52,289 m
                                      m22                   $363.4
                                                              $341.0m                               2,640
                                                                                                     2,640
 NUMBER OF RETAILERS           GROSS LETTABLE AREA         TOTAL ANNUAL
                                                             TOTAL      RETAIL
                                                                   ANNUAL      SALES
                                                                           RETAIL                  CAR PARKING SPACES
NUMBER OF RETAILERS           GROSS LETTABLE AREA                                                 CAR PARKING SPACES
                                                                    SALES

       Customer & Demographics                                                                                           Ownership & Site
       Annual Visits (million)                                                                                     7.4   Centre Owner                                            Scentre Group (50%)
       Customer Advocacy - Net Promoter Score                                                                      26                                                                    Perron (50%)
       Average Household Income (TTA)                                                                         $95,046  Site Area (ha)                                                             16.2
                                                                                                MTA               TTA  Aquisition Date                                                          1982
       Retail Expenditure ($ billion)                                                           $1.5             $4.6  Book Value ($million) SCG Share                                        $206.5
       Population                                                                            101,083          335,474  Book Value ($million)                                                  $413.0
       Expected Population Growth                                                               0.8%             1.5%  Capitalisation Rate 1                                                   5.75%
                                                                                                                       Economic Yield 2                                                        6.60%
       Retailer In-store Sales Information                                    2017              2018             2019 Centre Opened                                                             1976
       Total Sales - MAT $m                                                   $341             $345              $363 Centre Redeveloped                                      1986, 1989, 1996, 1999
       Total Specialty Sales MAT $m                                           $138             $140              $145
       Avg Sales per Specialty Store ($’000)                                 $1,090           $1,141            $1,164 Retailers
       Specialty Sales MAT $psm (
Albany, NZ
       219 DON MCKINNON DRIVE, AUCKLAND 0632, NEW ZEALAND

                                                                                                             Westfield Albany is located north of the Waitemata Harbour approximately
                                                                                                             15 kilometres northwest of the Auckland CBD in one of the city’s newest
                                                                                                             suburbs. The centre caters to a trade area population of nearly 400,000
                                                                                                             residents.
                                                                                                             Westfield Albany is home to some of New Zealand’s best-known retailers
                                                                                                             including Farmers, Kmart, New World and JB Hi-Fi as well as Event Cinemas
                                                                                                             and approximately 140 specialty stores.
                                                                                                             The total retail spend in Westfield Albany’s Total Trade Area in 2018 was
                                                                                                             estimated at $6.7 billion while the total retail spend in the Main Trade
                                                                                                             Area was estimated at $3.7 billion. The total retail spend per capita for the
                                                                                                             Westfield Albany Main Trade Area was estimated at $16,428 per annum in
                                                                                                             2018, which is broadly in line with the Auckland Region average ($16,271).
                                                                                                             The average household income in the Main Trade Area in 2013 was
                                                                                                             $92,848 per annum which is also broadly in line with the Auckland Region
                                                                                                             average ($90,799).

                                                                                                                       Link to Trade Area Map

                                                                                                                       Link to Westfield Local Heroes
     145
      171                  53,326
                            52,289 m
                                   m22               $416.9
                                                       $341.0m                      2,373
                                                                                    2,640
                                                      TOTAL ANNUAL RETAIL
NUMBER
 NUMBEROF
       OF RETAILERS
          RETAILERS          GROSS
                              GROSSLETTABLE
                                   LETTABLE AREA
                                             AREA   TOTAL ANNUAL RETAIL SALES     CAR
                                                                                   CARPARKING
                                                                                      PARKING SPACES
                                                                                              SPACES
                                                             SALES

                                                                                                                                                                     ALL CURRENCY IN NZD

       Customer & Demographics                                                                          Ownership & Site
       Annual Visits (million)                                                                    8.3   Centre Owner                                                 Scentre Group (51%)
       Customer Advocacy - Net Promoter Score                                                     38                                                                           GIC (49%)
       Average Household Income (TTA)                                                        $92,856  Site Area (ha)                                                                20.8
                                                                                   MTA           TTA  Aquisition Date                                                              2007
       Retail Expenditure ($ billion)                                              $3.7         $6.7  Book Value ($million) SCG Share                                            $316.2
       Population                                                               222,820      398,320  Book Value ($million)                                                      $620.0
       Expected Population Growth                                                  2.0%         2.0%  Capitalisation Rate 1                                                       5.88%
                                                                                                      Economic Yield 2                                                            6.65%
       Retailer In-store Sales Information                            2017     2018             2019 Centre Opened                                                                 2007
       Total Sales - MAT $m                                           $408    $423              $417 Centre Redeveloped                                                            2007
       Total Specialty Sales MAT $m                                   $242    $256              $246
       Avg Sales per Specialty Store ($’000)                         $1,968 $2,046             $1,964 Retailers
       Specialty Sales MAT $psm (
Belconnen, ACT
        BENJAMIN WAY, BELCONNEN ACT 2617
                                                                                                               Located in the northern suburbs of Canberra, Westfield Belconnen is one of
                                                                                                               Canberra’s largest retail destinations. Located 13 kilometres from the CBD,
                                                                                                               the centre services a total trade area population of approximately 465,000
                                                                                                               residents.
                                                                                                               Westfield Belconnen is home to some of Australia’s most well-known
                                                                                                               retailers including Myer, Kmart, Target, Coles, Woolworths and ALDI. The
                                                                                                               centre also boasts a Sky Zone and more than 250 specialty stores.
                                                                                                               The centre’s Total Trade Area retail spend was estimated at $8.2 billion in
                                                                                                               2019 while the total retail spend for the Main Trade Area was estimated at
                                                                                                               $3.6 billion.
                                                                                                               The Main Trade Area was characterised at the 2016 Census by a high
                                                                                                               average household income of $116,925 per annum, 4% above the Sydney
                                                                                                               Metro average ($112,106).
                                                                                                               The total annual retail spend per capita in the Main Trade Area is estimated
                                                                                                               at $17,229, 16% above the Sydney Metro average ($14,873).
                                                                                                               There is a high concentration of professional workers in the centre’s
                                                                                                               Main Trade Area owing to the abundance of sizeable commercial and
                                                                                                               government employers in the area. 67% own their own home or are
                                                                                                               paying off a mortgage, while 32% of households are families with children
                                                                                                               under 15.

                                                                                                                         Link to Trade Area Map

                                                                                                                         Link to Westfield Local Heroes
     277
      171                     96,101
                               52,289 m
                                      m22             $538.3
                                                        $341.0m                      2,880
                                                                                      2,640
 NUMBER OF RETAILERS           GROSS LETTABLE AREA   TOTAL ANNUAL
                                                       TOTAL      RETAIL
                                                             ANNUAL      SALES
                                                                     RETAIL         CAR PARKING SPACES
NUMBER OF RETAILERS           GROSS LETTABLE AREA                                  CAR PARKING SPACES
                                                              SALES

       Customer & Demographics                                                                          Ownership & Site
       Annual Visits (million)                                                                     11.0 Centre Owner                                Scentre Group (100%)
       Customer Advocacy - Net Promoter Score                                                        34 Site Area (ha)                                                 8.3
       Average Household Income (TTA)                                                          $117,706 Aquisition Date                                              1986
                                                                                    MTA             TTA Book Value ($million) SCG Share                            $890.0
       Retail Expenditure ($ billion)                                               $3.6           $8.2 Book Value ($million)                                      $890.0
       Population                                                                211,463       465,058  Capitalisation Rate 1                                       5.50%
       Expected Population Growth                                                   1.5%           1.4% Economic Yield  2                                           5.86%
                                                                                                        Centre Opened                                                1978
       Retailer In-store Sales Information                              2017        2018          2019 Centre Redeveloped               1988, 1995, 1996, 1997, 2010/2011
       Total Sales - MAT $m                                             $538       $540           $538
       Total Specialty Sales MAT $m                                     $252       $250           $241 Retailers
       Avg Sales per Specialty Store ($’000)                           $1,212     $1,244         $1,198 Number of Retailers                                           277
       Specialty Sales MAT $psm (
Westfield Bondi Junction is one of Sydney’s iconic retail destinations.

       Bondi Junction, NSW
                                                                                                            Situated in the heart of the Eastern Suburbs, one of the city’s most
                                                                                                            desirable and affluent areas, the centre is only six kilometres from the
                                                                                                            Sydney CBD. Servicing a trade area population of nearly 460,000, the
                                                                                                            centre is one of the strongest performers in the Scentre Group portfolio.
       500 OXFORD STREET, BONDI JUNCTION NSW 2022                                                           The centre is defined by a premium retail and experience offer that caters
                                                                                                            to its discerning and style-conscious customers. International luxury brands
                                                                                                            sit alongside local designers and some of the most coveted high-street
                                                                                                            brands. The retail mix is complemented by a customer service offer
                                                                                                            that includes valet parking, a styling suite, ‘hands-free’ shopping and a
                                                                                                            concierge service.
                                                                                                            Westfield Bondi Junction is home to Australia’s leading retailers, including
                                                                                                            David Jones, Myer, Target, Coles and Woolworths, and over 320
                                                                                                            specialty stores.
                                                                                                            The centre’s Total Trade Area spend was estimated at $8.2 billion in
                                                                                                            2019 while the total retail spend in the Main Trade Area was estimated at
                                                                                                            $4.0 billion.
                                                                                                            Average household income in 2016 in the Total Trade Area was $120,703
                                                                                                            per annum, which is 8% higher than the Sydney Metro average ($112,106),
                                                                                                            with a high retail spend per capita of $17,995 per annum, 21% above the
                                                                                                            Sydney Metro average ($14,873).
                                                                                                            The Total Trade Area includes large pockets of high density living with 63%
                                                                                                            of households being flats, units or apartments. Workers from the trade area
                                                                                                            skew towards managers/professionals and there is also a higher proportion
                                                                                                            of younger residents aged between 25-39 years compared with the
                                                                                                            Sydney Metro average.

                                                                                                                      Link to Trade Area Map

                                                                                                                      Link to Westfield Local Heroes
     469
      171                  131,259m
                            52,289 m2 2             $1,172.2
                                                       $341.0 m                     3,304
                                                                                     2,640
 NUMBEROF
       OF RETAILERS           GROSSLETTABLE
                                   LETTABLE AREA      TOTAL
                                                    TOTAL   ANNUAL
                                                          ANNUAL    RETAIL
                                                                 RETAIL SALES      CARPARKING
                                                                                      PARKING SPACES
NUMBER    RETAILERS          GROSS           AREA                                 CAR         SPACES
                                                             SALES

       Customer & Demographics                                                                        Ownership & Site
       Annual Visits (million)                                                             20.8       Centre Owner                                             Scentre Group (100%)
       Customer Advocacy - Net Promoter Score                                                44       Site Area (ha)                                                             2.8
       Average Household Income (TTA)                                                  $120,703       Aquisition Date                                                          1994
                                                                                   MTA      TTA       Book Value ($million) SCG Share                                      $3,305.9
       Retail Expenditure ($ billion)                                              $4.0    $8.2       Book Value ($million)                                                $3,305.9
       Population                                                               198,662 457,404       Capitalisation Rate 1                                                   4.13%
       Expected Population Growth                                                  0.7%    1.6%       Economic Yield 2                                                        4.40%
                                                                                                      Centre Opened                                                            1970
       Retailer In-store Sales Information                            2017     2018             2019 Centre Redeveloped                                                        2004
       Total Sales - MAT $m                                          $1,094 $1,132             $1,172
       Total Specialty Sales MAT $m                                   $606    $636              $666 Retailers
       Avg Sales per Specialty Store ($’000)                         $2,142 $2,273             $2,380 Number of Retailers                                                          469
       Specialty Sales MAT $psm (
Booragoon, WA
       125 RISELEY STREET, BOORAGOON WA 6154

                                                                                                                                 Westfield Booragoon is located approximately 13 kilometres from the Perth
                                                                                                                                 CBD in the city’s south-western suburbs. The centre caters to a trade area
                                                                                                                                 population of approximately 507,000 residents and is home to some of
                                                                                                                                 Australia’s most recognised brands including David Jones, Myer, Kmart,
                                                                                                                                 Coles and Woolworths. There is also a Hoyts cinemas complex on site and
                                                                                                                                 more than 160 specialty stores including Apple, Zara and JB Hi Fi.
                                                                                                                                 The total retail spend in the Westfield Booragoon Total Trade Area was
                                                                                                                                 estimated at $7.5 billion in 2019 while the total retail spend by the Main
                                                                                                                                 Trade Area was estimated at $2.6 billion.
                                                                                                                                 At $15,853 per annum in 2019, the retail spend per capita in the Main
                                                                                                                                 Trade Area is 7% higher than the Perth metro average ($14,498). Westfield
                                                                                                                                 Boorgoon’s Main Trade Area also has a high average annual household
                                                                                                                                 income of $110,225 per annum in 2016, which is 5% above the Perth Metro
                                                                                                                                 average. In the Main Trade Area, 79% of workers are professional or other
                                                                                                                                 white collar workers, which is above the Perth Metro average of 68%.

                                                                                                                                           Link to Trade Area Map

                                                                                                                                           Link to Westfield Local Heroes
      171              258 52,289 m72,865
                                   2      m2$341.0                                       4,047 2,640
NUMBER OF RETAILERS
                  NUMBER OF RETAILERS
                                  GROSS LETTABLE AREA
                                                    GROSS LETTABLETOTAL
                                                                   AREAANNUAL RETAIL SALES
                                                                                       CAR PARKING SPACES
                                                                                                       CAR PARKING SPACES

       Customer & Demographics                                                                                     Retailers
       Average Household Income (TTA)                                                                   $106,184 Number of Retailers                                                                     258
                                                                                                    MTA       TTA
       Retail Expenditure ($ billion)                                                               $2.6      $7.5 Centre Composition by GLA
       Population                                                                               165,453 507,210                                                                         GLA                 %
       Expected Population Growth                                                                  0.3%      1.0% Myer                                                               16,404            22.5%
                                                                                                                   David Jones                                                        8,182            11.2%
                                                                                                                   Kmart                                                              6,873              9.4%
       Ownership & Site
                                                                                                                   Cinemas                                                            4,579              6.3%
       Centre Owner                                                                            Scentre Group (50%)
                                                                                                                   Coles                                                              4,126              5.7%
                                                                                                        AMP (50%)
                                                                                                                   Woolworths                                                         3,400              4.7%
       Site Area (ha)                                                                                         18.6
                                                                                                                   Majors Total                                                      43,564            59.8%
       Aquisition Date                                                                                       2019
                                                                                                                   Specialties                                                        28,187           38.7%
       Book Value ($million) SCG Share                                                                     $570.0
                                                                                                                   Offices                                                              1,114            1.5%
       Book Value ($million)                                                                              $1,140.0
                                                                                                                   Total                                                             72,865             100%
       Capitalisation Rate 1                                                                                4.75%
       Economic Yield 2                                                                                     5.31%
       Centre Opened                                                                                         1972
       Centre Redeveloped                                                                        1983, 1995, 2000

      Refer to Glossary for detailed category descriptions.                                                                 1.    Capitalisation Rate as per the independent valuation
                                                                                                                            2.    Refer footnote 1 on Page 6
                                                                                                                            3.    Refer footnote 8 on Page 6
       PAGE 12- / SCENTRE GROUP PROPERTY COMPENDIUM 2019                                                                                                                                        Link To Disclaimer
Burwood, NSW
       100 BURWOOD ROAD, BURWOOD NSW 2134

                                                                                                            Westfield Burwood is centrally located within Sydney’s Inner West,
                                                                                                            approximately 12 kilometres from the CBD. Strategically positioned within
                                                                                                            easy reach of Burwood Railway Station on the bustling commercial strip,
                                                                                                            the centre caters to a trade area population in excess of 470,000 residents.
                                                                                                            Westfield Burwood is home to some of Australia’s most well-known
                                                                                                            retailers, including David Jones, Kmart, Target, Coles and Woolworths. The
                                                                                                            centre also boasts an Event Cinemas complex as well as approximately 230
                                                                                                            specialty stores.
                                                                                                            The Total Trade Area retail spend is estimated at $6.9 billion while the Main
                                                                                                            Trade Area spend is estimated to be $3.7 billion.
                                                                                                            Westfield Burwood’s spend per capita for the Main Trade Area is estimated
                                                                                                            at $14,982 which is broadly in line with the Sydney Metro average ($14,873).
                                                                                                            The centre’s catchment area has a diverse population with 49% of the Main
                                                                                                            Trade Area born outside Australia, and 36% born in Asia. A high proportion
                                                                                                            of workers are professionals or other white collar workers, and there are
                                                                                                            pockets of high density living with nearly 49% of homes being flats, units or
                                                                                                            apartments.

                                                                                                                      Link to Trade Area Map

                                                                                                                      Link to Westfield Local Heroes
     236
      171                  63,204
                            52,289 m
                                   m22               $494.1
                                                      $341.0m                        3,014
                                                                                     2,640
                                                      TOTAL ANNUAL RETAIL
NUMBER
 NUMBEROF
       OF RETAILERS
          RETAILERS          GROSS
                              GROSSLETTABLE
                                   LETTABLE AREA
                                             AREA   TOTAL ANNUAL RETAIL SALES     CAR
                                                                                   CARPARKING
                                                                                      PARKING SPACES
                                                                                              SPACES
                                                             SALES

       Customer & Demographics                                                                         Ownership & Site
       Annual Visits (million)                                                             14.4        Centre Owner                                                 Scentre Group (50%)
       Customer Advocacy - Net Promoter Score                                                31                                                                            Perron (50%)
       Average Household Income (TTA)                                                  $104,904       Site Area (ha)                                                                3.2
                                                                                   MTA      TTA       Aquisition Date                                                             1992
       Retail Expenditure ($ billion)                                              $3.7    $6.9       Book Value ($million) SCG Share                                           $575.1
       Population                                                               249,101 472,224       Book Value ($million)                                                    $1,150.2
       Expected Population Growth                                                  1.9%    2.0%       Capitalisation Rate 1                                                      4.75%
                                                                                                      Economic Yield 2                                                           5.40%
       Retailer In-store Sales Information                            2017     2018             2019 Centre Opened                                                                1966
       Total Sales - MAT $m                                           $475    $480              $494 Centre Redeveloped                                               1972, 1976, 2000
       Total Specialty Sales MAT $m                                   $234    $241              $245
       Avg Sales per Specialty Store ($’000)                         $1,182 $1,204             $1,214 Retailers
       Specialty Sales MAT $psm (
Westfield Carindale is situated in an affluent quarter of Brisbane’s
                                                                                                            south‑eastern suburbs approximately 12 kilometres from the CBD. The centre
                                                                                                            services a trade area population of approximately 690,000 with the nearby

       Carindale, QLD
                                                                                                            Gateway Motorway offering convenient access to the centre.
                                                                                                            One of the city’s leading retail and lifestyle destinations, Westfield Carindale
                                                                                                            is home to many of Australia’s most well-known retailers including David
                                                                                                            Jones, Myer, Kmart, Big W, Target, Coles, Woolworths, ALDI and Apple,
       1151 CREEK ROAD, CARINDALE QLD 4152                                                                  as well as a host of premium fashion brands. An Event Cinemas complex
                                                                                                            and a range of other retailers including approximately 400 specialty stores
                                                                                                            complete the retail offer while the adjoining Carindale Home & Leisure
                                                                                                            Centre offers bulky goods retail.
                                                                                                            During 2019, David Jones consolidated from two levels to one to introduce
                                                                                                            the latest format store. This provided an opportunity to introduce Kmart
                                                                                                            on the second level, a brand that is much-loved and sought-after by our
                                                                                                            customers.
                                                                                                            The total retail spend by the Westfield Carindale Total Trade Area in 2019 was
                                                                                                            estimated at $9.7 billion while the total retail spend by the Main Trade Area
                                                                                                            was estimated at $4.1 billion.
                                                                                                            The centre’s total annual retail spend per capita in the Total Trade Area is
                                                                                                            estimated at $14,104, 4% above the Brisbane Metro average ($13,603), while
                                                                                                            the total annual retail spend per capita for the Main Trade Area is estimated
                                                                                                            to be $14,583, which is 7% above the Brisbane Metro average ($13,603).
                                                                                                            Westfield Carindale’s Main Trade Area had a high average household
                                                                                                            income in 2016 of $110,814 per annum which is 11% above the Brisbane Metro
                                                                                                            average ($100,034). Household composition is in line with the Brisbane Metro
                                                                                                            average with 29% being families with children under 15 years of age.
                                                                                                            In the Main Trade Area, 78% of workers are professional or other white collar
                                                                                                            workers, which is above the Brisbane Metro average of 70%.

                                                                                                                      Link to Trade Area Map

                                                                                                                      Link to Westfield Local Heroes
     404
      171                  136,209m
                             52,289 m2 2             $894.8
                                                       $341.0m                      5,897
                                                                                     2,640
                                                      TOTAL ANNUAL RETAIL
NUMBER
 NUMBEROF
       OF RETAILERS
          RETAILERS          GROSS
                              GROSSLETTABLE
                                   LETTABLE AREA
                                             AREA   TOTAL ANNUAL RETAIL SALES     CAR
                                                                                   CARPARKING
                                                                                      PARKING SPACES
                                                                                              SPACES
                                                             SALES

       Customer & Demographics                                                                         Ownership & Site
       Annual Visits (million)                                                             14.0        Centre Owner                                   Carindale Property Trust (50%)
       Customer Advocacy - Net Promoter Score                                                41                                                                         APPF (50%)
       Average Household Income (TTA)                                                  $103,063       Site Area (ha)                                                            15.8
                                                                                   MTA      TTA       Aquisition Date                                                          1999
       Retail Expenditure ($ billion)                                              $4.1    $9.7       Book Value ($million) SCG Share                                       $840.1
       Population                                                               282,348 689,336       Book Value ($million)                                                $1,680.2
       Expected Population Growth                                                  1.1%    1.3%       Capitalisation Rate 1                                                  4.75%
                                                                                                      Economic Yield 2                                                       5.41%
       Retailer In-store Sales Information                            2017     2018             2019 Centre Opened                                                             1979
       Total Sales - MAT $m                                           $896    $896              $895 Centre Redeveloped                                                        2012
       Total Specialty Sales MAT $m                                   $512    $505              $512
       Avg Sales per Specialty Store ($’000)                         $1,651 $1,660             $1,700 Retailers
       Specialty Sales MAT $psm (
Carousel, WA
                                                                                                            Westfield Carousel is located on the Albany Highway in Perth’s south-
       1382 ALBANY HWY, CANNINGTON WA 6107                                                                  east, just 12 kilometres from the CBD. It caters to nearly one third of the
                                                                                                            city’s population with the Total Trade Area population exceeding 645,000.
                                                                                                            The centre also benefits from its close proximity to two of Perth’s major
                                                                                                            university campuses, Curtin University’s Bentley Campus and the South
                                                                                                            Street Campus of Murdoch University.
                                                                                                            A $350 million redevelopment, completed in 2018, delivered a new David
                                                                                                            Jones department store as well as 70 new specialty stores, including 20
                                                                                                            restaurants and 50 fashion retailers. Westfield Carousel now comprises 350
                                                                                                            retailers across fashion, food, lifestyle, dining and entertainment.
                                                                                                            The open-air rooftop dining and entertainment precinct features a fully
                                                                                                            refurbished HOYTS, including a 14-screen complex and an upgraded LUX
                                                                                                            Lounge featuring a menu designed by celebrity chef, Manu Feildel. A new
                                                                                                            iPlay, a dedicated kid’s play area and outdoor amphitheatre on the rooftop
                                                                                                            provides casual entertainment for customers, day and night.
                                                                                                            As part of the redevelopment, Westfield Carousel introduced a range of
                                                                                                            new services including WA’s first shopping centre valet service, dedicated
                                                                                                            Uber pick up and drop off zones and Park+.
                                                                                                            In 2019 the total retail spend by the Westfield Carousel Total Trade Area
                                                                                                            was estimated at $9.2 billion, with the total retail spend per capita for the
                                                                                                            Total Trade Area estimated at $14,196, broadly in line with the Perth Metro
                                                                                                            average ($14,498).

                                                                                                                      Link to Trade Area Map

                                                                                                                      Link to Westfield Local Heroes
     362
      171                  109,795
                             52,289 mm2 2            $660.3
                                                       $341.0m                      4,300
                                                                                     2,640
                                                      TOTAL ANNUAL RETAIL
NUMBER
 NUMBEROF
       OF RETAILERS
          RETAILERS          GROSS
                              GROSSLETTABLE
                                   LETTABLE AREA
                                             AREA   TOTAL ANNUAL RETAIL SALES     CAR
                                                                                   CARPARKING
                                                                                      PARKING SPACES
                                                                                              SPACES
                                                             SALES

       Customer & Demographics                                                                        Ownership & Site
       Annual Visits (million)                                                                  13.8  Centre Owner                                             Scentre Group (100%)
       Customer Advocacy - Net Promoter Score                                                     42  Site Area (ha)                                                            21.6
       Average Household Income (TTA)                                                        $98,502  Aquisition Date                                                          1996
                                                                                   MTA           TTA  Book Value ($million) SCG Share                                      $1,450.0
       Retail Expenditure ($ billion)                                              $4.4         $9.2  Book Value ($million)                                                $1,450.0
       Population                                                               315,086      647,183  Capitalisation Rate 1                                                   5.00%
       Expected Population Growth                                                  1.2%         1.8%  Economic Yield 2                                                        5.24%
                                                                                                      Centre Opened                                                            1972
       Retailer In-store Sales Information                            2017     2018             2019 Centre Redeveloped                                                 1999, 2018
       Total Sales - MAT $m                                           $502    $536              $660
       Total Specialty Sales MAT $m                                   $260    $288              $376 Retailers
       Avg Sales per Specialty Store ($’000)                         $1,296 $1,084             $1,377 Number of Retailers                                                          362
       Specialty Sales MAT $psm (
Chatswood, NSW                                                                                       Westfield Chatswood is located on Sydney’s affluent North Shore,
                                                                                                            approximately 11 kilometres from the CBD. Conveniently situated within
                                                                                                            easy reach of Chatswood train station, a major bus interchange and
       1 ANDERSON STREET, CHATSWOOD NSW 2067                                                                the Pacific Highway, the centre caters to a trade area population of
                                                                                                            approximately 480,000 in addition to a sizeable local workforce.
                                                                                                            Westfield Chatswood is home to some of Australia’s leading retailers
                                                                                                            including Myer, Target, Coles, Hoyts and ALDI as well as approximately
                                                                                                            250 specialty stores including Zara, H&M and Uniqlo.
                                                                                                            The total annual retail spend per capita for the Westfield Chatswood Total
                                                                                                            Trade Area is estimated at $18,331, which is 23% above the Sydney Metro
                                                                                                            average ($14,873) and the highest in the Scentre Group portfolio. The total
                                                                                                            annual retail spend per capita for the Westfield Chatswood Main Trade Area
                                                                                                            is estimated at $18,368 which is also 23% above the Sydney Metro average
                                                                                                            ($14,873).
                                                                                                            The total retail spend by the Westfield Chatswood Total Trade Area in 2019
                                                                                                            was estimated at $8.8 billion and the total retail spend by the Main Trade
                                                                                                            Area was estimated at $4.1 billion.
                                                                                                            Average household income of the Main Trade Area in 2016 was $137,230
                                                                                                            per annum which is 22% above the Sydney Metro average ($112,106), while
                                                                                                            40% of households had incomes over $156,000 per annum.
                                                                                                            90% of the trade area’s workers are managers, professionals or other
                                                                                                            white-collar workers, which is well above the Sydney Metro average of 75%.
                                                                                                            The centre has a culturally diverse market with 40% of the Main Trade Area
                                                                                                            population being born outside of Australia including 24% in Asia.

                                                                                                                      Link to Trade Area Map

                                                                                                                      Link to Westfield Local Heroes
     257
      171                    81,093
                              52,289 m
                                     m22             $563.7
                                                       $341.0m                       2,831
                                                                                     2,640
                                                      TOTAL ANNUAL RETAIL
NUMBER
 NUMBEROF
       OF RETAILERS
          RETAILERS          GROSS
                              GROSSLETTABLE
                                   LETTABLE AREA
                                             AREA   TOTAL ANNUAL RETAIL SALES     CAR
                                                                                   CARPARKING
                                                                                      PARKING SPACES
                                                                                              SPACES
                                                             SALES

       Customer & Demographics                                                                        Ownership & Site
       Annual Visits (million)                                                             18.3       Centre Owner                                             Scentre Group (100%)
       Customer Advocacy - Net Promoter Score                                                35       Site Area (ha)                                                             2.3
       Average Household Income (TTA)                                                  $133,815       Aquisition Date                                                          1993
                                                                                   MTA      TTA       Book Value ($million) SCG Share                                      $1,407.4
       Retail Expenditure ($ billion)                                              $4.1    $8.8       Book Value ($million)                                                $1,407.4
       Population                                                               223,944 480,614       Capitalisation Rate 1                                                   4.50%
       Expected Population Growth                                                  1.6%    1.4%       Economic Yield 2                                                        4.81%
                                                                                                      Centre Opened                                                            1987
       Retailer In-store Sales Information                            2017     2018             2019 Centre Redeveloped                                           1994, 1999, 2015
       Total Sales - MAT $m                                           $592    $579              $564
       Total Specialty Sales MAT $m                                   $358    $352              $358 Retailers
       Avg Sales per Specialty Store ($’000)                         $1,571 $1,614             $1,627 Number of Retailers                                                         257
       Specialty Sales MAT $psm (
Chermside, QLD                                                                                           Westfield Chermside, located approximately 10 kilometres north of the
                                                                                                                Brisbane CBD, is one of the strongest performing assets within Scentre
                                                                                                                Group’s portfolio. The centre caters to a sizeable trade area population
                                                                                                                of more than 825,000, a figure that represents approximately 33% of
       GYMPIE & HAMILTON ROAD, CHERMSIDE QLD 4032                                                               Brisbane’s population.
                                                                                                                Westfield Chermside is home to some of Australia’s most well-known
                                                                                                                retailers including David Jones, Myer, Big W, Kmart, Target, Coles,
                                                                                                                Woolworths and Apple. The centre also boasts an Event Cinemas complex
                                                                                                                and approximately 470 specialty stores.
                                                                                                                A $355 million redevelopment, completed in 2017 added approximately 95
                                                                                                                new stores to the retail mix, including Brisbane’s first Sephora, H&M, Zara,
                                                                                                                Uniqlo and a host of other local and international brands. A new leisure
                                                                                                                and dining precinct set in a resort-style landscape features a selection of
                                                                                                                boutique cafes and al fresco restaurants and has quickly become one of
                                                                                                                the city’s most attractive dining destinations.
                                                                                                                In 2019, the total retail spend in the Westfield Chermside Total Trade Area
                                                                                                                was estimated at $11.8 billion while the total retail spend in the Main Trade
                                                                                                                Area was estimated at $4.7 billion. The total annual retail spend per capita
                                                                                                                is estimated at $14,366 for the Main Trade Area, which is 6% above the
                                                                                                                Brisbane Metro average ($13,603).
                                                                                                                Westfield Chermside’s Main Trade Area average household income in 2016
                                                                                                                was $104,397 per annum, which is 4% above the Brisbane Metro average
                                                                                                                ($100,034), with 21% of households earning more than $156,000. The area
                                                                                                                also has a high proportion of workers who are managers or other white-
                                                                                                                collar workers (76%) compared to the Brisbane Metro average of 70%.

                                                                                                                          Link to Trade Area Map

                                                                                                                          Link to Westfield Local Heroes
     489
      171                  177,376
                            52,289 mm2 2            $1,055.4
                                                       $341.0 m                         7,200
                                                                                         2,640
                                                      TOTAL ANNUAL RETAIL
NUMBER
 NUMBEROF
       OF RETAILERS
          RETAILERS          GROSS
                              GROSSLETTABLE
                                   LETTABLE AREA
                                             AREA   TOTAL ANNUAL RETAIL SALES         CAR
                                                                                       CARPARKING
                                                                                          PARKING SPACES
                                                                                                  SPACES
                                                             SALES

       Customer & Demographics                                                                            Ownership & Site
       Annual Visits (million)                                                                 17.7       Centre Owner                                            Scentre Group (100%)
       Customer Advocacy - Net Promoter Score                                                    48       Site Area (ha)                                                           22.1
       Average Household Income (TTA)                                                      $100,895       Aquisition Date                                                         1996
                                                                                       MTA      TTA       Book Value ($million) SCG Share                                     $2,838.5
       Retail Expenditure ($ billion)                                                  $4.7   $11.8       Book Value ($million)                                               $2,838.5
       Population                                                                   325,443 827,182       Capitalisation Rate 1                                                  4.13%
       Expected Population Growth                                                      1.1%    1.6%       Economic Yield 2                                                       4.40%
                                                                                                          Centre Opened                                                           1957
       Retailer In-store Sales Information                            2017     2018                 2019 Centre Redeveloped                                     1998, 2000, 2006, 2017
       Total Sales - MAT $m                                           $930 $1,025                  $1,055
       Total Specialty Sales MAT $m                                   $582    $655                  $672 Retailers
       Avg Sales per Specialty Store ($’000)                         $1,613 $1,760                 $1,827 Number of Retailers                                                          489
       Specialty Sales MAT $psm (
Westfield Coomera was Scentre Group’s first greenfield development.
                                                                                                                 Completed in 2018, the $470 million development delivered an unrivalled
                                                                                                                 experience in retail, dining, lifestyle and entertainment to the fast-growing
                                                                                                                 corridor on the Gold Coast in South-East Queensland.

       Coomera, QLD                                                                                              Spanning 59,000 square metres (sqm) of indoor-outdoor retail and leisure
                                                                                                                 space, Westfield Coomera offers 140 specialty stores, a two-level dining
                                                                                                                 and entertainment precinct, market-style fresh food, quick eateries and a
       FOXWELL ROAD, COOMERA QLD 4209                                                                            never-seen-before purpose-built and expertly curated outdoor space for
                                                                                                                 children and families, The Backyard.
                                                                                                                 Westfield Coomera is home to iPlay Adventure featuring activities such
                                                                                                                 as Clip N Climb, a high-ropes course and laser-tag. Also from the creators
                                                                                                                 of iPlay, The Park Coomera features a ‘putt-putt meets beer garden’ style
                                                                                                                 venue with a bar and pizzeria, full lane bowling, live music and more.
                                                                                                                 Complementing Westfield Coomera’s extensive dining, entertainment and
                                                                                                                 leisure credentials, the new Living Centre features Coles, Woolworths,
                                                                                                                 Kmart, Target, JB Hi-Fi, Rebel and Event Cinemas, including Gold Class.
                                                                                                                 Catering to all ages, the centre includes a carefully curated fashion mix and
                                                                                                                 more than 150 specialty retailers.
                                                                                                                 The centre is conveniently located just 500 metres off the Pacific Motorway
                                                                                                                 (M1) and next to the Coomera train station.
                                                                                                                 The centre services a Total Trade Area population of approximately 177,000
                                                                                                                 people.
                                                                                                                 The total retail spend by the Westfield Coomera Total Trade Area in 2019
                                                                                                                 was estimated at $2.3 billion while the total retail spend by the Main Trade
                                                                                                                 Area was estimated at $1.9 billion.
                                                                                                                 The average household income in the Total Trade Area in 2016 was
                                                                                                                 $99,244 per annum which was broadly in line with the Brisbane Metro
                                                                                                                 average ($100,034).

                                                                                                                           Link to Trade Area Map

                                                                                                                           Link to Westfield Local Heroes
     160
      171                    58,237
                              52,289 m
                                     m22             $233.7
                                                       $341.0m                          2,433
                                                                                         2,640
                                                      TOTAL ANNUAL RETAIL
NUMBER
 NUMBEROF
       OF RETAILERS
          RETAILERS          GROSS
                              GROSSLETTABLE
                                   LETTABLE AREA
                                             AREA   TOTAL ANNUAL RETAIL SALES         CAR
                                                                                       CARPARKING
                                                                                          PARKING SPACES
                                                                                                  SPACES
                                                             SALES

       Customer & Demographics                                                                              Ownership & Site
       Annual Visits (million)                                                                        6.7   Centre Owner                                                 Scentre Group (50%)
       Customer Advocacy - Net Promoter Score                                                         47                                                                           QIC (50%)
       Average Household Income (TTA)                                                            $99,244   Site Area (ha)                                                               14.6
                                                                                       MTA           TTA   Aquisition Date                                                             2018
       Retail Expenditure ($ billion)                                                  $1.9         $2.3   Book Value ($million) SCG Share                                           $210.5
       Population                                                                   142,381      176,642   Book Value ($million)                                                     $421.0
       Expected Population Growth                                                      5.0%         4.5%   Capitalisation Rate 1                                                      5.50%
                                                                                                           Economic Yield 2                                                           6.30%
       Retailer In-store Sales Information                                2017         2018          2019 Centre Opened                                                                2018
       Total Sales - MAT $m                                                 na           na          $234 Centre Redeveloped                                                           2018
       Total Specialty Sales MAT $m                                         na           na          $122
       Avg Sales per Specialty Store ($’000)                                na           na         $1,005 Retailers
       Specialty Sales MAT $psm (
Doncaster, VIC                                                                                       Westfield Doncaster is a world class Living Centre situated 17 kilometres
                                                                                                            from the Melbourne CBD and catering to a trade area population of nearly
                                                                                                            765,000 residents.
       DONCASTER ROAD, DONCASTER VIC 3108
                                                                                                            One of Melbourne’s largest shopping centres, Doncaster is home to many
                                                                                                            of Australia’s leading brands including David Jones, Myer, Target, Big W,
                                                                                                            Coles, Woolworths, Apple and Zara. The centre boasts one of the best
                                                                                                            fashion offers in the city with approximately 430 specialty stores, and
                                                                                                            complemented by valet parking, electric car charging and styling services.
                                                                                                            A $30 million redevelopment of Westfield Doncaster’s level two dining and
                                                                                                            entertainment precinct is currently underway and due to be completed in
                                                                                                            2020. Currently home to six restaurants, the space will transform into a
                                                                                                            modern-village style rooftop dining and entertainment precinct complete
                                                                                                            with up to 14 restaurants. Complementing the existing Village Cinemas,
                                                                                                            the new indoor/outdoor precinct will open both day and night and is set to
                                                                                                            become a convenient social destination for Melbourne’s East.
                                                                                                            The total retail spend in Westfield Doncaster’s Total Trade Area in 2019 was
                                                                                                            estimated at $12.1 billion while the total retail spend in the Main Trade Area
                                                                                                            is estimated at $5.9 billion. The total annual retail spend per capita for the
                                                                                                            Westfield Doncaster Total Trade Area is estimated at $15,883 which is 7%
                                                                                                            above the Melbourne metro average ($14,821).
                                                                                                            There are high levels of home ownership in the area with 76% of
                                                                                                            households in the Main Trade Area owning their home or paying a
                                                                                                            mortgage, and also a high proportion (81%) of all workers in the area are
                                                                                                            managers, professionals or other white-collar workers.

                                                                                                                      Link to Trade Area Map

                                                                                                                      Link to Westfield Local Heroes
     432
      171                  122,667
                             52,289 mm2 2            $945.2
                                                       $341.0m                      4,806
                                                                                     2,640
                                                      TOTAL ANNUAL RETAIL
NUMBER
 NUMBEROF
       OF RETAILERS
          RETAILERS          GROSS
                              GROSSLETTABLE
                                   LETTABLE AREA
                                             AREA   TOTAL ANNUAL RETAIL SALES     CAR
                                                                                   CARPARKING
                                                                                      PARKING SPACES
                                                                                              SPACES
                                                             SALES

       Customer & Demographics                                                                         Ownership & Site
       Annual Visits (million)                                                             15.5        Centre Owner                                          Scentre Group (50%)
       Customer Advocacy - Net Promoter Score                                                37                                                      M&G Asia Property Fund (25%)
       Average Household Income (TTA)                                                  $105,678                                                                        ISPT (25%)
                                                                                   MTA      TTA       Site Area (ha)                                                         14.3
       Retail Expenditure ($ billion)                                              $5.9   $12.1       Aquisition Date                                                       1993
       Population                                                               369,116 764,376       Book Value ($million) SCG Share                                    $1,266.0
       Expected Population Growth                                                  1.1%    1.0%       Book Value ($million)                                              $2,532.0
                                                                                                      Capitalisation Rate 1                                                4.25%
       Retailer In-store Sales Information                            2017     2018             2019 Economic Yield 2                                                      4.82%
       Total Sales - MAT $m                                           $937    $935              $945 Centre Opened                                                          1969
       Total Specialty Sales MAT $m                                   $604    $608              $622 Centre Redeveloped                                  1979, 1995, 2007/2008
       Avg Sales per Specialty Store ($’000)                         $1,809 $1,816             $1,880
       Specialty Sales MAT $psm (
Eastgardens, NSW
       152 BUNNERONG ROAD, EASTGARDENS NSW 2036

                                                                                                            Westfield Eastgardens is located approximately 10 kilometres from the
                                                                                                            Sydney CBD in the city’s south-eastern suburbs. Scentre Group manages
                                                                                                            the centre and in 2018, acquired a 50% interest in Westfield Eastgardens,
                                                                                                            with the remaining half owned by Terrace Tower Group.
                                                                                                            Westfield Eastgardens is one of the top 30 shopping centres in Australia,
                                                                                                            catering to a trade area population of approximately 310,000 residents.
                                                                                                            Westfield Eastgardens is home to some of Australia’s most trusted retailers
                                                                                                            including Myer, Big W, Kmart, Target, Coles, Woolworths, and ALDI. There
                                                                                                            is also a Hoyts cinema on site as well as a broad mix of retailers including
                                                                                                            approximately 280 specialty stores.
                                                                                                            The total retail spend by the Westfield Eastgardens Total Trade Area in
                                                                                                            2019 was estimated at $5.0 billion while the total retail spend by the Main
                                                                                                            Trade Area was estimated at $2.4 billion.
                                                                                                            The total annual per capita retail spend for the Westfield Eastgardens Main
                                                                                                            Trade Area is estimated at $14,849, which is broadly in line with the Sydney
                                                                                                            Metro average ($14,873).
                                                                                                            The centre serves a culturally diverse community with 41% of the Main
                                                                                                            Trade Area population born in a country outside Australia including 22%
                                                                                                            born in Asia.

                                                                                                                      Link to Trade Area Map

                                                                                                                      Link to Westfield Local Heroes
     279
      171                  82,687
                            52,289 m
                                   m22               $608.2
                                                       $341.0 m                      3,148
                                                                                     2,640
                                                      TOTAL ANNUAL RETAIL
NUMBER
 NUMBEROF
       OF RETAILERS
          RETAILERS          GROSS
                              GROSSLETTABLE
                                   LETTABLE AREA
                                             AREA   TOTAL ANNUAL RETAIL SALES     CAR
                                                                                   CARPARKING
                                                                                      PARKING SPACES
                                                                                              SPACES
                                                             SALES

       Customer & Demographics                                                                         Ownership & Site
       Annual Visits (million)                                                             11.7        Centre Owner                                             Scentre Group (50%)
       Customer Advocacy - Net Promoter Score                                                35                                                           Terrace Tower Group (50%)
       Average Household Income (TTA)                                                  $109,202        Site Area (ha)                                                           9.3
                                                                                   MTA      TTA        Aquisition Date                                                        2018
       Retail Expenditure ($ billion)                                              $2.4    $5.0        Book Value ($million) SCG Share                                      $720.0
       Population                                                               162,389 309,377        Book Value ($million)                                               $1,440.0
       Expected Population Growth                                                  2.0%    2.3%        Capitalisation Rate 1                                                 4.25%
                                                                                                       Economic Yield 2                                                      4.78%
       Retailer In-store Sales Information                             2017        2018          2019 Centre Opened                                                           1987
       Total Sales - MAT $m                                            $600       $595           $608 Centre Redeveloped                                                2002, 2013
       Total Specialty Sales MAT $m                                    $254       $251           $247
       Avg Sales per Specialty Store ($’000)                          $1,192     $1,196         $1,230 Retailers
       Specialty Sales MAT $psm (
Fountain Gate, VIC                                                                                   Westfield Fountain Gate is located in one of Victoria’s fastest growing
                                                                                                            municipalities, approximately 45 kilometres south-east of the Melbourne
       352 PRINCES HIGHWAY, FOUNTAIN GATE VIC 3805                                                          CBD. The centre caters to a trade area population of approximately
                                                                                                            570,000 residents and is one of the largest shopping centres in Australia.
                                                                                                            Westfield Fountain Gate is home to some of Australia’s leading brands
                                                                                                            including Myer, Big W, Kmart, Target, Coles, Woolworths, ALDI and Apple.
                                                                                                            There is also a Village Roadshow cinema and a diverse mix of retailers
                                                                                                            including approximately 440 specialty stores.
                                                                                                            Fountain Gate is one of the few shopping centres in Australia to
                                                                                                            consistently record annual sales of more than $1 billion, with $1.05 billion
                                                                                                            first achieved in 2018.
                                                                                                            The total retail spend by the Westfield Fountain Gate Total Trade Area is
                                                                                                            estimated at $7.6 billion with the total retail spend by the Main Trade Area is
                                                                                                            estimated at $5.2 billion.
                                                                                                            There is a high level of home ownership in the local community with 78%
                                                                                                            of residents in the Main Trade Area owning their own homes or paying
                                                                                                            a mortgage, a figure well above the Melbourne Metro average of 69%.
                                                                                                            There is also a high proportion of family households: 38% of households
                                                                                                            are families with children under the age of 15 compared to the Melbourne
                                                                                                            average of 28%.
                                                                                                            The centre serves a diverse community, with 62% of Total Trade Area
                                                                                                            residents employed as managers, professionals or other white-collar
                                                                                                            occupations while 38% of residents work in blue collar roles.

                                                                                                                      Link to Trade Area Map

                                                                                                                      Link to Westfield Local Heroes
     448
      171                  178,125
                            52,289 m
                                   m22              $1,071.4
                                                       $341.0 m                     6,493
                                                                                     2,640
                                                      TOTAL ANNUAL RETAIL
NUMBER
 NUMBEROF
       OF RETAILERS
          RETAILERS          GROSS
                              GROSSLETTABLE
                                   LETTABLE AREA
                                             AREA   TOTAL ANNUAL RETAIL SALES     CAR
                                                                                   CARPARKING
                                                                                      PARKING SPACES
                                                                                              SPACES
                                                             SALES

       Customer & Demographics                                                                        Ownership & Site
       Annual Visits (million)                                                                  15.2  Centre Owner                                             Scentre Group (100%)
       Customer Advocacy - Net Promoter Score                                                     31  Site Area (ha)                                                            46.1
       Average Household Income (TTA)                                                        $87,613  Aquisition Date                                                          1995
                                                                                   MTA           TTA  Book Value ($million) SCG Share                                      $2,285.0
       Retail Expenditure ($ billion)                                              $5.2         $7.6  Book Value ($million)                                                $2,285.0
       Population                                                               387,721      570,807  Capitalisation Rate 1                                                   4.13%
       Expected Population Growth                                                  2.9%         2.8%  Economic Yield 2                                                        4.41%
                                                                                                      Centre Opened                                                            1970
       Retailer In-store Sales Information                            2017     2018             2019 Centre Redeveloped                                           1980, 2001, 2012
       Total Sales - MAT $m                                          $1,036 $1,053             $1,071
       Total Specialty Sales MAT $m                                   $516    $539              $552 Retailers
       Avg Sales per Specialty Store ($’000)                         $1,493 $1,566             $1,619 Number of Retailers                                                          448
       Specialty Sales MAT $psm (
Garden City, QLD
       CNR KESSELS & LOGAN RD, UPPER MT GRAVATT QLD 4122

                                                                                                            Westfield Garden City is located in a thriving regional hub 12 kilometres
                                                                                                            south of the Brisbane CBD. Well-served by major arterial roads, the centre
                                                                                                            sits adjacent to a Queensland State Government-owned bus terminal
                                                                                                            servicing Brisbane and the Gold Coast and caters to a sizable trade area
                                                                                                            population of over 630,000 residents.
                                                                                                            Westfield Garden City is home to some of Australia’s most well-known
                                                                                                            brands including David Jones, Myer, Big W, Kmart, Target, Coles,
                                                                                                            Woolworths and ALDI. There is also an Event Cinemas complex on site as
                                                                                                            well a broad mix of retailers including approximately 390 specialty stores.
                                                                                                            The total retail spend by the Westfield Garden City Total Trade Area in 2019
                                                                                                            was estimated at $8.5 billion while the total retail spend by the Main Trade
                                                                                                            Area was estimated at $3.8 billion.
                                                                                                            The total annual retail spend per capita for the Westfield Garden City Total
                                                                                                            Trade Area is estimated at $13,415 per annum in 2019, which is broadly in
                                                                                                            line with the Brisbane Metro average ($13,603).
                                                                                                            The centre’s community is culturally diverse with 39% of the Main Trade
                                                                                                            Area population born in a country outside Australia and 26% born in Asia.

                                                                                                                      Link to Trade Area Map

                                                                                                                      Link to Westfield Local Heroes
     397
      171                  142,390
                             52,289 mm2 2            $814.5
                                                       $341.0m                      6,254
                                                                                     2,640
                                                      TOTAL ANNUAL RETAIL
NUMBER
 NUMBEROF
       OF RETAILERS
          RETAILERS          GROSS
                              GROSSLETTABLE
                                   LETTABLE AREA
                                             AREA   TOTAL ANNUAL RETAIL SALES     CAR
                                                                                   CARPARKING
                                                                                      PARKING SPACES
                                                                                              SPACES
                                                             SALES

       Customer & Demographics                                                                        Ownership & Site
       Annual Visits (million)                                                                  18.1  Centre Owner                                            Scentre Group (100%)
       Customer Advocacy - Net Promoter Score                                                     43  Site Area (ha)                                                           24.4
       Average Household Income (TTA)                                                        $97,036  Aquisition Date                                                         2003
                                                                                   MTA           TTA  Book Value ($million) SCG Share                                     $1,740.0
       Retail Expenditure ($ billion)                                              $3.8         $8.5  Book Value ($million)                                               $1,740.0
       Population                                                               285,375      630,273  Capitalisation Rate 1                                                  4.75%
       Expected Population Growth                                                  0.9%         1.2%  Economic Yield 2                                                       5.08%
                                                                                                      Centre Opened                                                           1971
       Retailer In-store Sales Information                            2017     2018             2019 Centre Redeveloped                                     1980, 2000, 2004, 2014
       Total Sales - MAT $m                                           $791    $798              $815
       Total Specialty Sales MAT $m                                   $450    $455              $454 Retailers
       Avg Sales per Specialty Store ($’000)                         $1,388 $1,394             $1,437 Number of Retailers                                                         397
       Specialty Sales MAT $psm (
Geelong, VIC
       95 MALOP STREET, GEELONG VIC 3220

                                                                                                             Westfield Geelong is located in the heart of Victoria’s second largest city.
                                                                                                             Servicing the Surf Coast and the Bellarine Peninsula and a trade area
                                                                                                             population of approximately 303,000 residents, it is the region’s premier
                                                                                                             Living Centre.
                                                                                                             The centre is home to some of Australia’s best-known retailers including
                                                                                                             Myer, Big W, Target and Coles as well as approximately 170 specialty stores.
                                                                                                             The total retail spend by the Westfield Geelong Total Trade Area in 2019
                                                                                                             was estimated at $4.5 billion while the total retail spend by the Main Trade
                                                                                                             Area was estimated at $2.9 billion.
                                                                                                             The total annual retail spend per capita for the Westfield Geelong Total
                                                                                                             Trade Area is estimated to be $14,757 which is broadly in line with the
                                                                                                             Melbourne metro average ($14,821).
                                                                                                             High rates of home ownership are found in the Main Trade Area with 70%
                                                                                                             of residents owning their homes or paying a mortgage. A quarter (25%) of
                                                                                                             households are families with children under 15 years of age, broadly in line
                                                                                                             with the Melbourne Metro average.
                                                                                                             The centre serves a diverse community, with 68% of residents employed
                                                                                                             in managerial, professional or other white-collar roles and 32% occupying
                                                                                                             blue collar posts.

                                                                                                                       Link to Trade Area Map

                                                                                                                       Link to Westfield Local Heroes
      171
      171                    51,552
                              52,289 m
                                     m22             $279.6
                                                       $341.0m                       1,714
                                                                                     2,640
                                                      TOTAL ANNUAL RETAIL
NUMBER
 NUMBEROF
       OF RETAILERS
          RETAILERS          GROSS
                              GROSSLETTABLE
                                   LETTABLE AREA
                                             AREA   TOTAL ANNUAL RETAIL SALES     CAR
                                                                                   CARPARKING
                                                                                      PARKING SPACES
                                                                                              SPACES
                                                             SALES

       Customer & Demographics                                                                          Ownership & Site
       Annual Visits (million)                                                                    8.6   Centre Owner                                                 Scentre Group (50%)
       Customer Advocacy - Net Promoter Score                                                     30                                                                        Perron (50%)
       Average Household Income (TTA)                                                        $82,417   Site Area (ha)                                                                3.2
                                                                                   MTA           TTA   Aquisition Date                                                             2003
       Retail Expenditure ($ billion)                                              $2.9         $4.5   Book Value ($million) SCG Share                                           $268.5
       Population                                                               203,072      303,316   Book Value ($million)                                                     $537.0
       Expected Population Growth                                                  1.7%         1.9%   Capitalisation Rate 1                                                      5.65%
                                                                                                       Economic Yield 2                                                           6.50%
       Retailer In-store Sales Information                             2017        2018          2019 Centre Opened                                                                1987
       Total Sales - MAT $m                                            $274       $270           $280 Centre Redeveloped                                                           2008
       Total Specialty Sales MAT $m                                    $151       $150           $150
       Avg Sales per Specialty Store ($’000)                          $1,085     $1,108         $1,106 Retailers
       Specialty Sales MAT $psm (
Helensvale, QLD
       1-29 MILLAROO DRIVE, HELENSVALE QLD 4212

                                                                                                             Westfield Helensvale is located in a thriving growth corridor of South-
                                                                                                             East Queensland, 25 kilometres north-west of Surfers Paradise and 62
                                                                                                             kilometres south of Brisbane. Strategically located at the junction of two
                                                                                                             major highways, the centre can be accessed easily by the trade area
                                                                                                             population of 335,000 residents.
                                                                                                             Westfield Helensvale is home to Kmart, Target, Coles, Woolworths and ALDI
                                                                                                             as well as a selection of approximately 180 specialty retail stores.
                                                                                                             The average household income in the Main Trade Area in 2016 was
                                                                                                             $98,230 per annum which was broadly in line with the Brisbane Metro
                                                                                                             average ($100,034).
                                                                                                             Household composition skews towards families, with 38% of households
                                                                                                             comprising families with children under 15 years of age, a figure that is well
                                                                                                             above the Brisbane Metro average of 29%.

                                                                                                                       Link to Trade Area Map

                                                                                                                       Link to Westfield Local Heroes
     186
      171                    44,861
                              52,289 m
                                     m22              $329.1
                                                       $341.0m                      2,096
                                                                                     2,640
                                                      TOTAL ANNUAL RETAIL
NUMBER
 NUMBEROF
       OF RETAILERS
          RETAILERS          GROSS
                              GROSSLETTABLE
                                   LETTABLE AREA
                                             AREA   TOTAL ANNUAL RETAIL SALES     CAR
                                                                                   CARPARKING
                                                                                      PARKING SPACES
                                                                                              SPACES
                                                             SALES

       Customer & Demographics                                                                          Ownership & Site
       Annual Visits (million)                                                                    7.2   Centre Owner                                                 Scentre Group (50%)
       Customer Advocacy - Net Promoter Score                                                     23                                                                           QIC (50%)
       Average Household Income (TTA)                                                        $88,416  Site Area (ha)                                                                30.9
                                                                                   MTA           TTA  Aquisition Date                                                              2005
       Retail Expenditure ($ billion)                                              $2.5         $4.5  Book Value ($million) SCG Share                                            $225.0
       Population                                                               186,591      335,093  Book Value ($million)                                                      $450.0
       Expected Population Growth                                                  3.6%         2.9%  Capitalisation Rate 1                                                       5.75%
                                                                                                      Economic Yield 2                                                            6.56%
       Retailer In-store Sales Information                            2017     2018             2019 Centre Opened                                                                 2005
       Total Sales - MAT $m                                           $376    $365              $329 Centre Redeveloped                                                            2005
       Total Specialty Sales MAT $m                                   $161    $163              $142
       Avg Sales per Specialty Store ($’000)                         $1,166 $1,251             $1,120 Retailers
       Specialty Sales MAT $psm (
Hornsby, NSW                                                                                         Westfield Hornsby is located in the leafy northern suburbs of Sydney, 26
                                                                                                            kilometres from the CBD. The centre is easily accessed by road or public
       236 PACIFIC HIGHWAY, HORNSBY NSW 2077                                                                transport, owing to its proximity to the Pacific Highway and Hornsby
                                                                                                            railway station, and serves a trade area population of approximately
                                                                                                            247,000 residents.
                                                                                                            The centre is home to a range of Australia’s best-known retailers including
                                                                                                            David Jones, Kmart, Target, Coles, Woolworths, ALDI, Dan Murphy’s and
                                                                                                            Apple. There is also an Event Cinemas complex on site as well as more
                                                                                                            than 300 specialty stores.
                                                                                                            The total retail spend by the Westfield Hornsby Total Trade Area in 2019
                                                                                                            was estimated at $4.2 billion while the total retail spend by the Main Trade
                                                                                                            Area was estimated at $2.8 billion. The total annual retail spend per capita
                                                                                                            for the Westfield Hornsby Total Trade Area is estimated at $16,974 which is
                                                                                                            14% above the Sydney Metro average ($14,873).
                                                                                                            Average household incomes in the Total Trade Area in 2016 were $132,263
                                                                                                            per annum, 18% higher than the Sydney Metro average ($112,106). There
                                                                                                            is also a high proportion of households with incomes over $156,000 per
                                                                                                            annum–37% compared to the Sydney Metro average of 24%.
                                                                                                            The Total Trade Area also features high rates of home ownership, with 81%
                                                                                                            of residents owning their own homes or paying a mortgage compared to
                                                                                                            the Sydney average of 65%, and a sizeable professional workforce. 85%
                                                                                                            of all workers are managers, professionals or other white-collar workers
                                                                                                            compared to the Sydney average of 75%.

                                                                                                                      Link to Trade Area Map

                                                                                                                      Link to Westfield Local Heroes
     317
     171                   99,550
                            52,289 m
                                   m22               $679.3
                                                       $341.0m                      3,200
                                                                                     2,640
                                                      TOTAL ANNUAL RETAIL
NUMBER
 NUMBEROF
       OF RETAILERS
          RETAILERS          GROSS
                              GROSSLETTABLE
                                   LETTABLE AREA
                                             AREA   TOTAL ANNUAL RETAIL SALES     CAR
                                                                                   CARPARKING
                                                                                      PARKING SPACES
                                                                                              SPACES
                                                             SALES

       Customer & Demographics                                                                         Ownership & Site
       Annual Visits (million)                                                             17.6        Centre Owner                                            Scentre Group (100%)
       Customer Advocacy - Net Promoter Score                                                31        Site Area (ha)                                                            6.6
       Average Household Income (TTA)                                                  $132,623        Aquisition Date                                                         1982
                                                                                   MTA      TTA        Book Value ($million) SCG Share                                     $1,095.3
       Retail Expenditure ($ billion)                                              $2.8    $4.2        Book Value ($million)                                               $1,095.3
       Population                                                               164,747 247,283        Capitalisation Rate 1                                                  5.25%
       Expected Population Growth                                                  1.1%    1.0%        Economic Yield 2                                                       5.62%
                                                                                                       Centre Opened                                                           1961
       Retailer In-store Sales Information                             2017        2018          2019 Centre Redeveloped                                                1968, 2001
       Total Sales - MAT $m                                            $657       $657           $679
       Total Specialty Sales MAT $m                                    $305       $309           $318 Retailers
       Avg Sales per Specialty Store ($’000)                          $1,237     $1,235         $1,284 Number of Retailers                                                        317
       Specialty Sales MAT $psm (
You can also read