CONSISTENT COMPOUNDERS PORTFOLIO - AN INVESTMENT STRATEGY FOR INDIAN STOCKS FROM MARCELLUS INVESTMENT MANAGERS - Marcellus Investment ...

Page created by Bryan Hammond
 
CONTINUE READING
CONSISTENT COMPOUNDERS PORTFOLIO - AN INVESTMENT STRATEGY FOR INDIAN STOCKS FROM MARCELLUS INVESTMENT MANAGERS - Marcellus Investment ...
CONSISTENT
                          COMPOUNDERS
                           PORTFOLIO
                         AN INVESTMENT STRATEGY FOR INDIAN
                         STOCKS FROM MARCELLUS INVESTMENT
                                     MANAGERS

                                          AUGUST 2021

                                MARCELLUS INVESTMENT MANAGERS PVT. LTD.
Private & Confidential                                                    1
CONSISTENT COMPOUNDERS PORTFOLIO - AN INVESTMENT STRATEGY FOR INDIAN STOCKS FROM MARCELLUS INVESTMENT MANAGERS - Marcellus Investment ...
INVESTMENT COMMITTEE
                         Saurabh Mukherjea, FRSA
                         Saurabh Mukherjea is the Founder and CIO of Marcellus. Saurabh was educated at the London School of Economics where he
                         earned a BSc in Economics (with First Class Honours) and an MSc in Economics. In London, Saurabh was the co-founder of
                         Clear Capital and in 2007 he was rated by the Extel Survey as one of the top small cap analysts in the UK. In India, Saurabh was
                         rated as the leading equity strategist in 2015, 2016 and 2017 by the Asiamoney polls. Prior to setting up Marcellus, Saurabh
                         was the CEO of Ambit Capital. Saurabh is a SEBI registered investment advisor. Upon SEBI’s invitation, he joined SEBI’s Mutual
                         Fund Advisory Committee. In 2019, Saurabh was part of the Expert Committee constituted by SEBI to upgrade the PMS
                         regulations. Saurabh has written four bestselling books.

                         Pramod Gubbi, CFA
                         Pramod leads the business development efforts at Marcellus. He also sits on Investment Committee that discusses and
                         approves investment strategies of the firm. Pramod was previously the MD & Head of Institutional Equities at Ambit Capital.
                         Prior to that Pramod, served as the head of Ambit’s Singapore office. Before joining Ambit, Pramod worked across sales and
                         research functions at Clear Capital. Besides being a technology analyst, Pramod has served in technology firms such as HCL
                         Technologies and Philips Semiconductors. Pramod did his B.Tech from Regional Engineering College, Surathkal and has a Post-
                         graduate Diploma in Management from the Indian Institute of Management – Ahmedabad.

                         Rakshit Ranjan, CFA
                         Rakshit is the Portfolio Manager of Marcellus’ Consistent Compounders strategy. Rakshit spent 6 years (2005-2011) covering UK
                         equities with Lloyds Bank (Director, Institutional Equities) and Execution Noble (Sector Lead). During these years, he was ranked
                         amongst the top-3 UK Insurance analysts (Thomson Reuters Extel survey) in the mid-cap space. From 2011, Rakshit led Ambit
                         Capital’s consumer research franchise and was voted as No.1 for Discretionary Consumer and within top-3 for Consumer Staples
                         in 2015 & 2016. He launched Ambit’s Coffee Can PMS in Mar’17 and managed it till Dec’18. Under his management, Ambit’s
                         Coffee Can PMS was one of India’s top performing equity products during 2018. Rakshit has a B.Tech from IIT (Delhi).

Private & Confidential                                                                                                                                       2
CONSISTENT COMPOUNDERS PORTFOLIO - AN INVESTMENT STRATEGY FOR INDIAN STOCKS FROM MARCELLUS INVESTMENT MANAGERS - Marcellus Investment ...
THE NETWORKING OF INDIA ALONGSIDE TECH CHANGES IS CREATING POLARISATION

The Indian economy has been ‘networked’ at a rapid pace over the
past decade:
•   The length of India’s national highways has doubled.
•   The number of broadband users has increased from 20 million in
    FY11 to 687 million at the end of FY20 (CAGR of 48%).
•   Airline passenger traffic has grown at a CAGR of 16%.
•   15 years ago, only 1 in 3 Indian families had a bank account; now
    nearly all Indian families have a bank account.

                             +
The inception of a single Goods & Services Tax in 2017 has allowed
companies to consolidate their supply chains (from multiple state-
level structures to unified national supply chains)
                                                                               =
                             +
The rise of low cost SaaS (e.g. Salesforce, SAP) alongside RFID
tracking and big data gleaned from 400mn internet connected
mobile phones is allowing companies to improve working capital
cycles, asset turns, profit margins and hence RoCE
                                             Source: Marcellus Investment Managers,
                                             CMIE, Ace Equity, Bloomberg, Ministry of
Private & Confidential                       Aviation, TRAI, Ministry of Road Transport.   3
CONSISTENT COMPOUNDERS PORTFOLIO - AN INVESTMENT STRATEGY FOR INDIAN STOCKS FROM MARCELLUS INVESTMENT MANAGERS - Marcellus Investment ...
Starting
                              RIGOROUS INVESTMENT PROCESS TO IDENTIFY 12-15 COMPOUNDERS
       universe of
          ~500                                The universe: Stocks in the BSE500
       companies
                                                                                                      Avoid companies with
                                                                                                         accounting and
                          Around 40%         Forensic Accounting Screen - Eliminate                    governance issues
                           companies          companies with sub-par accounting
                         drop out here
                                                                                                     Using defined thresholds on
                                                                                                   revenue growth, and RoCE. Goal
                                                    ▪ Filter sustainability of
                          Around 50%                                                                  is identify cash generative
                                                   fundamental parameters like
                           companies                                                                 franchises which are scaling
                                                      revenue growth, RoCE,
                         drop out here                                                                           rapidly
                                                        reinvestment rates

                                                    Bottom-up research and                          Detailed analysis of annual
                                                           analysis                              reports, management interviews
                           Bottom-up
                          research on                                                              and other published reports
                         only 10% of the                 3rd party/channel
                            universe                   checks, management             Corroborating ‘management version’
                                                              meetings                     with channel feedbacks +
                                                                                            independent views on
     Final portfolio                                                                     governance/capital allocation
        of 12-15                                             12-15
       Companies                                           Consistent
                                                          Compounders

Private & Confidential                                                                                                              4
CONSISTENT COMPOUNDERS PORTFOLIO - AN INVESTMENT STRATEGY FOR INDIAN STOCKS FROM MARCELLUS INVESTMENT MANAGERS - Marcellus Investment ...
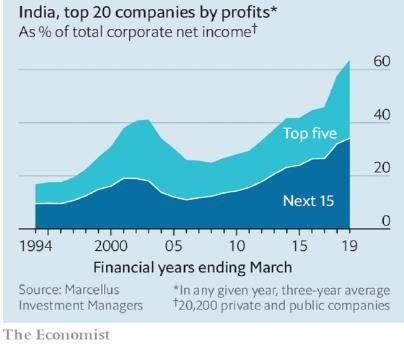
STEP 1: USE FORENSIC ACCOUNTING TO AVOID MOST COMMON PITFALLS
 Methodology                                                                                      A few of our forensic ratios
 12 accounting ratios covering income statement (revenue/ earnings
 manipulation), balance sheet (correct representation of assets/liabilities), cash               Category                      Ratios
 pilferage and audit quality checks.                                                             Income statement              (1) Cashflow from operations (CFO) as % of
                                                                                                 checks                        EBITDA
 Six years of historical consolidated financials.
                                                                                                                               (2) Provisioning for Debtors
 First rank stocks on each of the 12 ratios individually (some examples outlined
 in the table on the right). These ranks then cumulated across parameters to                     Balance sheet checks          (3) Yield on cash and cash equivalents
                                                                                                                               (4) Contingent liabilities as % of Networth (for the
 give a final pecking order on accounting quality for stocks –for instance D1
                                                                                                                               latest available year)
 being the best, D10 being the worst.
                                                                                                 Cash theft checks             (5) CWIP to gross block
 Selection of these ratios has been inspired by Howard M. Schilit’s legendary
 forensic accounting book ‘Financial Shenanigans’.                                               Auditor checks                (6) Growth in auditors' remuneration to growth in
                                                                                                                               revenues

       Strong correlation between                 accounting        quality     and               Quality wins and wins big over the long term
         shareholders’ returns
                           Zone of Quality                     Zone of Thuggery                    70%                         58%
                                                                                                                         48%
            12%                                                                                    50%
                               10%    10%                                                                                                                            31%
            10%                                                                                    30%                                                       25%
                                                            8%                                              3%                                                             8%
             8%     7%    6%                 7%                                                    10%                                                                          1%
             6%                                   5%                                              -10%
                                                                                                              -5%                                   -4%
             4%                                                                                                                                       -15%
                                                                                                  -30%                                  -19%
             2%                                        1%
                                                                                                  -50%                                     -37%
             0%
                                                                                                            CY16          CY17            CY18       CY19       CY20       CY15-20
             -2%                                                                                                                                                            CAGR
                               CY16-CY20 CAGR
             -4%                                                      -2%     -3%
                                                                                                                           Zone of Quality        Zone of Thuggery
                    D1    D2    D3     D4    D5   D6   D7      D8     D9      D10

Private & Confidential                                               Source: Marcellus Investment Managers; Ace Equity                                                                5
CONSISTENT COMPOUNDERS PORTFOLIO - AN INVESTMENT STRATEGY FOR INDIAN STOCKS FROM MARCELLUS INVESTMENT MANAGERS - Marcellus Investment ...
STEP 2: IDENTIFY COMPANIES WITH SUPERIOR CAPITAL ALLOCATION
                                                                      2010-20
  We create a list of stocks using a twin-filter criteria of          2009-19
  double-digit YoY revenue growth and return on capital               2008-18
  being in excess of cost of capital, each year for 10 years in a     2007-17
  row.                                                                2006-16
                                                                      2005-15
  Next, we build a portfolio of such stocks each year and hold        2004-14
  each of these annual iterations of portfolios for the               2003-13
  subsequent 10 years (without any churn).                            2002-12
                                                                      2001-11
  The bar chart on the right shows the back testing                   2000-10
  performance of such a filter-based portfolio.
                                                                               0.0%       5.0%      10.0%     15.0%      20.0%      25.0%     30.0%      35.0%
                                                                              SENSEX returns (CAGR)          Consistent Compounders' returns (CAGR)

                                                                     Source: Bloomberg. Note: Only the Consistent Compounder Portfolios which have finished their
                                                                     10year run have been shown. Note: These are Total Shareholder returns in INR terms.

    There are two conclusions from this exercise:
    •    This filter-based portfolio delivers returns of 20-30% p.a. (of INR returns) and 8-12% outperformance relative to the Sensex.
    •    The volatility of returns of such portfolios, for holding periods longer than 3 years, is similar to that of a Government of India Bond.
    Returns here (both for our portfolio and for the Sensex) are on a Total Shareholder Return basis i.e., all dividends are included in the
    returns.

Private & Confidential                                                                                                                                              6
CONSISTENT COMPOUNDERS PORTFOLIO - AN INVESTMENT STRATEGY FOR INDIAN STOCKS FROM MARCELLUS INVESTMENT MANAGERS - Marcellus Investment ...
STEP 3: INVEST IN FRANCHISES WITH HIGH PRICING POWER AND HIGH REINVESTMENT RATES
                         USING MARCELLUS’ LONGEVITY FRAMEWORK
                                                       Marcellus Research on a stock under coverage

               Current competitive advantages - here and now                                      Longevity / Sustainability of competitive advantages

        Earnings growth rate                      Moat score                                     Lethargy score                   Succession planning score
    Revenue growth, ROCE and               Strength of today's pricing                  Analysis based on efforts made          Softer aspects to help build an
     capital reinvestment rate                       power                                    in the last 3 years                        'institution'
     Quantify industry demand                                                                                                  Four aspects of succession test:
                                                                                        Three aspects of lethargy tests:
     growth, its drivers and its                                                                                                  1) Decentralised execution
                                                                                          1) Incremental deepening of
            resilience.                    Can a competitor offer a                                                               2) CXOs - their quality and
                                                                                                  existing moats
                                        product which is a third cheaper                                                               tenure at the firm
     Quantify revenue growth                                                                   2) Experimentation /
                                          and still have no impact on                                                              3) Historical evidence of
    related to expected market                                                            investments towards adding
                                           either the profitability or                                                         implementing succession in CXO
            share gains.                                                                  new moated revenue growth
                                          market share of our investee                                                                       roles
   Profitability and asset turns -                                                                    drivers
                                                      firm?                                                                      4) Independence of Board of
       expected to improve                                                              3) Attempts at radical disruption
                                                                                                                                           Directors
          meaningfully?                                                                      of the industry's future

        Growth in cash flows                                                            Longevity of cash flows

                                        Outcome: 1) Position sizing of stocks relative to others in our portfolio; and 2)
                                                                 Absolute valuation of stocks
Private & Confidential                                                                                                                                            7
CONSISTENT COMPOUNDERS PORTFOLIO - AN INVESTMENT STRATEGY FOR INDIAN STOCKS FROM MARCELLUS INVESTMENT MANAGERS - Marcellus Investment ...
CONSISTENT COMPOUDING OF FREE CASH FLOW FOR MARCELLUS' CCP PMS COMPANIES
                                                     Free Cash Flow (FCFE) CAGR                                                                      Share Price CAGR
      Stock Name                            5-years                10-years    20-years                                             5-years                 10-years    20-years
                               FY01-06 FY06-11 FY11-16 FY16-21 FY01-11 FY11-21 FY01-21                                  FY01-06 FY06-11 FY11-16 FY16-21 FY01-11 FY11-21 FY01-21
      Abbott India              -10%     -1%       48%   24%     -6%     35%     13%                                      16%     12%     29%     26%     14%     28%     21%
      Asian Paints               19%     41%       18%   19%     30%     19%     24%                                      28%     33%     27%     19%     31%     23%     27%
      Berger Paints              24%     -1%       44%   10%     10%     26%     18%                                      49%     11%     41%     34%     28%     38%     33%
          Nestle                 17%     15%       10%   15%     16%     12%     14%                                      11%     32%      9%     26%     21%     17%     19%
          Pidilite               42%      4%       83%   1%*     22%     40%*   30%*                                      40%     23%     32%     25%     31%     28%     30%
           Titan                -16%    179%      -21%   62%     54%     13%     32%                                      82%     35%     12%     36%     57%     23%     39%
        Divis Labs               NA      54%       35%   9%     34%^     21%    27%^                                       NA     29%     24%     30%     NA      27%     NA
         Page Ind                NA      36%       33%   39%    25%**    36%    31%**                                      NA     NA      50%     20%     NA      34%     NA
          Relaxo                 NA       NA      -36%  293%     23%     59%     40%                                      -7%     51%     67%     37%     18%     51%     34%
     Dr. Lal Pathlabs            NA       NA       49%   22%      NA     35%     NA                                        NA     NA       NA     24%     NA       NA     NA

 Weighted Average                15%         40%          29%         39%         24%         28%          25%            33%         29%         30%         26%          30%         28%         28%
Source: Marcellus Investment Managers; Ace Equity; FCFE = Operating cash flow less Capex less Investment in Subsidiaries/Strategic investments /Acquisitions less Net debt repayments less Interest
Paid less Lease liabilities; *In case of Pidilite, high capex on account of Araldite acquisition skews the CAGR % making it incomparable, hence we have taken FY16-20, FY11-20 and FY01-20; ^Divis' FCFE is
for FY02-11 and FY02-21 since company was not listed in FY01; **Page's FCFE is for FY04-11 and FY04-21 since company was not listed prior to FY04; @Relaxo's FCFE for FY01-06 and FY06-11 shows NA
since company had near ZERO FCFE during those periods

      • FCFE compounding for CCP companies has been healthy, consistent and accelerating over the last 2
        decades
      • Market Cap compounding for CCP companies has been broadly in line with FCFE compounding over the
        last 2 decades

Private & Confidential                                                                                                                                                                                   8
CONSISTENT COMPOUNDERS PORTFOLIO - AN INVESTMENT STRATEGY FOR INDIAN STOCKS FROM MARCELLUS INVESTMENT MANAGERS - Marcellus Investment ...
STRONG 10 YEAR EARNINGS GROWTH MAKES P/E REDUNDANT
                                                       P                       P/E     E
                                               NON-COMPOUNDING + OSCILLATING           CAN COMPOUND OVER TIME

                                                     P%                        P/E %   E%

        A for Airlines (e.g.     P/E doubles        +7%                        +7%     0%
        Telcos)
                                 P/E halves         -7%                        -7%     0%

        B for Buffett (e.g.
                                 P/E doubles       +19%                        +7%     12%
        Maruti, HUL)
                                 P/E halves         +5%                        -7%     12%

        C for CCP (e.g.          P/E doubles       +32%                        +7%     25%
        Asian Paints,
        HDFC Bank)               P/E halves        +18%                        -7%     25%
Private & Confidential                                                                                          9
CONSISTENT COMPOUNDERS PORTFOLIO - AN INVESTMENT STRATEGY FOR INDIAN STOCKS FROM MARCELLUS INVESTMENT MANAGERS - Marcellus Investment ...
THE CONVENTIONAL DCF METHOD UNDERVALUES LONGEVITY OF A BUSINESS

                                                                             Stage 1     Terminal
                                                     Stage 1    Stage 2
                                                                            earnings      earnings    Cost of Equity   P/E (x)
                                                    duration   duration
                                                                          growth CAGR   growth rate

                              Scenario 1              5 yrs     10 yrs       25%            5%            12%           24
                              Scenario 2             15 yrs     10 yrs       25%            5%            12%           79
                              Scenario 3             25 yrs     10 yrs       25%            5%            12%           245
            Source: Marcellus Investment Managers

                Fair value P/E increases with increasing conviction in longevity assumptions
Private & Confidential                                                                                                           10
CCP TYPICALLY OUTPERFORMS THE BENCHMARK BY 10% POINTS
                                 CCP’S ENTIRE OUTPERFORMANCE IS DUE TO EARNINGS GROWTH
                                                                                                                                                                           High hit
                                                                                                                                                                             rate

Earnings growth of Marcellus' CCP stocks (healthly & broad based) and NIFTY50     Share price performance of Marcellus' CCP stocks (healthly & broad based) and NIFTY50
index                                                                             index
                                                       FY18-21          FY15-21                                                          FY18-21          FY15-21      Since Inception
             Name                      FY21                                                    Name                      FY21
                                                       (CAGR)           (CAGR)                                                           (CAGR)           (CAGR)         (1st Dec'18)
         Abbott India Ltd.              16%              20%              20%              Abbott India Ltd.              -3%              40%              25%               33%
         Asian Paints Ltd.              17%              16%              15%              Asian Paints Ltd.              52%              31%              21%               29%
        Bajaj Finance Ltd.             -16%              21%              30%             Bajaj Finance Ltd.             132%              43%              52%               33%
    Berger Paints India Ltd.*           11%              17%              18%          Berger Paints India Ltd.           54%              44%              31%               42%
     Divis Laboratories Ltd.*           44%              31%              15%          Divis Laboratories Ltd.            82%              49%              26%               45%
         HDFC Bank Ltd.                 17%              20%              20%              HDFC Bank Ltd.                 73%              17%              20%               15%
    Kotak Mahindra Bank Ltd.            15%              17%              22%         Kotak Mahindra Bank Ltd.            35%              19%              18%               15%
         Nestle India Ltd.               6%              17%              10%              Nestle India Ltd.               5%              28%              16%               21%
      Page Industries Ltd.*              0%               0%              10%            Page Industries Ltd.             79%              10%              14%                5%
      Pidilite Industries Ltd.           1%               5%              14%           Pidilite Industries Ltd.          33%              25%              20%               20%
     Relaxo Footwears Ltd.              29%              22%              19%           Relaxo Footwears Ltd.             46%              40%              32%               41%
       Titan Company Ltd.              -35%              -5%               3%            Titan Company Ltd.               67%              18%              26%               23%
       Dr. Lal Pathlabs Ltd.            30%              20%                             Dr. Lal Pathlabs Ltd.            93%              46%                                59%
   HDFC Life Insurance Co Ltd.           5%               7%                         HDFC Life Insurance Co Ltd.          58%              15%                                26%
              W. Avg.                  10%               15%              17%                   W. Avg.                  60%               30%              25%              28%

           NIFTY 50**                   10%              0%                 4%                NIFTY 50                    71%              13%              10%               13%
Source: Marcellus Investment Managers; Ace Equity; Bloomberg; *FY21 earnings      Source: Marcellus Investment Managers; Ace Equity; *1yr, 3-yr and 6-yr CAGR portfolio return has been
growth is based on broker estimates since March'21 quarter results are not yet    computed using current model portfolio allocations
announced; **NIFTY50 EPS is taken from Bloomberg

Private & Confidential                                                                                                                                                                11
CCP’S SUPERIOR EARNINGS GROWTH IS DRIVEN BY HIGH ROCE AND HIGH
                                               REINVESTMENT RATE
                                ROCE and Reinvestment rate of Marcellus' CCP stocks
                                                                            ROCE*            Avg. ROCE*     Avg. Reinvt. rate
                                                 Name
                                                                            (FY21)            (FY16-21)        (FY16-21)**
                                           Abbott India Ltd.                  38%                37%               2%
                                           Asian Paints Ltd.                  37%                38%               35%
                                           Bajaj Finance Ltd.                 13%                20%               89%
                                       Berger Paints India Ltd.               30%                31%               57%
                                       Divis Laboratories Ltd.                25%                28%               51%
                                            HDFC Bank Ltd.                    16%                18%               87%
                                      Kotak Mahindra Bank Ltd.                13%                13%               98%
                                           Nestle India Ltd.                 148%                76%               10%
                                         Page Industries Ltd.                 58%                62%               17%
                                       Pidilite Industries Ltd.               30%                37%               48%
                                       Relaxo Footwears Ltd.                  29%                28%               55%
                                         Titan Company Ltd.                   21%                25%               29%
                                         Dr. Lal Pathlabs Ltd.                36%                39%               25%
                                     HDFC Life Insurance Co Ltd.              18%                24%               79%
                                                W. Avg.                       36%                34%               50%
                                Source: Marcellus Investment Managers; Ace Equity; *ROE considered instead of ROCE for
                                BFSI companies; **Reinvestment rate for financials = (1 - dividend payout ratio(%));
                                **Reinvestment rate for non-financials is 'cumulative CFI divided by cumulitive CFO over last
                                six years'; *ROCE for FY21 is assumed to be same as FY20 since March'21 quarter results are
                                not yet announced

Private & Confidential                                                                                                          12
CASE STUDY: ASIAN PAINTS [MKT CAP $37 BN]

  •    “We have been lucky to have new jewels in the form of                  50%           Sales Growth, PBT Margin and ROCE from 1952                                           25%
       professional managers who attempted to do things that haven’t          45%
       been done before, and lucky to have a management that allowed          40%                                                                                                 20%
       them to do so’ — K.B.S. Anand, Former MD & CEO, Asian Paints           35%
                                                                              30%                                                                                                 15%
                                                                              25%
  •     Growth drivers:                                                       20%                                                                                                 10%
      a. Moats built predominantly around supply chain efficiencies:          15%
           No room for competition to disrupt through better product          10%                                                                                                 5%
           quality or high trade margins as the market dynamics force          5%
           dealers to make money on volumes.                                   0%                                                                                                 0%
      b. Strong HR: Attracts top quality talent from the most prestigious              1952-62      1962-72      1972-82      1982-92     1992-2002     2002-12      2012-21
           institutions and then grooms and empowers them. Result –                     Revenue CAGR over 10 years (LHS)        PBT/Cap Employed (LHS)            PBT Margin (RHS)
           talented & independent professional management team.
                                                                              Source: Marcellus Investment Managers; Ace Equity
      c. Tech investments: Makes use of technology to improve
           operating efficiencies, which helps in three ways – a) shape up
           moats around systems and processes (e.g., demand                                 Volume growth, Sales growth and Earnings growth (FY01-21)
           forecasting); b) suffocates competition through fewer price
           hikes; and c) disrupts itself once every 2-3 decades                                                       FY01-06         FY06-11         FY11-16         FY16-21
      d. Addition of new revenue growth drivers: Foray into
           adjacencies such as waterproofing (1/10th of paints market),                Volume CAGR                      11%             16%             10%             11%
           Launch of service offerings (SAFE Painting service), Launch of
           Home Decor service (interior design & execution), Scaling up of              Sales CAGR                      19%             21%             14%              9%
           new retail formats – Beautiful Homes stores (all in one stores),
           Colour Ideas                                                                  PAT CAGR                       15%             33%             15%             12%

      NOTE: Asian Paints forms a part of most of Marcellus’ portfolios                   FCFE CAGR                      19%             42%             17%              21%
                                                                              Source: Marcellus Investment Managers; Ace Equity; FCFE = Operating cash flow less Capex less Net
                                                                              Debt Repayments less Interest Paid
Private & Confidential                                                                                                                                                               13
FUND PERFORMANCE (AS ON 31ST JULY’2021)

        At Marcellus we don’t believe in timing the market and hence deploy the money into our strategies as soon as the investor
        transfers the funds to us. However, we do recognise the emotional aspect of loss aversion in the short term and have launched STP
        (Systematic Transfer Plan) plan using which clients can stagger their investment in tranches spread over 5 months.

        For more details please refer to our FAQs https://marcellus.in/wp-content/uploads/2020/11/STP-FAQs.pdf
Private & Confidential                                                                                                                      14
FUND STRUCTURE
   Marcellus offers Consistent Compounders Portfolio with a zero fixed fees option

   The Consistent Compounders PMS comes with ZERO entry load/exit load and with no lock-in. Our clients can choose
   any of the following fee structures:

   1. a fixed fees model (2% p.a. fixed fees + zero performance fees) or
   2. a variable fees model (zero fixed fees + performance fees of 20% profit share above a hurdle of 8%, no catch-up)*
   3. a hybrid model (1% p.a. fixed fees + performance fees of 15% profit share above a hurdle of 12%, no catch-up).

   High water mark applies for performance fees; Minimum investment: INR 50 lacs
   ***Clients also have the option to be onboarded directly (Direct Fee Code).

   Marcellus is delighted to offer its clients a Systematic Investment Plan (SIP). Investors now have the option to save and
   invest regularly in Marcellus Funds. https://marcellus.helpscoutdocs.com/article/100-systematic-investment-plan-sip-
   faqs

   At Marcellus we don’t believe in timing the market and hence deploy the money into our strategies as soon as the
   investor transfers the funds to us. However, we do recognise the emotional aspect of loss aversion in the short term and
   have launched STP (Systematic Transfer Plan) plan using which clients can stagger their investment in tranches spread
   over 5 months. https://marcellus.helpscoutdocs.com/article/96-stp

Private & Confidential                                                                                                         15
CCP FACTSHEET (1/2)
       Fund Details                                                         Sector Wise Allocation
       Strategy Name          Consistent Compounders                                   1%
                                                                                                               Home building materials
       Fund Manager           Rakshit Ranjan, CFA
       AUM In INR Crs         4,811                                              17%                           Pharma & Healthcare
                                                                                             25%
       Category               Large Cap
                                                                           7%                                  Financials
       Benchmark              Nifty50 Total Return Index                                                       Consumer staples
                                                                                             17%
       Top 5 Holdings (accounts for ~50% of allocation)                                                        Consumer discretionary
                                                                                 33%
       Asian Paints            Home Building Materials
                                                                                                               Cash
       HDFC Bank               Financials
       Bajaj Finance           Financials                                   Portfolio Metrics
       Pidilite Industries     Home Building Materials                      Wtd. Avg. Market Cap (INR Cr.)            2,30,220
       HDFC Life               Financials                                   Portfolio P/E (TTM)                       82.41x
       Market-Cap Wise Allocation                                           Dividend Yield                            0.8%
       Large-Cap               79%                                          Churn Ratio (TTM)                         12%
       Mid-Cap                 20%                                          Std Deviation (12 month rolling)          13.8%

       Cash                    1%                                           Sharpe Ratio (12 month rolling)           1.52

Private & Confidential                                                                                                                   16
100
                                                                                                                     140
                                                                                                                           160
                                                                                                                                 180
                                                                                                                                       200

                                                                                                               120

                                                                                 0
                                                                                     20
                                                                                          40
                                                                                               60
                                                                                                    80
                                                                     Dec-2018
                                                                     Jan-2019

Private & Confidential
                                                                     Feb-2019
                                                                     Mar-2019
                                                                     Apr-2019

                         * Based on NAV's rebased to 100
                                                                     May-2019
                                                                     Jun-2019
                                                                      Jul-2019
                                                                     Aug-2019
                                                                     Sep-2019
                                                                     Oct-2019
                                                                     Nov-2019
                                                                     Dec-2019
                                                                     Jan-2020
                                                                     Feb-2020
                                                           NAV       Mar-2020
                                                                     Apr-2020
                                                                     May-2020
                                                           N50 TRI

                                                                     Jun-2020
                                                                                                                                                                           CCP FACTSHEET (2/2)

                                                                      Jul-2020
                                                                                                                                             CCP v/s NIFTY50 performance

                                                                     Aug-2020
                                                                     Sep-2020
                                                                     Oct-2020
                                                                     Nov-2020
                                                                     Dec-2020
                                                                     Jan-2021
                                                                     Feb-2021
                                                                     Mar-2021
                                                                     Apr-2021
                                                                     May-2021
                                                                     Jun-2021
                                                                      Jul-2021
17
BESTSELLING BOOKS WHICH WILL GIVE YOU MORE INFORMATION

Private & Confidential                                                            18
WE PROACTIVELY SEEK TO INFLUENCE CHANGE
                            Area of engagement                                                     Desired outcome
                             •   Our analysts use forensic accounting to keep   •   If we spot diversion on a meaningful scale, we exit
           Corporate             on eye on the diversion of cash by the         •   If we spot the beginnings of what look like small scale
          governance             ‘promoters’ of our investee companies              diversion, we speak to the ‘Promoter’ and explain to her
                                                                                    why her wealth creation can be compromised

                             •   Thirty years from the reforms which opened     •   Through our discussions with suppliers, customers and
                                 up the Indian economy in 1991, many of             competitors of a company, we keep a close eye on
          Succession             India’s leading ‘promoters’ are aged 70 or         whether the ‘promoter’ is on top of his game.
           planning              over. Hence, they are handing charge to the    •   If his successors either do not exist or have not been
                                 next generation.                                   groomed adequately, we discuss the matter and its
                                                                                    consequences with him.
                             •   Our investment strategy – of investing in      •   If we see a company either hoarding cash or moving into
                                 dominant franchises with ROCE of around            an unrelated, we engage with the ‘promoter’ to
                                 40% - naturally leads us towards companies         understand her thinking on capital allocation.
       Capital allocation        which generates heavy Free Cashflow.           •   If we are not convinced about the fitness of what she’s
                             •   If this Free Cashflow is not reinvested            doing, we present our point of view (arguing in favour of
                                 wisely, the compounding of the franchise           a different capital allocation strategy)
                                 suffers                                        •   If six months later we see that our engagement has
                                                                                    made no difference, we consider exiting
                             •   Regulation – both in corporate law and in      •   By being a part of multiple regulatory committees, by
          Regulatory             securities market law – is still evolving in       writing in the press and by being vocal on social and
          constructs             India. This creates risks for the unwary.          broadcast media about regulatory reform, we have
                                                                                    sought to improve transparency in the fund management
                                                                                    industry in India

Private & Confidential                                                                                                                          19
OUR TEAM - PORTFOLIO COUNSELLORS
                         Ashvin Shetty, CA, CFA
                         Ashvin has more than 10 years of experience in equity research. He led the coverage on automobile sector at Ambit Capital from 2010 to
                         2017 during which he was ranked in the Starmine Analyst Awards 2013 and 2016 for his stock picking abilities. He thereafter worked as a
                         senior analyst for Ambit’s Mid and Small cap PMS funds till November 2018. Prior to joining Ambit, he worked with Execution Noble as an
                         analyst covering consumer and media space. He has also worked with KPMG’s and Deloitte’s statutory audit departments from 2004 to 2007
                         gaining extensive experience across Indian accounting standards and financial statement analysis. Ashvin is a BCom graduate from Narsee
                         Monjee College (Mumbai). He is a qualified Chartered Accountant (ICAI India) and Chartered Financial Analyst (CFA Institute, USA).

                         Sudhanshu Nahta, CA
                         Prior to joining Marcellus, Sudhanshu was Executive Assistant to the CEO at Ambit Capital and worked in the Institutional Equities’ Strategy
                         team. He has also worked with KPMG in the statutory audit team from 2013 to 2016 gaining extensive experience across Indian accounting
                         standards, financial control systems and financial statement analysis & reviews. Sudhanshu is a qualified Chartered Accountant and a CFA
                         Level 3 candidate. He has completed his graduation in Commerce from Mumbai University.

                         Salil Desai, CA, MBA
                         Salil joined Marcellus from Premji Invest, India’s largest family office by assets under management, where he spent 6 years as a senior
                         member of the team that managed ~US$2bn in listed equities. Prior to that, Salil worked for IDFC Securities, a prominent equity brokerage in
                         Mumbai, where he came to be known as one of India’s leading analysts for core economy sectors. Over a career spanning 12 years in
                         equities, he has tracked multiple sectors, including industrials, infrastructure, utilities, insurance, cement, metals and logistics. Salil is a
                         Chartered Accountant and a Post Graduate Diploma in Business Management from NMIMS, Mumbai. He completed his graduation in
                         Commerce from Mumbai University

                         Tej Shah, CA, CFA
                         Prior to joining Marcellus, Tej worked at Mayfield, a Silicon Valley headquartered venture capital fund which manages $3Bn globally and
                         $220Mn in India. Tej spent 2 years as a part of Mayfield India’s investment team covering multiple sectors and being at the centre of India’s
                         evolving venture ecosystem. Prior to Mayfield, Tej was a part of the equity and capital markets team of Ambit Capital where he worked on
                         executing IPOs, QIPs and buybacks. Tej is a Chartered Accountant and has cleared all levels of the CFA exam. He holds a B. Com degree from
                         Ahmedabad University.

Private & Confidential                                                                                                                                                      20
OUR TEAM - OPERATIONS, HR, COMPLIANCE & LEGAL, IT
                         Manish Hemnani, MBA
                         Operations
                         Manish is one of the Founders of Marcellus. Manish comes from quantitative data analytics and research background, and has more than 12
                         years of experience working with banks and financial institutions across east-Asia, India and Europe. Prior to founding Marcellus, he founded
                         Crosstab Limited (2011), a London based quantitative data analytics outfit. Prior to that he worked with a Mumbai based boutique analytics
                         consulting firm. Manish holds an MBA from University of Warwick – Warwick Business School (UK).

                         Sapana Bhavsar
                         Human Resources
                         Sapana has 15 years of experience in Human Resources. In her prior stint with CRISIL, Sapana was leading the India HR Shared Services and was
                         the Business HR for CRISIL’s Research division. Before CRISIL, Sapana was associated with Bank of America Merrill Lynch and has donned varied
                         hats across the BAML entities. Sapana is a University Gold Medallist and has a Master’s degree in Labour Studies from Mumbai University.

                         Parimal Deuskar, Company Secretary
                         Compliance and Legal
                         Parimal heads Compliance & Legal function at Marcellus. In his last assignment, Parimal set up the Group Compliance Function at Avendus
                         Capital, an investee company of KKR US. He is experienced in dealing with securities market regulators in US, Europe and Asia. Over his career
                         spanning 15+ years he has set up fund structures in jurisdictions like India, Singapore, Ireland and Mauritius. His previous employers include
                         Ambit, and Prudential UK’s India KPO. Parimal holds Bachelor of Commerce and Bachelor of Law degrees from Mumbai University. He is also a
                         qualified Company Secretary.

                         Siddharth Joshi
                         Information Technology
                         Siddharth has more than 15 years of experience in Technology. During these 15 years, he has provided technology consultation to a variety of
                         functions within investment banks and financial institutions. Before joining Marcellus, Siddharth was working with Nomura where he was head
                         of multiple teams, responsible for providing IT solutions to front office, operations and risk. He has expertise in Middleware, Automation,
                         DevOps, Cloud and Messaging for low-latency trading. Prior to working with Nomura, he has been associated with Wells Fargo and TCS.
                         Siddharth has a Bachelor of Engineering from Rajiv Gandhi University, Indore.

Private & Confidential                                                                                                                                                    21
OUR 70 EMPLOYEES COME FROM A VARIETY OF BACKGROUNDS
 Our PURPOSE - To make wealth creation simple and accessible, by being trustworthy and transparent capital allocators.
                                                                       •   Diverse opinions and ideas encouraged and
• Overall Gender diversity - 31%; At
                                                                           invited during the ‘All Marcellus’ weekly
  mid-management level - 41%; thus
                                                                           meeting.
  creating a pool of potential women
  leaders
                                                                       •   The team follows a no-designation policy. Use of
                                                                           hierarchical “job titles” not allowed in the firm.
• Average Age – 31 years; age range -
  20 to 50 years; 55% of the team
                                                                       •   Research team meets twice a week for 3-hour
  below 31 years; thus constituting a
                                          Diversity                        long deliberations on existing portfolios; this also
  fair mix of new age and experienced
                                                                           includes cross team discussions and ideations
  generations.
                                                       Inclusive           across all levels.
• Educational background ranges from                    Culture
                                                                       •   An integral part of performance assessment is
  Finance, Management, Economics,
                                                                           feedback on behaviours (30% weightage) that is
  Statistics, Engineering, Law and
                                                                           sought via 360 degree feedback and is published
  Company Secretarial; 25% of the
                                                                           to the whole firm on a monthly basis.
  team has dual post-graduation
  degrees; average total experience of
                                                                       •   The team’s inputs on the firm’s policies and
  8 years; thus creating domain experts
                                                                           practices are captured by an anonymous third
  across functions
                                                                           party engagement survey; these inputs drive the
                                                                           firm’s People priorities
Private & Confidential                                                                                                       22
ANNEXURE
                         PORTFOLIO FUNDAMENTALS

Private & Confidential                            23
FY21 FUNDAMENTALS OF MARCELLUS’ CCP PORTFOLIO COMPANIES
                                      Q4FY21 Q4FY21 FY21
              Stock                    Sales Earnings Earnings                                                                            Remarks
                                        YoY    YoY      YoY
Abbott India Ltd.                        14%          37%          16%       Sales growth of 5% yoy in FY21. Displayed resiliency during a turbulent year
Asian Paints Ltd.                        43%          81%          17%       48% yoy volume growth in Q4FY21 and 13% yoy volume growth in FY21 led by market share gains.
Berger Paints India Ltd.                 50%          98%           9%       55-60% yoy volume growth in Q4FY21 and double digit yoy volume growth in FY21 led by market share gains.
Divis Laboratories Ltd.                  29%          29%          44%       Sales growth of 21% yoy & earnings growth of 44% yoy in FY21 led by improvement in capacity utilisation, backward
                                                                             integration and debottlenecking projects.
Nestle India Ltd.                         9%          15%           6%       10% yoy growth in domestic sales largely driven by volume & mix. Added focus on expansion of rural distribution and
                                                                             new product launches.
Page Industries Ltd.                     63%         272%           -1%      Sales growth of 63% yoy and volume growth of 54% yoy in Q4FY21 led by strong growth in athleisure, kidswear and e-
                                                                             commerce.
Pidilite Industries Ltd.                 45%          96%           1%       Volume & mix growth of 45% yoy in consumer segment led by market share gains, rapid expansion of distribution and
                                                                             investments in digital.
Relaxo Footwears Ltd.                    38%          97%          29%       Volume growth of 8% yoy in FY21 led by market share gains on account of resilient supply chain and robust
                                                                             distribution.
Titan Company Ltd.                       59%          66%          -35%      70% yoy in jewellery segment in Q4FY21 and 32% yoy retail growth in Jan & Feb'21 led by market share gains and
                                                                             digital initiatives.
Dr. Lal Pathlabs Ltd.                    43%         161%          30%       27% yoy growth in non-covid business. Accelerated network expansion during FY21 - 20% yoy increase in Patient
                                                                             Service Centres
HDFC Bank Ltd.*                          19%          16%          17%       Growth in advances and deposits much higher than that of the industry reflective of market share gains.
Bajaj Finance Ltd.*                      26%          42%          -16%      Annualised QoQ loan book growth in Q4 reflects the pick-up in business momentum post. Earnings impacted due to
                                                                             conservative provisioning.
Kotak Mahindra Bank Ltd.*                18%          31%          15%       Annualised QoQ loan book growth in Q4 reflects the pick-up in business momentum post.
HDFC Life Insurance Co Ltd.**            21%          14%          14%       Market share based on Individual WRP increased from 14.2% in FY20 to 15.5% in FY21 on the back of a balanced
                                                                             product and distribution mix.
Overall Avg. (CCP Portfolio)             34%          74%          11%
Source: Ace Equity; Marcellus Investment Managers; *Sales growth for lenders is equal to annualised QoQ loan book growth in Q4FY21; **Sales growth for HDFC Life reflects the growth in Total Premiums during Q4FY21
and Earnings growth for Q4FY21/FY21 reflects the growth in Value of New Business (VNB)

Private & Confidential                                                                                                                                                                                             24
EXAMPLES OF MARKET SHARE GAINS BY OUR INVESTEE COMPANIES
                                                            Fundamentals of lenders in Marcellus' CCP PMS vis-à-vis industry
                                                                                                    Annualised
                                                                                                     QoQ loan Tier 1 capital Cost of funds Cost of funds
                                                                                                    book growth      (Q4FY21)  (Q4FY20)      (Q4FY21)
                                                                                                      (Q4FY21)
                                                                       HDFC Bank Ltd.                   20%            17.6%     5.0%          4.1%
                                                                  Kotak Mahindra Bank Ltd.              19%            21.4%     4.8%          3.8%
                                                                     Bajaj Finance Ltd.                 29%            25.1%     8.0%          7.1%

                                                                Average for the banking industry                          13%              13.3%*              5.5%             4.9%*
                                                            Source: Marcellus Investment Managers; Ace Equity; *as on Sept'20

Fundamentals of Paint companies in Marcellus' CCP PMS vis-à-vis peers                                                       Fundamentals of Dr. Lal Pathlabs vis-à-vis peers
                                       Q4FY21         Q3FY21        Q2FY21        Q1FY21         Q4FY20          FY21                                              Q4FY21       Q3FY21   Q2FY21   Q1FY21   Q4FY20   FY21
YoY Sales growth (consolidated)                                                                                                 YoY Sales growth (consolidated)
        Asian Paints Ltd.                43%           25%             6%           -43%           -7%            7%                  Dr. Lal Pathlabs Ltd.           43%        38%      18%      -21%      0%     19%
    Berger Paints India Ltd.             50%           25%             9%           -46%           -8%            7%               Metropolis Healthcare Ltd.         41%        23%      29%      -30%      3%     17%
   Kansai Nerolac Paints Ltd.            35%           20%             4%           -59%          -11%           -5%              Thyrocare Technologies Ltd.         45%        31%      32%      -49%     -4%     14%
     Akzo Nobel India Ltd.               34%            7%            -4%           -64%          -18%           -9%             YoY Sales growth (non-covid)
YoY Volume growth (decorative)                                                                                                        Dr. Lal Pathlabs Ltd.           27%        8%        -5%     -38%     -2%      -3%
        Asian Paints Ltd.                48%           33%            11%           -38%            3%           13%               Metropolis Healthcare Ltd.         21%        0%       -15%     -50%      6%     -11%
    Berger Paints India Ltd.             60%           32%            17%           -40%            2%         ~12-14%            Thyrocare Technologies Ltd.         25%        5%        -9%     -70%     -4%     -13%
   Kansai Nerolac Paints Ltd.            37%           21%            15%           -44%           -6%                      Source: Marcellus Investment Managers; Ace Equity
Source: Marcellus Investment Managers; Ace Equity; Volume growth numbers for Berger Paints and Kansai Nerolac are based
on broker estimates/management interviews

  Private & Confidential                                                                                                                                                                                                   25
CASE STUDY: BAJAJ FINANCE [MKT CAP $47 BN]
                                                                                                 Key Performance Matrices: Bajaj Finance (FY 2008-21)
  •    “We had been showing ALM data for the past five years. Two
                                                                                                                                                                                                      13- year
       years ago, nobody paid much attention to it, so we pushed it back                        Indicators                               FY08                   FY20                 FY21
                                                                                                                                                                                                       CAGR
       as an annexure in our presentations. Now when investors ask for
       it, I tell myself, ‘Thank God, I did not treat ALM as an annexure to               AUM (Rs. in bn )                                25                   1,471                 1,529                 37%
       my business model” — Rajeev Jain, MD, Bajaj Finance                                 PBT (Rs. in bn)                                0.3                       73                 60                  50%
                                                                                                      RoA                                0.9%                   4.1%                 3.1%
  •    Company has built its strengths around:                                                        RoE                                3.2%                  20.2%                 12.8%
                                                                                                  NNPA                                  7.05%                  0.65%                 0.75%
      a.   Found a niche, differentiated business opportunity in consumer
                                                                               Source: Marcellus Investment Managers; Ace Equity
           durable financing 10 years ago. Today, more than 70% of all
           consumer durables financing in India is done by Bajaj Finance.
      b.   Focus on high velocity, small ticket size lending with turnaround     7.05%                                   13 Year Financial snapshot
                                                                                 1,800                                                                                                                                 80
           times and customer convenience as the differentiation rather                   5.50%
                                                                                                                                                                                                       73
                                                                                 1,600                                                                                                                        1,529
           than interest rates.                                                                                                                                                                   62 1,471
                                                                                                                                                                                                                       70
                                                                                 1,400                                                                                                                                59
      c.   Ability to switch gears across products based on data driven risk                                                                                                                                           60

           and underwriting models. Completely stopped construction              1,200                                                                                                             1,159
                                                                                                  2.20%                                                                                                                50
           equipment financing in 2014 due to muted RoE and profitability        1,000                                                                                                 38
                                                                                                                                                                                                                       40
           prospects.                                                             800                   0.80%
                                                                                                                                   0.45% 0.28%                                 28           824            0.65% 0.75%
                                                                                                                 0.12% 0.19% 0.28%                                         0.44%                                       30
      d.   Data science backed credit algorithms to capture data points           600                                                                               20
                                                                                                                                                         14                         602 0.43% 0.63%                    20
                                                                                  400
           over & above those captured by credit agencies                                 0       1         1     4                 9         11
                                                                                                                                                                         442
                                                                                                                          6                                                                                            10
                                                                                  200                                                                         324
                                                                                          25      25        40    76                               241
                                                                                                                              131       175
                                                                                    -     1                                                                                                                            -
      NOTE: Bajaj Finance forms a part of most of Marcellus’ portfolios
                                                                                         2008    2009   2010     2011    2012   2013      2014        2015      2016       2017       2018    2019    2020    2021

                                                                                                                        AUM (in BN)                PBT (in BN)                 Net NPA

                                                                               Source: Marcellus Investment Managers; Ace Equity
Private & Confidential                                                                                                                                                                                                     26
CASE STUDY: DR. LAL PATHLABS [MKT CAP $3.2 BN]
 •    Dr. Lal provides pathology diagnostics in North and East India                           ~3700+ collection centres, ~20mn patients annually,
      with a network of 200+ labs, 3000+ collection centres (CCs) and                                         ~50mn tests annually
      6000+ pick-up-points (PUPs).
                                                                                4000                                                                                            60
 •    Over the past five years, it has strengthened its moats through:          3000
                                                                                                                                                                                40
     a.   Optimising its hub and spoke retail network – Using tech              2000
          investments in store level data collection, Dr. Lal Pathlabs is                                                                                                       20
          leveraging on its 15 years learning curve to optimise the             1000
          location, size and supply chain infrastructure of its CCs and labs.        0                                                                                          0
     b.   Timely report generation – With complete ownership or                                FY15     FY16         FY17           FY18      FY19        FY20      FY21
          control on lab technicians, sample handling toolkits, CCs, PUPs
          and labs, Dr. Lal differentiates against its competitors in the                  PSCs (LHS)         No. of patients (mn.) (RHS)            No. of tests (mn.) (RHS)
          timeliness of its report generation.                                  Source: Marcellus Investment Managers; Ace Equity
     c.   Extending home collections to smaller cities – During the
          COVID-19 crisis, Dr. Lal has significantly invested in home                                                                                                      6-year
          collections infrastructure in smaller cities, which is helping it           Rs mn           FY15      FY16      FY17        FY18     FY19       FY20    FY21
                                                                                                                                                                           CAGR
          gain substantial market share from both org as well as unorg.
          competitors.                                                              Revenues          6,596     7,913     9,124      10.569   12,034     13,304   15,813    16%
     d.   Disciplined capital allocation – Diagnostic labs industry is ripe
          for consolidation as pan-India firms gain share from mom-and-              EBITDA           1,551     2,077     2,375       2,640    2,936     3,436    4,363     19%
          pop labs. Dr. Lal currently has more than 750 crores worth of
          surplus capital on its balance sheet. Over the past 5 years,                   PAT          964       1332      1556        1718     2004       2276    2965      21%
          capital allocation towards acquisitions has been prudently done
          in a bolt on manner.                                                         RoCE
                                                                                                      49%       47%         43%       38%      35%        32%      35%
                                                                                     (pre tax)
     NOTE: Dr. Lal Pathlabs forms a part of most of Marcellus’ portfolios             Net
                                                                                                      -0.55     -0.54     -0.58       -0.58    -0.71     -0.71    -0.79
                                                                                   debt/Equity

                                                                                Source: Marcellus Investment Managers; Ace Equity
Private & Confidential                                                                                                                                                              27
FY14-19: HIGH QUALITY STOCKS WERE IN VOGUE
  PE Multiples for FY14 and FY19 and EPS and Share Price CAGR from FY14 to FY19                                                                                              • BSE100 index delivered
                        PE - FY14   PE - FY19 EPS CAGR (FY14-19) Share price CAGR (FY14-19)                                                                                    earnings CAGR of 4%, but
  BSE100                   18          26                4%      Alpha in       12%                                                                                            underwent       a      50%
  Asian Paints Ltd         43          66               12%      EPS  =         22%
                                                                 alpha in                                                                                                      expansion in its P/E
  HDFC Bank Ltd            21          28               18%      share prices   25%
                                                                                                                                                                               multiple from 18x to 26x
  Source: Ace Equity, Marcellus Investment Managers

  Correlation between relative share price performance with starting PE and EPS CAGR                                                                                         • Despite it being a phase of
                                              70%                                                                                          70%                                 significant P/E expansion
                                              60%                     R² = 0.02%                                                                               R² = 31.81%     for the index, share price

                                                                                          FY14-FY19 share price CAGR (relative to
                                                                                                                                           60%
    FY14-FY19 share price CAGR (relative to

                                              50%
                                                                                                                                                                               outperformance         was
                                                                                                                                           50%
                                                                                                                                                                               driven by earnings growth
                                              40%                                                                                          40%

                                              30%                                                                                          30%

                                                                                                         BSE100)
                   BSE100)

                                              20%                                                                                          20%

                                              10%                                                                                          10%

                                               0%                                                                                           0%
                                                     -             50               100                                             -50%          0%       50%        100%
                                              -10%                                                                                         -10%

                                              -20%                                                                                         -20%

                                              -30%                                                                                         -30%
                                                         Starting PE Ratio (FY14)                                                           FY14-FY19 Earning CAGR

  Source: ACE Equity, Marcellus Investment Managers;
  Correlation analysis has been done for the constituents of today's BSE100 index companies, hence companies
  which were unlisted at the start of the period are excluded;
  Companies with negative EPS or where EPS isn't available in the start or end period have been excluded;
  Companies with EPS CAGR >100% or opening PE >100 have been excluded.

Private & Confidential                                                                                                                                                                                       28
FY04-08: CAPEX & INFRA BOOM
 PE Multiples for FY04 and FY08 and EPS and Share Price CAGR from FY04 to FY08                                                                                             • Earnings    growth    was
                       PE - FY04   PE - FY08   EPS CAGR (FY04-08) Share price CAGR (FY04-08)
                                                                                                                                                                             broad based with only a
 BSE100                   16          20               22%      Alpha in       29%
                                                                EPS  =
                                                                                                                                                                             narrow     gap    between
 Asian Paints Ltd         20          28               30%      alpha in
                                                                               41%
 HDFC Bank Ltd            21          29               26%      share prices   37%                                                                                           quality stocks & not-so-
 Source: Ace Equity, Marcellus Investment Managers                                                                                                                           quality    stocks.    P/E
                                                                                                                                                                             expanded at modest pace.
 Correlation between relative share price performance with starting PE and EPS CAGR
                                     120%                                                                                             120%                                 • Despite it being a phase of

                                                                                            FY04-FY08 share price CAGR (relative to
                                     100%
                                                                          R² = 0.52%
                                                                                                                                      100%                   R² = 39.64%     broad-based        earnings
   FY04-FY08 share price CAGR (relative to

                                             80%
                                                                                                                                                                             growth,     share      price
                                                                                                                                      80%
                                                                                                                                                                             outperformance          was
                                             60%                                                                                      60%
                                                                                                                                                                             driven by earnings growth

                                                                                                           BSE100)
                                             40%
                                                                                                                                                                             rather than starting P/E
                  BSE100)

                                                                                                                                      40%
                                             20%
                                                                                                                                      20%
                                             0%
                                                   -       20           40             60                                              0%
                                        -20%                                                                                   -50%          0%   50%     100%      150%
                                                                                                                                      -20%
                                        -40%
                                                                                                                                      -40%
                                        -60%
                                                       Starting PE Ratio (FY04)                                                       -60%
                                                                                                                                         FY04-FY08 Earning CAGR
 Source: ACE Equity, Marcellus Investment Managers;
 Correlation analysis has been done for the constituents of today's BSE100 index companies, hence companies
 which were unlisted at the start of the period are excluded;
 Companies with negative EPS or where EPS isn't available in the start or end period have been excluded;
 Companies with EPS CAGR >100% or opening PE >100 have been excluded.

Private & Confidential                                                                                                                                                                                      29
FY94-04: P/E MULTIPLES HAVE HALVED
 PE Multiples for FY94 and FY04 and EPS and Share Price CAGR from FY94 to FY04
                       PE - FY94   PE - FY04   EPS CAGR (FY94-04) Share price CAGR (FY94-04)                                                                                   • BSE100      underwent   a
 BSE100                   47          16               17%                     5%                                                                                                massive compression in
 Asian Paints Ltd         38          20               19%      Alpha in       12%
 HDFC Bank Ltd**          32          21               43%
                                                                EPS =
                                                                               35%
                                                                                                                                                                                 P/E from 47x to 16x. This
                                                                alpha in
 ITC Ltd                  40          16               23%      share
                                                                prices
                                                                               12%                                                                                               P/E compression was
 Nestle Ltd*              64          22               20%                     8%
 Source: Ace Equity, Marcellus Investment Managers; *Period considered is from CY94 to CY04; **Starting PE
                                                                                                                                                                                 broad based including
 multiple is from FY96 and EPS and Share Price CAGR is for 8 years from FY96 to FY04.                                                                                            quality stocks also
Correlation between relative share price performance with starting PE and EPS CAGR
                                            60%                                                                                   60%                                          • Despite it being a phase of
                                                                                                                                                                                 significant              P/E

                                                                                        FY94-FY04 share price CAGR (relative to
  FY94-FY04 share price CAGR (relative to

                                            50%                          R² = 0.45%                                               50%                            R² = 75.52%
                                                                                                                                                                                 compression, share price
                                            40%                                                                                   40%                                            outperformance          was
                                                                                                                                  30%
                                                                                                                                                                                 driven by earnings growth
                                            30%

                                                                                                       BSE100)
                 BSE100)

                                                                                                                                                                                 rather than starting P/E
                                            20%                                                                                   20%

                                            10%                                                                                   10%

                                            0%                                                                                    0%
                                                  -   20    40      60     80     100                                                   0%     20%     40%      60%    80%
                                       -10%                                                                                  -10%

                                       -20%           Starting PE Ratio (FY94)                                               -20%            FY94-FY04 Earning CAGR

Source: ACE Equity, Marcellus Investment Managers;
Correlation analysis has been done for the constituents of today's BSE100 index companies, hence companies
which were unlisted at the start of the period are excluded;
Companies with negative EPS have been excluded;
Companies with EPS CAGR >100% or opening PE >100 have been excluded;
For 5 companies EPS from FY95 and EPS CAGR for 9 years have been taken due to non-availability of data.

Private & Confidential                                                                                                                                                                                          30
FY04-19: THE LONG TERM STORY
 PE Multiples for FY04 and FY19 and EPS and Share Price CAGR from FY04 to FY19                                                                                                         • On a long-term period
                       PE - FY04   PE - FY19   EPS CAGR (FY04-19) Share price                                                                                     CAGR (FY04-19)
                                                                                                                                                                                         covering     the   different
 BSE100                   16          26               10%                                                                                                        14%
 Asian Paints Ltd         20          66               20%
                                                                Alpha in EPS = alpha in
                                                                share prices                                                                                      30%                    market phases, it is the
 HDFC Bank Ltd            21          28               23%                                                                                                        26%                    earnings growth which
 ITC Ltd                  16          29               14%                                                                                                        19%                    drives the returns
 Nestle Ltd*              25          67               13%                                                                                                        20%
 Source: Ace Equity, Marcellus Investment Managers; *Period under consideration is from CY03 to CY18
                                                                                                                                                                                       • 70% of the index returns is
 Correlation between relative share price performance with starting PE and EPS CAGR                                                                                                      explained by earnings &
                                              40%
                                                                             R² = 0.45%                                                           40%                    R² = 66.31%     less than 30% by P/E
                                                                                                                                                                                         expansion

                                                                                               FY04-FY19 share price CAGR (relative to
    FY04-FY19 share price CAGR (relative to

                                              30%                                                                                                 30%

                                                                                                                                                  20%
                                              20%
                                                                                                                                                  10%

                                                                                                              BSE100)
                   BSE100)

                                              10%
                                                                                                                                                   0%
                                                                                                                                         -20%   -10%  0%    10%   20%     30%   40%
                                               0%                                                                                                -10%
                                                     -           20          40           60
                                                                                                                                                 -20%
                                              -10%

                                                                                                                                                  -30%
                                                         FY04 Price to Earnings Ratio                                                           FY04-FY19 Earning CAGR
                                              -20%
 Source: ACE Equity, Marcellus Investment Managers;
 Correlation analysis has been done for the constituents of today's BSE100 index companies, hence companies
 which were unlisted at the start of the period are excluded;
 Companies with negative EPS or where EPS isn't available in the start or end period have been excluded;
 Companies with EPS CAGR >100% or opening PE >100 have been excluded.

Private & Confidential                                                                                                                                                                                                  31
DISCLAIMER

                 "This document has been made available solely for informational purposes and is for private
                 circulation only. Neither the transmission of this document nor the transmission of any
                 information contained herein is intended to create, and receipt hereof, does not constitute
                 formation of any relationship between Marcellus Investment Managers Private Limited
                 (“Marcellus”) and the recipient and shall not entitle the recipient to circulate, share or rely upon
                 the information contained herein for any other purpose other than the limited intended purpose
                 only. Marcellus disclaims any and all liability arising from actions taken or omitted to be taken
                 based on the contents herein."

Private & Confidential                                                                                                  32
You can also read