ING Credit Update 1Q2020 - ING Investor Relations 8 May 2020
←
→
Page content transcription
If your browser does not render page correctly, please read the page content below

ING Credit Update 1Q2020

ING Investor Relations
8 May 2020
Key points

▪ In line with our purpose, we take actions to support our customers, employees and society in coping with the impact
  of the Covid-19 pandemic. In many countries we are working with governments to provide our retail and wholesale
  banking customers with the necessary financial flexibility, while ensuring we continue to play the vital role banks
  have in society, providing key banking services throughout our network
▪ The strength of our digital business model is proven, with stable NII, accelerating fees, cost control and absorbing the
  new Definition of Default impact on capital
▪ Net core lending growth was €12.3 bln, primarily in Wholesale Banking, which was up by €9.4 bln
▪ Pre-provision results were solid, supported by disciplined pricing, higher fee income and cost control. This was partly
  countered by margin pressure on customer deposits and negative marked-to-market results reflecting Covid-19
  related market volatility at the end of March
▪ Risk costs increased, driven by €247 mln of collective Stage 2 provisioning, reflecting the potential macro-economic
  impact of the Covid-19 pandemic and low oil prices
▪ 1Q2020 CET1 ratio was 14.0%, with capital negatively impacted by market volatility at the end of March (~40 bps)
  and having fully absorbed €9.9 bln of RWA impact related to the new Definition of Default
▪ The Covid-19 pandemic will have further impact in the coming quarters. The level of impact will depend on several
  factors including how long lockdown measures will remain in place, how effective government support schemes to
  mitigate the economic impact will be and how quickly the global economy will recover
▪ We are in a good position to face a change in the cycle with a robust capital position, a strong funding structure and
  a very low Stage 3 ratio
                                                                                                                             2
Our priority is to support employees, customers and society to deal
with the impact of the Covid-19 pandemic
Our employees Our private customers Our business customers Our society
▪ Smooth transition to ▪ Part of our branch ▪ Pro-actively contacting ▪ Matching employee
working from home network remains open our business donations to charities
(WFH), which now to support customers customers to discuss ▪ Working with Unicef to
applies to around 80% to make the move to the potential impact raise funds for medical
of our employees digital banking ▪ Extensions of loan equipment
▪ Providing tools and ▪ In all countries repayments for SME ▪ Donating laptops to
guidance to enable measures are taken to customers enable home schooling
WFH and support support private ▪ Providing credit
employees with WFH customers impacted ▪ Offering building space
facilities under to be used as a
challenges by the Covid-19 government guarantee
pandemic with temporary hospital
▪ Adjusted opening schemes
hours of our branches extensions of loan
repayments ▪ Tailored solutions for
and precautionary larger corporate clients
measures to ensure ▪ Supporting safe
employees can work payment behavior by
safely Increasing the limit for
contactless payments
Support provided year-to-date
▪ 100,000 payment holidays for customers granted
▪ €5.6 bln liquidity provided under credit facilities for large corporate clients
3Our digital and agile capabilities enabled uninterrupted customer
service
% of mobile-only active customers who contact us* % mobile in interactions with ING
CAGR +41%** CAGR +36%***
37% 37% 86%
82%
26%
19% 73%
12% 63%
52%
2016 2017 2018 2019 1Q2020 2016 2017 2018 2019 1Q2020
2.5 3.0 3.7 4.5 1.3
Number of total interactions with ING (in bln)
Annual mobile non-deposit sales per 1,000 active customers Proofpoints
▪ Strong growth of mobile sales
84 ▪ 170,000 new Investment accounts opened in March and April
CAGR +75%
62
46
▪ Over 100,000 customer requests related to payment
28 holidays and government guarantee schemes processed and
9 approved
2016 2017 2018 2019 1Q2020
annualised
* Definition: Retail customers who used the channel at least once in the last quarter
** CAGR for number of mobile-only customers among active customers who contact us; for 1Q2020 based on an annualised number of interactions
*** CAGR for number of mobile interactions with ING 4We have built a resilient bank through our focus on primary
customers and income diversification
Total income** geographically
Retail income* increasingly more diversified, with growth in
Our primary customer base diversified across products C&GM
25.4% 26.7% 29.2% 30.5% 32.8% 34.3% Δ € CAGR) Δ € CAGR)
17.8
>16.5 15.8 13% +2%
13%
13.3 9.3 17% +8%
12.5 8.2 +11% 13%
11.4 1.5 8% +7%
10.4 0.9 6%
9.2 1.1 1.4 +5% 11% 15% +8%
8.4
2.7 3.3 +4% 20% 17% -1%
3.5 35% 30% -1%
3.1 -2%
2014 2015 2016 2017 2018
2019 Ambition 2014 2019 2014 2019
2022
Primary as a % of total retail customers Net fee and commission income Diversified Netherlands
Non-mortgage lending NII income BeLux
Mortgage NII Germany
Liability NII OC&GM – eurozone
OC&GM – non-eurozone
WB Rest of World
Note: ING financials are based on reported underlying results; as per 1Q2020, key figures are based on IFRS results as adopted by the European Union (IFRS-EU)
* Excluding SME/mid-corporates, Asian bank stakes and Bank Treasury
** Excluding Corporate Line and the Real Estate run-off portfolio; % in 2014 adds up to 98% due to rounding 5We have maintained cost discipline, while managing KYC-related
expenses, regulatory costs and ATF investments
We managed our underlying costs Leading to a best-in-class cost/income ratio in the eurozone
Underlying costs (in € bln)
CAGR +20.1% 67.9%
66.9%
66.1%
CAGR +1.7%
64.0% 64.3% 64.5%
1.0
0.9 0.9
0.4 0.6 0.8
58.7%
56.6%
8.9 9.0 9.3 55.9% 55.5%
8.6 8.6 8.6
54.8%
54.2%
2014 2015 2016 2017 2018 2019 2014 2015 2016 2017 2018 2019
Underlying expenses (excl. regulatory costs) Regulatory costs ING Average eurozone peers
Note: ING financials are based on reported underlying results; as per 1Q2020, key figures are based on IFRS results as adopted by the European Union (IFRS-EU)
6Low risk costs compared to eurozone peers and a low Stage 3 ratio
Risk costs / average customer lending (in %) Stage 3 ratio**
1.4%
6.1%
1.2% 5.4%
1.0% 4.7%
3.9%
0.8% 3.4%
4.3%
4.0%
0.6% 3.5%
3.0% 2.9%
0.4% 2.5% 2.6%
2.1% 1.9%
0.2% 1.5% 1.4%
0.0%
2008 2009 2010 2011 2012 2013 2014 2015 2016 2017 2018 2019 2014 2015 2016 2017 2018 2019
ING ING
Eurozone average Eurozone average
Higher or equally rated peers* Higher or equally rated peers*
ING through-the-cycle average
Source: Bloomberg 7 February 2020, Annual disclosures
* Higher or equally rated peers by one or more of the main 3 credit rating agencies
** NPL-ratio for the period 2014-2016, Stage 3 ratio from 2017 on; comparable average for 2014 not available as several peers did not report NPL-ratio for 2014 7We have a robust capital position with a strong funding structure
Capital development since 2015 Balance sheet ING Group (in € bln)
Balance sheet size ING Group 31 December 2019: €892 bln
5.9% -3.3%
Other 15 55 Total equity
88 Cash balances Other 15
-1.4%
with central 35 Deposits from
0.5% 14.6% banks and loans banks
-1.6% 1.7% Financial 96 to banks
assets at FVPL Wholesale 135
funding
12.7% 81 Financial assets
at FVOCI / 78 Financial
securities at liabilities at
amortised cost FVPL
Loans to
customers 612 Customer 574
deposits
2015 Net Dividend Model, Volume Risk FX 2019 Assets Own Funds
result paid methodo- growth migration impact & Liabilities
logy and & Other
policy
changes
8Business profile and strategy
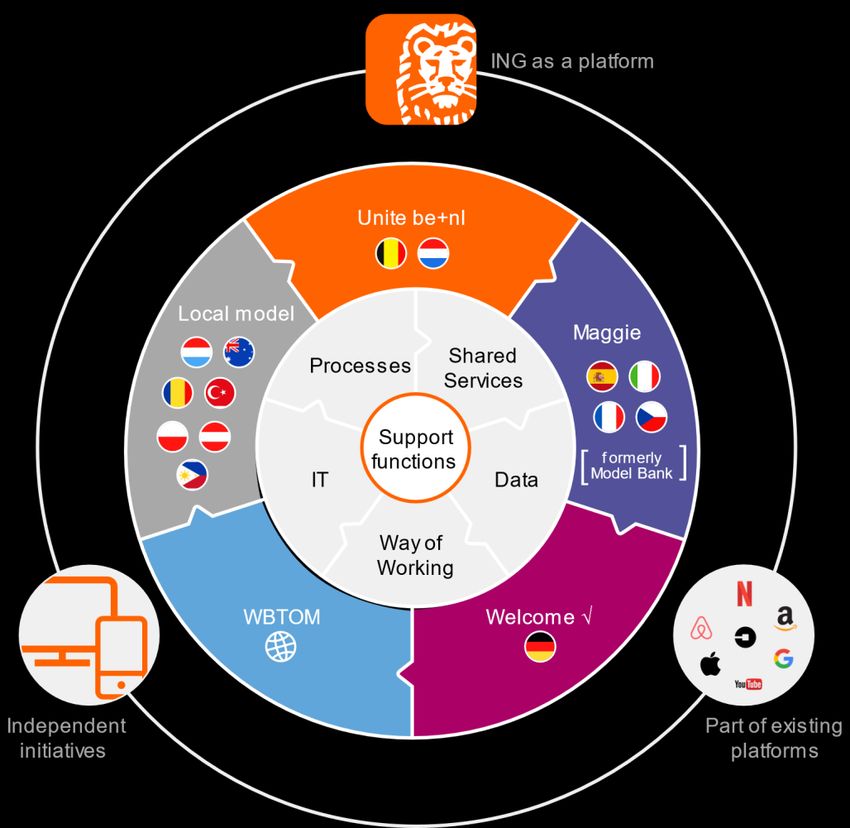
9Think Forward has been accelerated through structural changes Think Forward strategy on a page Transformation and platform programmes * Formely Model Bank 10
We are transforming into a dynamic digital player

                 Classic bank                            Dynamic digital player                       Digital DNA and experience creating
                                                                                                      cross-border scalability are
  Customers      • Mature, established                   • Explorers, change-oriented
                                                                                                      advantages
   Products      • Owned                                 • Open architecture where relevant
   Strategy      • Defensive, cost efficiency-focused    • Offensive, differentiation-focused         20+ years of experience as direct
                                                                                                      banking pioneer
   Time-to-      • Long                                  • Short
    volume
  Footprint      • Regional                              • Global                                     1st bank to implement agile way of
                                                                                                      working
                 • Branches                              • Mobile/digital applications
                 • Relationship managers                 • Customer service teams
  Resources
                 • Tailored, country-specific, legacy
                   systems
                                                         • Modular, scalable, cutting-edge
                                                           systems
                                                                                                      200+ fintechs we founded, partnered
                                                                                                      with and invested in
                                                         • Diversified, incl. directly from third
Funding source • Depositors                                parties
  Fee model      • Multiple (high) fees (under threat)   • Relationship contribution fee
Well-diversified business mix with many profitable growth drivers
Retail Banking Market Leaders Wholesale Banking
Netherlands,
• Focus on earning the Belgium / Luxembourg • Our business model is
primary relationship similar throughout our
• We use technology to offer global WB franchise of more
a differentiating experience Challengers than 40 countries
to our customers Australia, Czech Republic, Wholesale Banking • With a sector and client-
France, Germany / Austria, International Network driven strategy, our global
• Distribution increasingly Italy, Spain
through mobile devices franchises serve corporates,
which requires simple multinational corporations,
product offering Growth Markets financial institutions,
Philippines, Poland, Romania, governments and
Turkey, Asian bank stakes supranational bodies
Total income* Total income* RWA (end of period)*
1Q2020 1Q2020 1Q2020
13%
21% 24%
29% 30%
13%
€4.4 €4.4 €333
bln bln 13% bln
12%
18%
71% 16% 11%
15% 14%
Retail Banking
Wholesale Banking Netherlands Belgium Germany Other Challengers Growth Markets WB Rest of World
* Segment “Other" not shown on the slide. For this segment (Corporate Line and Real Estate run-off portfolio), the total income was €79 mln in 1Q2020 and RWA was €2.7 bln as per
31 March 2020 12Consistent focus on creating operating leverage
Roadmap from current market positions
Retail Challengers
Retail Benelux & Growth Markets Wholesale Banking Financial ambitions
Focus on profitable
Income lending and fee
income
Cost discipline focus;
Costs some increases in
markets that grow
Efficiency
Scalability Efficiency Scalability Growth RWA optimisation
and ROE focus
131Q2020 results
14Solid pre-provision result reflects discipline in lending margins and
fee growth
Pre-provision result excl. volatile items and regulatory costs
Income (in € mln) (in € mln)
4,576 4,665 4,626 4,439 4,511 12
96 113
2,208 2,198 2,281 2,214 2,329
-147 -125
1Q2019 2Q2019 3Q2019 4Q2019 1Q2020 1Q2019 2Q2019 3Q2019 4Q2019 1Q2020
Volatile items
Pre-provision result excl. volatile items and regulatory costs
▪ Income was €65 mln lower compared to 1Q2019 despite higher fee income, increased Treasury-related income and discipline in
lending margins. This increase in income was more than offset by negative fair value adjustments, while 1Q2019 included a €119 mln
one-off gain from the release of a currency translation reserve
▪ Sequentially, income was €72 mln higher as higher Treasury-related income and increased fee income more than offset lower interest
results, which included some one-offs in the previous quarter
▪ 1Q2020 pre-provision result excluding volatile items and regulatory costs, was €2,329 mln, up 5.5% from a year ago, driven by higher
income (after excluding volatile items)
▪ Compared to the previous quarter, pre-provision result excluding volatile items and regulatory costs, increased by 5.2%, as both
income and costs improved
15Stable NII year-on-year; 4-quarter rolling NIM at 154 bps
Net interest income excl. Financial Markets (FM) (in € mln) Net Interest Margin (in bps)
3,435 3,478
3,391 3,391 3,399 157
155 154 154 154
154 152 154 154
151
1Q2019 2Q2019 3Q2019 4Q2019 1Q2020 1Q2019 2Q2019 3Q2019 4Q2019 1Q2020
NIM NIM (4-quarter rolling average)
▪ Net interest income, excluding Financial Markets, increased 0.2% compared to 1Q2019. NII increased in Retail Banking, driven by
higher interest results related to Treasury and customer lending, which was only partly offset by continued pressure on customer
deposit margin
▪ Sequentially, NII excl. FM decreased 2.3%, driven by lower interest results in Wholesale Banking, which included some one-offs in the
previous quarter. In Retail Banking higher interest results on mortgage lending were offset mainly by pressure on customer deposit
margin
▪ NIM was 151 bps, down six basis points from 4Q2019. This was mainly attributable to an increase in the balance sheet and lower
(volatile) interest results in Financial Markets, combined with lower lending margins on non-mortgage lending and customer deposits
161Q2020 net core lending driven by Wholesale Banking
Customer lending ING Group 1Q2020 (in € bln)
Core lending businesses: €12.3 bln
7.6 -4.5
11.2 -2.0 0.2 -0.3 631.6
616.4 -0.1 1.1 0.6 1.3
31/12/2019 Retail Retail Retail Retail WB Lending WB Daily WB Other* Lease run- Treasury FX / Other** 31/03/2020
NL Belgium Germany Other Banking & off / WUB
C&GM Trade run-off
Finance
▪ Our core lending franchise grew by €12.3 bln in 1Q2020
▪ Retail Banking increased by €2.9 bln, of which €0.7 bln in mortgages and €2.2 bln in other lending with growth in most countries
▪ Wholesale Banking increased by €9.4 bln, mainly in Lending, driven by increased utilisation of revolving credit facilities to secure
liquidity in the context of economic uncertainty due to the Covid-19 pandemic, and decline in Daily Banking & Trade Finance,
predominantly in Trade & Commodity Finance, reflecting lower average oil prices
▪ Net customer deposits increased by €9.2 bln
* WB Other includes Financial Markets 17
** FX impact was €-4.8 bln and Other €0.3 blnStrong growth of fee income driven by investment and daily
banking products
Net fee and commission income* (in € mln) ▪ Fees increased by €108 mln compared to 1Q2019, or 16.0%.
This was driven by higher fees on investment and daily
banking products in Retail Banking, predominantly in
+16.0%
Germany and Belgium. Fee income in Wholesale Banking
747 783
711 735 also increased, primarily in Lending and Financial Markets
675 14
290 280 303
297 ▪ Sequentially, fee income was €48 mln higher, or 6.5%, due to
262
the aforementioned increase in fee income in Retail Banking.
159 176 180 176 210 In Wholesale Banking fees were slightly lower, due to lower
fee income in Trade & Commodity Finance, mainly due to
256 262 274 256 277
lower average oil prices, and lower deal activity in Corporate
-14
Finance
1Q2019 2Q2019 3Q2019 4Q2019 1Q2020
Retail Benelux Retail C&GM
Wholesale Banking Intra-year FM adjustment*
* In 3Q2019, an increase in fees of €14 mln in Wholesale Banking was caused by the reclassification of commissions paid in 2Q2019 to Other Income 18FM impacted by valuation adjustments reflecting Covid-19 related
market volatility
Income Financial Markets (in € mln) ▪ Excluding valuation adjustments, FM income was €8 mln
lower YoY, mainly due to losses in Credit Trading following an
254 255 257 246
221 abrupt downward market movement. Other FM segments
benefitted from market volatility, resulting in €25 mln higher
income QoQ
▪ Net valuation adjustments in FM were €-92 mln. This was
driven by funding valuation adjustments, marked-to-market
-25
-58 -72 -74 of our derivatives portfolio and Fair Value Adjustments
-92
reflecting increased bid-offer spreads. These negative
1Q2019 2Q2019 3Q2019 4Q2019 1Q2020
impacts were partly offset by positive movements, mainly
Client income excl. valuation adjustments Valuation adjustments driven by our own hedged positions
iTraxx main Europe CDS-Bond Basis (in bps)
0
-25
-50
-75
-100
01/01/2020 01/02/2020 01/03/2020 01/04/2020 04/05/2020
01/05/2020
19Cost measures partially absorbed elevated KYC and regulatory costs
Expenses (in € mln) Cost/income ratio**
515 97 106 303 526 60.9% 62.8%
98 151 59.0% 60.3%
74 127 138
55.7%
59.0% 52.5%
52.7% 56.6% 57.0%
2,198 2,256 2,207 2,221 2,169 53.7% 53.7%
50.3% 51.0% 51.3%
1Q2019 2Q2019 3Q2019 4Q2019 1Q2020 1Q2019 2Q2019 3Q2019 4Q2019 1Q2020
Regulatory costs* Cost/income ratio
KYC related costs Cost/income ratio (4-quarter rolling average)
Expenses excl. KYC and regulatory costs Cost/income ratio excl. regulatory costs (4-quarter rolling average)
▪ Expenses excl. KYC and regulatory costs were €29 mln lower YoY, as cost savings and some one-offs, including a VAT refund in the
Corporate Line, offset CLA-related salary increases
▪ Sequentially, expenses excl. KYC and regulatory costs were €52 mln lower, mainly driven by lower expenses related to staff and
marketing in Retail Banking as well as continued cost-efficiency measures
▪ Regulatory costs were €11 mln higher YoY and €223 mln QoQ. The sequential increase was driven by annual contributions to the
Single Resolution Fund and several local Deposit Guarantee Schemes, which are due in the first quarter of each year. This also applies
to the annual Belgian bank tax, while 4Q2019 included the annual Dutch bank tax
* Formal build-up phase of Deposit Guarantee Schemes (DGS) and Single Resolution Fund (SRF) should be completed by 2024
** As per 1Q2020, key figures are based on IFRS results as adopted by the European Union (IFRS-EU) and not on underlying anymore. Historical key figures have been adjusted 20Risk costs impacted by collective Stage 2 provisioning related to
Covid-19 pandemic
Risk costs per stage (in € mln) Stage 2 ratio Stage 3 ratio
661 7.5%
6.6% 6.3%
261 6.2%
428 7.0% 5.7%
5.9%
25 18 6.2% 1.8%
276 5.6% 5.4% 5.3% 5.6% 1.6% 1.6% 1.6% 1.6%
209
207 6
2 26 4.6%
3 398 422 3.9% 4.1% 1.5% 1.5% 1.6%
285 1.5%* 1.4%
219 245 1.4%
1.3% 1.3%*
1.2% 1.2%
-17 -57 -9 -6 -13 -26
1Q19 2Q19 3Q19 4Q19 1Q20 1Q19 2Q19 3Q19 4Q19 1Q20 1Q19 2Q19 3Q19 4Q19 1Q20
Stage 3 Stage 2 Stage 1 Off-balance ING Wholesale Banking Retail Banking
▪ 1Q2020 risk costs were €661 mln, or 42 bps of average customer lending, above the through-the-cycle average of approx. 25 bps
▪ Higher risk costs were driven by €247 mln of collective Stage 2 provisions, reflecting both worsened macro-economic indicators and
the potential impact from low oil prices. These factors also resulted in an increase in Stage 2 credit outstandings, mainly within WB,
which resulted in a higher Stage 2 ratio of 5.9%
▪ Stage 3 provisions included several larger individual additions on both existing and new files for WB, mainly in the Americas and Asia,
and mid-corporates in Belgium. In C&GM higher collective provisions were visible, mainly in Poland, Romania, Italy and Australia
▪ The Stage 3 ratio increased to 1.6%, with the implementation of the new Definition of Default (DoD) impacting Retail Banking, while
the Stage 3 ratio in WB remained low at 1.2%
▪ See Appendix section of the presentation for further details on asset quality in selected portfolios
* Stage 3 credit-impaired as per 30 September 2019 adjusted downwards by €548 mln 21Higher risk costs mainly visible in Stage 2
Retail Banking Wholesale Banking
Risk costs per stage (in € mln) Risk costs per stage (in € mln)
285 373
1
98
254 163
174
160 3 15
136 118 52
4 8
91 116
200 201
184 71 18 10 8 198 221
136 145 5
83 100 101
-0 -4 -2 -16 -26 -2 -4 -11 -13
-31 -2 -19 -2 -2 -27 -16
1Q19 2Q19 3Q19 4Q19 1Q20 1Q19 2Q19 3Q19 4Q19 1Q20
Stage 3 Stage 2 Stage 1 Off-balance sheet Stage 3 Stage 2 Stage 1 Off-balance sheet
▪ The increase in risk costs was mainly driven by €247 mln collective Stage 2 provisions:
▪ €206 mln in the segments reflecting the worsened macro-economic indicators due to the economic impact of lockdown measures
related to the Covid-19 pandemic, allocated to the segments with RB Benelux €45 mln, Retail C&GM €47 mln and WB €114 mln
▪ €41 mln in WB reflecting increased risk in the US-based reserve-based lending book due to the sharp decline in oil prices
22We remain comfortable with the quality of our book, which is
almost fully senior and well-collateralised
Residential
▪ Average LTV of 60% with low Stage 3 ratio at 1.1%
Mortgages
▪ Risk metrics remain strong, also supported by government schemes
€298 bln
5%
Consumer
▪ Relatively small book, mainly related to car loans
Lending
▪ Risk metrics slightly deteriorated, however primarily due to implementation of new DoD
42% €26 bln
36% €710
bln ▪ No increased usage of limits observed, limited exposure to sectors most at risk:
Business
▪ Agriculture: €5.7 bln (0.8% of loan book), Stage 3 ratio at 6.3%
Lending
▪ Retail: €4.7 bln (0.7% of loan book), Stage 3 ratio at 6.0%
€91 bln
13% 4% ▪ Hospitality: €3.2 bln (0.4% of loan book), Stage 3 ratio at 2.9%
▪ Elevated drawings of facilities have normalised, limited exposure to sectors most at risk:
Residential mortgages ▪ Leveraged Finance: €8.4 bln (capped at €9.6 bln), well-diversified over sectors
Consumer Lending Wholesale
Banking ▪ Oil & Gas: €4.6 bln with direct exposure to oil price risk (0.6% of loan book; Reserve
Business Lending based lending (€3.6 bln) and Offshore business (€1.0 bln))
€260 bln
Wholesale Banking ▪ Aviation: €2.9 bln (0.4% of loan book), large share ECA cover, low Stage 3% at 0.04%
Other* ▪ Hospitality: €1.7 bln (0.2% of loan book), low Stage 3% at 0.2%
Commercial ▪ Total €51.6 bln (7.3% of loan book), booked in RB and WB
Real Estate ▪ Well-diversified capped loan book with 18% in retail-related real estate
(RB + WB) ▪ LtV at 50% and low Stage 3% at 0.9%
* Other includes €16 bln Bank Treasury and €19 bln Other Lending 23ING Group financial ambitions
Actual 2019 Actual 1Q2020 Financial ambitions
~13.5%*
▪ CET1 ratio (%) 14.6% 14.0% (Basel IV)
Capital
▪ Leverage ratio (%) 4.6% 4.3% >4%
▪ ROE (%)**
9.4% 8.4% 10-12%
(IFRS-EU Equity)
Profitability
▪ C/I ratio (%)** 56.6% 57.0% 50-52%
Dividend payments suspended
Dividend ▪ Dividend (per share) €0.24***
until October 2020
* Implies management buffer (incl. Pillar 2 Guidance) of ~300 bps over prevailing fully-loaded CET1 requirements (10.51% fully loaded, after reduction of several buffers in a response to
the Covis-19 pandemic and the pulling forward of the implementation of article 104a of CRDV)
** Based on 4-quarter rolling average. ING Group ROE is calculated using IFRS-EU shareholders’ equity after excluding ‘interim profit not included in CET1 capital’. As at 31 March 2020,
interim profit not included in CET1 capital amounts to €1,754 mln, reflecting an initial reservation for the 2019 final dividend payment, which was suspended until at least 1 October 2020
*** Interim dividend 2019 24Asset quality
25Well-diversified lending credit outstandings by activity
ING Group* Retail Banking* Wholesale Banking*
1Q2020 1Q2020 1Q2020
8% 7% 4% 4%
37% 25%
15% 25%
20%
€710 €450 4% €450 €260
bln bln bln bln
6% 10%
17%
63% 66% 9% 67%
13%
Retail Banking Residential mortgages Mortgages Netherlands Lending
Wholesale Banking Consumer Lending Other lending Netherlands Daily Banking & Trade Finance
Business Lending Mortgages Belgium Financial Markets
Other Lending** Other lending Belgium Treasury & Other
Mortgages Germany
Other lending Germany
Mortgages Other C&GM
Other lending Other C&GM
▪ ING has a well-diversified and well-collateralised loan book with a strong focus on own-originated mortgages and senior loans; 63% of
the portfolio is retail-based
Note: percentages for Retail (Netherlands) and Wholesale Banking have changed versus 4Q2018 as the Real Estate Finance portfolio related to Dutch domestic mid-corporates was
transferred to Retail Netherlands from Wholesale Banking as per 1Q2019
* 31 March 2020 lending and money market credit outstandings, including guarantees and letters of credit, but excluding undrawn committed exposures (off-balance sheet positions)
** Includes €16 bln Bank Treasury and €19 bln of Other Retail lending as per 1Q2020 26Detailed disclosure on selected countries
Selected countries (in € bln)
Lending credit Stage 2 ratio Stage 3 ratio Lending credit Stage 2 ratio Stage 3 ratio
O/S 1Q2020 1Q2020 1Q2020 O/S 4Q2019 4Q2019 4Q2019
France 9.6 6.1% 0.6% 8.8 3.0% 0.7%
Italy 16.0 4.5% 2.8% 16.5 4.1% 2.0%
Spain 25.9 1.9% 1.0% 25.5 1.6% 1.1%
USA 37.9 13.0% 1.3% 34.9 6.7% 1.3%
27Granular Retail Consumer Lending and Business Lending
Consumer Lending – 1Q2020 Lending Credit Outstandings Business Lending – 1Q2020 Lending Credit Outstandings
By geography By product By geography By sector
3% 2% 1%
4% 5% 5% 4% 1% 2%2% 3% 16%
3% 2%
5% 3%
7% 11%
35% 4%
5%
8% 4%
6% 49%
6% 14%
€26 bln €26 bln €91 bln €91 bln
7% 6%
76%
8% 31% 10%
9%
13%
12% 9% 9%
Germany Term Loan Belgium Real Estate
Spain Revolver Netherlands Services
Belgium Personal Loan Poland Food, Beverages & Personal Care
France Overdraft Turkey General Industries
Poland Other Australia Builders & Contractors
Netherlands Romania Chemicals, Health & Pharmaceuticals
Romania Other Transportation & Logistics
Italy Lower Public Administration
Turkey Retail
Other Automotive
Central Governments
Natural Resources
Media
Utilities
Non-Bank Financial Institutions 28
OtherGranular Wholesale Banking lending
Loan portfolio is well diversified across geographies… …and sectors
Lending Credit O/S Wholesale Banking (1Q2020)* Lending Credit O/S Wholesale Banking (1Q2020)*
1% NL 6% 10% Real Estate, Infra & Construction
8% Commodities, Food & Agri
19% Belux
12% Germany 22% TMT & Healthcare
14%
Other Challengers Transportation & Logistics
3% €260 5% €260 Energy
Growth Markets bln
bln UK Diversified Corporates****
8%
16% 12% European network (EEA**) Financial Institutions*****
European network (non-EEA) 17% 10% Other
2% 6%
9% 7% North America 13%
Americas (excl. North America)
Asia
Africa
Lending Credit O/S Wholesale Banking Asia (1Q2020)* Lending Credit O/S Wholesale Banking Americas (1Q2020)*
17% 22% Japan 13% United States
China*** 2% Brazil
2% Hong Kong 4% Canada
4% €51 Singapore 5% €50 Mexico
7% bln South Korea bln Other
12% 76%
Taiwan
India
20% 16%
Rest of Asia
* Data is based on country/region of residence; Lending and money market credit O/S, including guarantees and letters of credit but excluding undrawn committed exposures (off-
balance sheet positions); ** Member countries of the European Economic Area (EEA); *** Excluding our stake in Bank of Beijing (€1.7 bln at 31 March 2020); **** Large corporate clients
active across multiple sectors; ***** Including Financial sponsors 29Leveraged finance book managed within a restrictive framework
Business overview Leveraged finance book* focused on developed markets
▪ Focus on larger sponsors with an established track record (as per 1Q2020)
and a history of resolving issues in the event of 2%
underperformance by the acquired business
▪ Granular book of €8.4 bln as per 1Q2020
▪ Number of underwritten transactions in 2019 declined by 39% €8.4 bln
59% Americas
28% YoY, as a result of reduced market volume and our
EMEA
conservative stance on leverage
Asia
▪ There were supportive market conditions in the beginning of
the year, evidenced by a substantial increase in the number
Leveraged finance book* highly diversified by industry
of transactions. At the end of 1Q2020, we were able to (as per 1Q2020)
syndicate the vast majority of the underwritten amount, and
only 2 new transactions remained on our B/S for the full 14% Services
amount on 31 March 2020 1% 21% General Industries
4% Chemicals, Health & Pharmaceuticals
5% Food, Beverages & Personal Care
Main actions taken €8.4 bln
5% Retail
▪ Global cap of €9.6 bln Automotive
5% 18%
▪ Maximum final take for a single transaction €25 mln Builders & Contractors
11% Transportation & Logistics
▪ Maximum total leverage 6.5x 16% Non-Bank Financial Institutions
▪ No single underwrites Other
* Leveraged finance is defined as Private Equity driven leveraged finance with higher than 4x leverage. Leveraged finance book is total commitments (i.e. including undrawn) 30Well-diversified Commercial Real Estate (CRE) portfolio
Business overview
CRE breakdown by asset type (as per 1Q2020)
▪ CRE portfolio of €51.6 bln, cap at €56 bln, split between:
▪ Real Estate Finance (REF) €36.8 bln 3%
▪ Retail Banking €14.8 bln 25% Office
37% Retail
▪ REF portfolio is managed by Wholesale Banking, booked in
WB (€25.6 bln) and RB (€11.2 bln) based on client type €52 bln
Residential
▪ Retail Banking portfolio mainly in RB Benelux to companies Industrial
in the mid-corporates segment, generally professional Unclassified
investors with real estate portfolios rented to third parties 18%
Other
(mainly residential) and part construction finance to 5%
12%
professional parties within a strict risk appetite (>90%
residential development, minimum % of pre-sold units,
recourse on shareholders with stable cash flows) CRE breakdown by geography* (as per 1Q2020)
▪ Overall well diversified portfolio both in terms of geography
and asset type, with LtV of 50% and low Stage 3 ratio of
1% 8% Netherlands Belgium
0.9% 3%
3% Luxembourg France
▪ Portfolio is managed within risk appetite of global CRE 4% 36%
policy which includes focus on diversified portfolios (in 5% Australia US
principle no single tenants or objects), no hotels (only €52 bln Italy Spain
exception if small part of quality real estate portfolio) 6%
Germany UK
▪ In the current market most scrutiny on asset type Retail, 6%
Other
which is 18% of the total CRE book. We have a restrictive 8%
policy in place, with focus on supermarkets or smaller malls 20%
which include at least one supermarket
* Geographical split based on country of residence 31Oil & Gas book: only €4.6 bln directly exposed to oil-price risk
0.5 0.5
€4.6 bln Direct ▪ Smaller independent oil & gas producers, focus on 1st cost quartile
3.6 oil-price risk producers
6.0
▪ Typically assets generating revenues from long-term tariff based contracts,
O&G not affected by oil & gas price movements
companies
€14.4 bln ▪ Predominantly loans to investment grade large integrated oil & gas
6.1 companies
2.3 ▪ ECA-covered loans in oil & gas sector: typically 95%-100% credit insured
No direct
oil-price risk
Trade €15.7 bln ▪ Short term self-liquidating trade finance, generally for major trading
15.7
companies companies, typically pre-sold or price-hedged
Asset type
Trade Finance Export Finance
Overall Stage 3 ratio at 2.4%
Corporate Lending Midstream
Reserve Based Lending Offshore Drilling
Other Offshore Services
32Breakdown of quarterly risk costs Wholesale Banking
per geography and sector
Breakdown of geography which generated risk costs WB Breakdown of sector which generated risk costs WB
(in € mln) (in € mln)
373 373
254 254
116
116
71 91 71 91
1Q2019 2Q2019 3Q2019 4Q2019 1Q2020 1Q2019 2Q2019 3Q2019 4Q2019 1Q2020
NL Belux Collective Stage 2 provisions Non-Bank Financial Institutions
Germany/Austria UK Technology Telecom
Nordics + CH Rest of Europe Media Utilities
USA Latam
Retail General Industries
Asia RE & Other
Real Estate Chemicals, Health & Pharmaceuticals
Transportation & Logistics Automotive
Services Builders & Contractors
Natural Resources Food, Beverages & Personal Care
33Overview Turkey exposure
Total exposure ING to Turkey* (in € mln) Lending Credit O/S by currency
1Q2020 4Q2019 Change 2% 16%
Lending Credit O/S Retail Banking 4,242 4,537 -6.5%
USD
Residential mortgages 531 529 0.4% 36% EUR
TRY
Consumer lending 1,157 1,203 -3.8%
Other
46%
SME/Midcorp 2,554 2,804 -8.9%
Lending Credit O/S Wholesale Banking 6,019 6,079 -1.0%
Total Lending Credit O/S* 10,261 10,616 -3.3% Lending Credit O/S by remaining
maturity
TRY** ~1 year
▪ Intra-group funding reduced from €2.1 bln at end-4Q2019 to €1.8 bln at end-1Q2020 FX ~2 years
▪ Reduction of outstandings in 1Q2020 is partly due to Turkish lira depreciation
▪ ING only provides FX lending to corporate customers with proven FX revenues; only
Stage 3 ratio and coverage ratio
limited rolling-over of FX lending facilities
1Q2020 4Q2019
▪ ECA-insured lending (Export Credit Agencies) is approx. €1.7 bln; approx. €0.4 bln of
Stage 3 ratio 4.1% 4.3%
SME/Midcorp lending benefits from KGF cover (Turkish Credit Guarantee Fund)
Coverage ratio 53% 51%
▪ Quality of the portfolio remains relatively strong with a Stage 3 ratio of 4.1%
* Data based on country of residence. Lending credit outstandings, including guarantees and letters of credit, but excluding undrawn committed exposures (off-balance sheet positions)
** Excludes residential mortgages, which have an average remaining maturity of ~6 years 34Group capital, funding & liquidity
35ING Group Total capital ratio at 18.1% at the end of 1Q2020
ING Group Total capital ratio development
2.2% 18.1%
14.6% 0.2% -0.4% 1.9%
-0.4% 14.0%
~13.5%
10.5%
4Q19 Profit added Implementation RWA & other 1Q20 AT1 Tier 2 1Q20 Total Basel IV CET1
CET1 ratio to CET1* of DoD CET1 ratio capital ratio ambition
CET1 ratio Expected RWA impacts Total Capital ratio 2020 SREP requirement Management buffer (incl. P2G)
▪ The 1Q2020 CET1 ratio came in lower at 14.0%, reflecting both lower CET1 capital and higher RWA
▪ CET1 capital decreased as the addition of net profit of €670 mln was more than offset by a €0.5 bln decrease in revaluation reserves
and €0.6 bln negative FX impact. These decreases will largely reverse over time
▪ RWA were up mainly due to the implementation of the new Definition of Default (€9.9 bln), lending growth (€5.1 bln) and Market
RWA (€4.5 bln), which more than offset the release of €6.6 bln of expected supervisory RWA impact taken in 4Q2019, reflecting
ECB’s decision to delay TRIM implementation
▪ The magnitude of total RWA impact from regulatory changes remains uncertain, although with impact from DoD and part of TRIM
included, we believe further RWA impact is manageable
▪ We maintain our CET1 ratio ambition of around 13.5%
* In line with the recommendations made by the ECB to European banks on 27 March 2020 regarding dividend distributions, ING will suspend all payment of dividends on its ordinary
shares until at least 1 October 2020. 1Q2020 Group net profit of €670 mln was fully added to regulatory capital while €1,754 mln reserved for final dividend 2019 has not been added
back and remains reserved for dividend 36Measures taken by regulatory and supervisory authorities provide
relief for bank capital requirements
Systemic Risk Buffer ▪ The DNB decreased ING Group’s Systemic Risk Buffer (SRB) requirement from 3.00% to 2.50%
▪ Various competent authorities changed or removed Countercyclical Buffer (CCyB) requirements reducing
Countercyclical Buffer
the fully-loaded CCyB for ING from 24 bps to 3 bps
▪ The ECB effectuated article 104(a) CRDV, which allows for a partial fulfilment of the Pillar 2 Requirement
Pillar 2 Requirement (P2R) through AT1 and Tier 2 instruments, thereby implicitly releasing 0.77% of CET1 capital
▪ Following the recommendation by the ECB, most European banks, including ING, announced the
suspension of any dividend payments on ordinary shares until at least 1 October 2020
Dividend ▪ The profits that were reserved for the final 2019 dividend have not been added to the CET1 capital base,
while 1Q2020 net profit has been added to the CET1 capital base
▪ The implementation of Basel IV has been delayed to an effective date of 1 January 2023
Other ▪ Remaining TRIM has been postponed by at least 6 months
▪ DNB delayed the introduction of a floor for Dutch mortgage loan risk weighting
37Distance to Maximum Distributable Amount increased following the
measures taken
ING Group SREP* ▪ As a result of the measures taken in reaction to the
MDA Covid-19 pandemic, ING Group’s fully-loaded CET1
restriction requirement decreased by 1.48pp to 10.51%
level
MDA ▪ 4.50% Pillar 1 minimum (P1R)
(14.78%)
restriction
MDA level ▪ 0.98% Pillar 2 Requirement (P2R)
restriction 2.50%
(12.34%) ▪ 2.50% Capital Conservation Buffer (CCB)
level 0.03%
(10.51%) 2.50% 2.50% ▪ 2.50% Systemic Risk Buffer (SRB)
0.03%
2.50% 1.75% ▪ 0.03% Countercyclical Buffer (CCyB)**
2.50%
0.03% ▪ This excludes Pillar 2 Guidance (P2G)
2.50% 1.31%
▪ Fully loaded Tier 1 requirement decreased by 1.1pp to
0.98% 12.34%
8.00%
6.00% ▪ 0.33% of P2R can be filled with AT1
4.50%
▪ Fully loaded Total Capital requirement decreased by 0.71pp
to 14.78%, only reflecting the reduction in SRB and CCyB
CET1 Tier 1 Total Capital
▪ 0.44% of P2R can be filled with T2
Distance to 3.46% 3.49% 3.28%
MDA* or €11.6 bln or €11.7 bln or €11.0 bln
Pillar 1 P2R CCB CCyB SRB P2G
* Fully-loaded
** Fully-loaded CCyB is expected to be 0.03%, 1Q2020 CCyB is 0.02% 38Issuance entities under our approach to resolution
Issuance entities Eligible instruments for TLAC/MREL
Current
TLAC MREL req.*
▪ Own funds (CET1 / AT1 / T2) ✓ ✓
Designated
resolution ING Groep N.V.
entity ▪ Senior unsecured debt (> 1 yr)** ✓ ✓
▪ Own funds ✓ ✓
ING Bank N.V.
▪ Senior unsecured debt (> 1 yr) X X
▪ Secured funding X X
▪ Operational funding needs
(un)-secured debt
X X
ING ING Other ING
ING Belgium subsidiaries
Australia Germany
***
* ING received a letter from the DNB in March 2020 which specified an MREL requirement which will be binding as of 31 December 2023, resulting in an approximately four-year transition
period for ING Group
** As per the MREL/TLAC requirements, only debt with remaining maturity of >1yr is eligible
*** Including ING Bank Hipoteczny (subsidiary of ING Bank Slaski) which issued a green covered bond in 4Q2019 39Long-term debt maturity ladder and issuance activity in 1Q2020
Long-term debt maturity ladder (in € bln)*
25
20
15
10
5
-
Maturity Issuance 2020 2021 2022 2023 2024 2025 2026 2027 2028 2029 >2029
1Q20 1Q20
TLTRO Covered Bank Senior HoldCo Tier 2 AT1
Issuance activity in 1Q2020*
▪ Total issuance in 1Q2020 was ~€7 bln with ~€14 bln maturities over the same period
▪ ~€0.7 bln of AT1 was issued in PerpNC9 format
▪ ~€0.3 bln of Bank Senior funding was raised**
▪ €1.25 bln of Covered bonds was issued from ING Belgium
▪ ING Bank prepaid part of TLTRO II (€10 bln) and participated in TLTRO III (€4.5 bln)
▪ ING Bank executed a Liability Management Exercise to buyback ~50% of a Bank T2 instrument***
▪ ING Bank has ~€21 bln of Bank Senior debt maturing over the next 3 years
* As per 31 March 2020; Tier 2 maturities based on 1st call date for callable bonds and contractual maturity for bullets. Excluding RMBS and excluding perpetual instruments
** Including structured notes 40
*** ING Bank bought back ~50% of its US$2 bln 5.8% September 2023 Tier 2 instrumentING’s debt issuance programme in 2020
ING Group instruments (in € bln)* Currency split Group / Bank issuance plan
HoldCo Senior Senior debt issuance
84.3 25.1% 6.9%
16% ▪ ~€5-7 bln of HoldCo Senior planned for 2020, subject to balance sheet,
23.7 7.1% 1.9% RWA and regulatory developments and taking into account a phase-in
2.2% 0.6% period for the new MREL requirements
7.5 45%
6.2 1.9% 0.5% ▪ OpCo Senior could be issued for internal ratio management and
39%
general corporate funding purposes
46.8 14.0% 3.8%
Tier 2 Tier 2
2%
1Q20 As % of RWA As % of ▪ Outstanding Tier 2 of ~€8 bln translates into a Tier 2 ratio of 2.2%**
leverage 27% ▪ We intend to refinance ~€2 bln Bank Tier 2 with Group instruments
exposure over time
71%
CET1 Tier 2**
AT1*** HoldCo Sr. Unsecured
AT1*** AT1***
Key points 16%
▪ Outstanding AT1 of ~€6 bln translates into an AT1 ratio of 1.9%
ING is currently meeting the TLAC
requirements. ING has received new MREL ▪ ~€1 bln grandfathered until 31 Dec 2021 following the grandfathering
requirements with a phase-in period of 4 rules
years 84%
▪ ~€5 bln CRD IV compliant
The advancement of CET1 P2R composition EUR USD Other
by the ECB allows for a partial fulfilment of
this requirement through AT1 and Tier 2
instruments
* TLAC requirements apply to ING Group at the consolidated level of the resolution group and are currently set at 16% of RWA and 6% of TLAC Leverage (LR). The available TLAC capacity
consists of own funds and senior debt instruments. ING Group meets the TLAC requirements with a TLAC ratio as per 31 March 2020 of 25.1% of RWA and 6.9% of TLAC Leverage
** Including regulatory adjustments for Tier 2
*** AT1 figures reflecting the redemption of two instruments in April 2020 41Other subsidiaries remain active mainly through their covered bond
programmes
ING Bank N.V. ING Belgium S.A./N.V ING Bank (Australia) Ltd ING Germany ING Bank Hipoteczny
Instruments ▪ Secured funding ▪ Secured funding ▪ Secured funding ▪ Secured funding ▪ Secured funding
overview ▪ Senior unsecured
▪ Covered bond**: ~€20 bln ▪ Covered bond: ~€5 bln ▪ Covered bond: ▪ Covered bond: ~€4 bln ▪ Green covered bond:
Outstanding ▪ Senior unsecured: ~€25 bln AUD$1.75 bln PLN 400 mln
▪ ING Bank Hard and Soft ▪ ING Belgium ▪ ING Australia Covered ▪ ING-DiBa Residential ▪ ING Bank Hipoteczny
Bullet CB Programme Residential Mortgage Bond Programme Mortgage Pfandbrief Covered Bond
Covered Bond Pandbrieven Programme Programme
programme ▪ ING Bank Soft Bullet CB
Programme Programme
6
5
Maturity 4
profile 3
covered bond
(in € bln)* 2
1
0
2020 2021 2022 2023 2024 2025 2026 2027 2028 2029 >2029
ING Bank** ING Belgium ING Bank Australia ING Germany ING Bank Hipoteczny
* As per 31 March 2020; Maturity ladder as per contractual maturity
** Outstanding for the ING Bank Hard and Soft Bullet CB Programme only 42Strong and conservative balance sheet with customer deposits as
the primary source of funding
Balance sheet ING Group (in € bln) Well diversified customer loan book
Balance sheet size ING Group 31 March 2020: €945 bln ▪ See “Asset Quality” section of the presentation
Other 17 Cash balances 55 Total equity
97 with central 18
Other
banks and loans 46 Deposits from Stable funding profile
Financial to banks banks
assets at FVPL 120 Wholesale ▪ Over 62% of the balance sheet is funded by customer
Financial assets funding 141
deposits
85 at FVOCI /
securities at
Financial
98 liabilities at ▪ 88% of total customer deposits is Retail Banking based
amortised cost FVPL
▪ Attractive loan-to-deposit ratio of 107% as per 31 March
2020*
Loans to Customer Conservative trading profile
customers 627
deposits 586
▪ Majority of our Financial Markets business is customer flow
based where we largely hedge out positions, reflected in
large but often offsetting assets and liabilities at FV positions
▪ Average VaR for ING’s trading portfolio during 1Q2020
Assets Liabilities increased to €22 mln from €11 mln in the previous quarter,
mainly due to CVA hedges and increased market volatility
* Loan-to-deposit ratio is customer lending including provision for loan losses divided by customer deposits 43Robust liquidity position
Funding mix* ING holds sizeable liquidity buffer
31 March 2020 ▪ ING’s funding consists mainly of retail deposits, corporate
2% deposits and public debt
10% Customer deposits (retail)
6% Customer deposits (corporate)** ▪ ING’s 12-month moving average LCR remained robust at
5% 49% Repurchase agreements 127% in the first quarter of 2020
Interbank
6% CD/CP
▪ Besides the HQLA buffer, ING maintains large pools of
Long-term senior debt ECB-eligible assets, in the form of internal securitisations and
21% Subordinated debt credit claims
Liquidity buffer LCR 12-month moving average (in € bln)
▪ Level 1: mainly core European sovereign bonds, SSA and US 31 March 2020 31 December 2019
Treasuries Level 1 125.6 124.9
▪ Level 1B: core European and Nordic covered bonds Level 2A 5.4 4.8
Level 2B 4.6 4.3
▪ Level 2A: mainly Canadian covered bonds
Total HQLA 135.6 134.0
▪ Level 2B: mainly short-dated German Auto ABS
Stressed outflow 200.5 198.5
Stressed inflow 93.5 92.8
LCR 127% 127%
* Liabilities excluding trading securities and IFRS equity
** Includes SME/Midcorp from Retail Banking 44Strong rating profile at both Group and Bank level
Main credit ratings of ING on 7 May 2020 Latest ING rating actions
S&P Moody’s Fitch ▪ Fitch: Feb-2019 ING Bank was upgraded to AA-. In April 2020,
Stand-alone rating a baa1 a+
Fitch placed ING Group’s and ING Bank’s ratings on Rating
Watch Negative (RWN) as a result of the economic fallout
Government support - 1 notch - from the Covid-19 pandemic. It also upgraded AT1
Junior debt support 1 notch N/A - instruments by 1 notch and downgraded outstanding Tier 2
Moody’s LGF support N/A 3 notches N/A
instruments by 1 notch to reflect a change in baseline
notching
ING Bank NV (OpCo)
▪ Moody’s: Sep-2017 ING Bank was upgraded to Aa3 from A1
Bank senior LT rating A+ Aa3 AA- with a stable outlook. The improvement was driven by
Outlook Stable Stable RWN resilient profitability, low asset risk, a strengthening capital
Bank senior ST rating A-1 P-1 F1+
position, as well as the expected build-up of loss-absorbing
capital at ING Group
Tier 2 BBB+ Baa2 A-
▪ S&P: Jul-2017 ING Bank was upgraded to A+ reflecting the
ING Groep NV (HoldCo) expectation that in the coming years ING will build a sizable
Group senior LT rating A- Baa1 A+ buffer of bail-in-able debt, while maintaining strong capital
Outlook Negative Stable RWN
adequacy metrics thanks to resilient financial performance,
supportive internal capital generation, and a broadly similar
AT1 BB Ba1 BBB risk profile. In April 2020, S&P changed ING Group’s outlook to
Tier 2 BBB Baa2 A- negative, as a result of the impact of the Covid-19 pandemic
on the Dutch economy and banking sector in general
45Appendix
46Comfortable buffer to Additional Tier 1 trigger
Buffer to AT1 trigger ING Group available distributable items (in € mln)*
31 March 2020 2019
46.8 Share premium 17,078
Other reserves 28,052
€23.3 bln Legal and statutory reserves 3,999
7.0%**
Non-distributable -8,398
23.5 Total 40,732
Accrued interest expenses on own fund instruments at year-end 147
Distributable items excluding result for the year 40,879
Unappropriated result for the year 4,601
Total available distributable items 45,479
1Q2020 7% CET1
CET1 capital AT1 conversion trigger
▪ ING Group capital buffer to conversion trigger (7% CET1) is high at €23.3 bln, or 7.0% of RWA
▪ This excludes €1,754 mln of net profits that we previously set aside for the final 2019 dividend payment
▪ AT1 discretionary distributions may only be paid out of distributable items
▪ As per year-end 2019, ING Group had ~€45.5 bln of available distributable items following the CRDIV definition
* According to the CRR/CRDIV
** Difference between 14.0% ING Group CET1 ratio in 1Q2020 and 7% CET1 equity conversion trigger 47Outstanding benchmark capital securities (Additional) Tier 1 securities issued by Group Currency Issue date First call date Coupon Outstanding** Issued Reset spread USD* Feb-20 May-29 4.875% 750 750 UST + 351bps USD* Sep-19 Nov-26 5.750% 1,500 1,500 UST + 434bps USD Feb-19 Apr-24 6.750% 1,250 1,250 USSW + 420bps USD Nov-16 Apr-22 6.875% 1,000 1,000 USSW + 512bps USD*,**** Apr-15 Apr-20 6.000% 1,000 1,000 USSW + 445bps USD* Apr-15 Apr-25 6.500% 1,250 1,250 USSW + 445bps USD***,**** Sep-05 Jan-11 6.125% 700 700 6.125% EUR*** Jun-04 Jun-14 10yr DSL +10 563 1,000 10yr DSL +10 EUR*** Jun-03 Jun-13 10yr DSL +50 432 750 10yr DSL +50 Tier 2 securities issued by Group Currency Issue date First call date Coupon Outstanding** Maturity EUR Nov-19 Nov-25 1.00% 1,000 Nov-30 USD Mar-18 Mar-23 4.70% 1,250 Mar-28 EUR Mar-18 Mar-25 2.00% 750 Mar-30 EUR Sep-17 Sep-24 1,625% 1,000 Sep-29 EUR Feb-17 Feb-24 2.50% 750 Feb-29 EUR Apr-16 Apr-23 3.00% 1,000 Apr-28 Tier 2 securities issued by Bank Currency Issue date First call date Coupon Outstanding** Maturity EUR Feb-14 Feb-21 3.63% 1,500 Feb-26 USD Sep-13 n/a 5.80% 1,000***** Sep-23 * SEC registered ** Amount outstanding in original currency *** Grandfathered instruments **** These instruments were redeemed in April 2020 ***** Outstanding amount was reduced with US$1.0 bln following a Liability Management Exercise 48
Most recent HoldCo Senior transactions

HoldCo Senior Unsecured, EUR issuances
ISIN                                            Issue date              Maturity   Tenor        Coupon    Currency    Issued         Spread
XS2049154078*                                       Sep-19               Sep-25      6yr        0.100%         EUR     1,000        m/s + 60
XS1933820372                                        Jan-19               Jan-26      7yr        2.125%         EUR     1,000       m/s + 170
XS1909186451                                       Nov-18                Nov-30     12yr        2.500%         EUR     1,500       m/s + 135
XS1882544973                                        Sep-18               Sep-28     10yr        2.000%         EUR     1,500       m/s + 110
XS1882544205                                        Sep-18               Sep-23      5yr       3mE + 85        EUR     1,000       3mE + 85
XS1882544627                                        Sep-18               Sep-23      5yr        1.000%         EUR     1,000        m/s + 80
XS1771838494                                        Feb-18               Feb-25      7yr        1.125%         EUR     1,000        m/s + 42
HoldCo Senior Unsecured, USD issuances**
ISIN                                            Issue date              Maturity   Tenor        Coupon    Currency    Issued         Spread
US456837AP87                                        Apr-19               Apr-24      5yr         3.55%         USD     1,000         T + 130
US456837AQ60                                        Apr-19               Apr-29     10yr         4.05%         USD     1,000         T + 158
US45685NAA46 (RegS/144a)                           Nov-18                Jan-26      7yr          4.625        USD     1,250         T + 150
US456837AM56                                        Oct-18               Oct-28     10yr        4.550%         USD     1,250         T + 150
US456837AK90                                        Oct-18               Oct-23      5yr        4.100%         USD     1,500       T + 112.5
US456837AL73                                        Oct-18               Oct-23      5yr      3mL + 100        USD       500      3mL + 100
HoldCo Senior Unsecured, $AUD, JPY, GBP issuances
ISIN                                            Issue date              Maturity    Tenor        Coupon   Currency    Issued          Spread
JP552843AKE0                                        Feb-19             Feb-2029      10yr        1.074%        JPY    21,100        YSO + 77
JP552843BKE8                                        Feb-19             Feb-2024       5yr        0.810%        JPY    88,900        YSO + 88
XS1953146245                                        Feb-19             Feb-2026       7yr        3.000%        GBP     1,000         G + 210
JP552843AJQ6                                       Dec-18                Dec-23       5yr        0.848%        JPY   107,500        YSO + 75
JP552843BJQ4                                       Dec-18                Dec-28      10yr        1.169%        JPY    19,200        YSO + 90
XS1917902196                                       Dec-18                Jun-29    10.5yr         5.00%       AUD        175      ASW + 226
XS1917901974                                       Dec-18                Dec-22       4yr   3mBBSW+155        AUD        400   3mBBSW + 155
* Callable HoldCo Senior instrument with the first call in September 2024
** HoldCo USD issues are SEC registered unless mentioned otherwise
   Green bond                                                                                                                             49
ING Bank’s covered bond programme…

▪ ING Bank NV €30 bln Hard and Soft Bullet Covered Bonds programme                                      Repayment type
  ▪ UCITS, CRR and ECBC Label compliant. Rated Aaa/AAA/AAA (Moody’s/S&P/Fitch)                                3% 4%            Interest Only
                                                                                                            6%                 Investment
  ▪ This programme is used for external issuance purposes. There is a separate €15 bln Soft Bullet        7%
    Covered Bonds programme for internal transactions only and it is not detailed on this slide                                Savings
                                                                                                         6%                    Amortising
  ▪ Cover pool consists of 100% prime Dutch residential mortgage loans, all owner occupied and in
    euro only. As per 31 March 2020, no arrears > 90 days in the cover pool                              8%                    Life insurance
                                                                                                                       67%     Hybrid
  ▪ Strong Dutch legislation with minimum legally required over collateralisation (OC) of 5% and LTV                           Other
    cut-off rate of 80%
                                                                                                        Interest rate type
▪ Latest investor reports are available on www.ing.com/ir
                                                                                                              12%
                                                                                                                               Fixed
                                                                                                                               Floating
Portfolio characteristics (as per 31 March 2020)
Net principal balance                                                                    €24,501 mln
                                                                                                                       88%
Outstanding bonds                                                                        €19,889 mln
# of loans                                                                                   149,268    Current Indexed LTVs
Avg. principal balance (per borrower)                                                       €164,140
                                                                                                                 3% 10%        NHG
WA current interest rate                                                                       2.71%       10%         4%      0-20%
WA remaining maturity                                                                     16.33 years
                                                                                                                        15%    20-40%
WA remaining time to interest reset                                                        5.58 years
                                                                                                                               40-60%
WA seasoning                                                                              13.38 years   31%                    60-80%
WA current indexed LTV                                                                        58.39%
                                                                                                                               80-90%
Min. documented OC                                                                             2.56%                  27%
                                                                                                                               90-100%
Nominal OC                                                                                    23.19%                           >100%
                                                                                                                                                50
…benefiting from a strong Dutch housing market and an economy
which was still solid at the end of 1Q2020
Dutch Purchasing Managers Index (PMI) was 50.5 as per end Dutch and eurozone unemployment rates (%) at a
1Q2020, indicating slightly positive industrial growth historically low level
70 15
60
10
50
5
40
30 0
2009 2010 2011 2012 2013 2014 2015 2016 2017 2018 2019 2020 2009 2010 2011 2012 2013 2014 2015 2016 2017 2018 2019 2020
Netherlands eurozone
Dutch house price increases in the last six years are not
Dutch consumer confidence remains below 0 in 1Q2020 credit-driven*
120
30
110
0 100
90
-30
80
-60 70
2009 2010 2011 2012 2013 2014 2015 2016 2017 2018 2019 2020 2009 2010 2011 2012 2013 2014 2015 2016 2017 2018 2019 2020
House prices Total Mortgage debt
Source: Central Bureau for Statistics for all data besides Dutch PMI (IHS Markit) and eurozone unemployment (Eurostat)
* Latest data 4Q2019 51Important legal information ING Group’s annual accounts are prepared in accordance with International Financial Reporting Standards as adopted by the European Union (‘IFRS-EU’). In preparing the financial information in this document, except as described otherwise, the same accounting principles are applied as in the 2019 ING Group consolidated annual accounts. All figures in this document are unaudited. Small differences are possible in the tables due to rounding. Certain of the statements contained herein are not historical facts, including, without limitation, certain statements made of future expectations and other forward-looking statements that are based on management’s current views and assumptions and involve known and unknown risks and uncertainties that could cause actual results, performance or events to differ materially from those expressed or implied in such statements. Actual results, performance or events may differ materially from those in such statements due to a number of factors, including, without limitation: (1) changes in general economic conditions, in particular economic conditions in ING’s core markets, including changes affecting currency exchange rates, (2) the effects of the Covid-19 pandemic and related response measures, including lockdowns and travel restrictions, on economic conditions in countries in which ING operates, on ING’s business and operations and on ING’s employees, customers and counterparties, (3) changes affecting interest rate levels, (4) any default of a major market participant and related market disruption, (5) changes in performance of financial markets, including in Europe and developing markets, (6) changes in the fiscal position and the future economic performance of the United States, including potential consequences of a downgrade of the sovereign credit rating of the US government, (7) consequences of the United Kingdom’s withdrawal from the European Union, (8) changes in or discontinuation of ‘benchmark’ indices, (9) inflation and deflation in our principal markets, (10) changes in conditions in the credit and capital markets generally, including changes in borrower and counterparty creditworthiness, (11) failures of banks falling under the scope of state compensation schemes, (12) non-compliance with or changes in laws and regulations, including those financial services and tax laws, and the interpretation and application thereof, (13) geopolitical risks, political instabilities and policies and actions of governmental and regulatory authorities, (14) ING’s ability to meet minimum capital and other prudential regulatory requirements, (15) outcome of current and future litigation, enforcement proceedings, investigations or other regulatory actions, including claims by customers, (16) operational risks, such as system disruptions or failures, breaches of security, cyber-attacks, human error, changes in operational practices or inadequate controls including in respect of third parties with which we do business, (17) risks and challenges related to cybercrime including the effects of cyber-attacks and changes in legislation and regulation related to cybersecurity and data privacy, (18) changes in general competitive factors, (19) the inability to protect our intellectual property and infringement claims by third parties, (20) changes in credit ratings, (21) business, operational, regulatory, reputation and other risks and challenges in connection with climate change, (22) inability to attract and retain key personnel, (23) future liabilities under defined benefit retirement plans, (24) failure to manage business risks, including in connection with use of models, use of derivatives, or maintaining appropriate policies and guidelines, (25) changes in capital and credit markets, including interbank funding, as well as customer deposits, which provide the liquidity and capital required to fund our operations, (26) the other risks and uncertainties detailed in the most recent annual report of ING Groep N.V. (including the Risk Factors contained therein) and ING’s more recent disclosures, including press releases, which are available on www.ING.com. This document may contain inactive textual addresses to internet websites operated by us and third parties. Reference to such websites is made for information purposes only, and information found at such websites is not incorporated by reference into this document. ING does not make any representation or warranty with respect to the accuracy or completeness of, or take any responsibility for, any information found at any websites operated by third parties. ING specifically disclaims any liability with respect to any information found at websites operated by third parties. ING cannot guarantee that websites operated by third parties remain available following the publication of this document, or that any information found at such websites will not change following the filing of this document. Many of those factors are beyond ING’s control. Any forward looking statements made by or on behalf of ING speak only as of the date they are made, and ING assumes no obligation to publicly update or revise any forward-looking statements, whether as a result of new information or for any other reason. This document does not constitute an offer to sell, or a solicitation of an offer to purchase, any securities in the United States or any other jurisdiction. 52
You can also read