Smart cities Ranking of European medium-sized cities
←
→
Page content transcription
If your browser does not render page correctly, please read the page content below

Smart cities
Ranking of European medium-sized cities

                                              Research Institute for
     Centre of Regional     Department of     Housing, Urban and
     Science (SRF)          Geography         Mobility Studies (OTB)

     Vienna University of   University of     Delft University of
     Technology             Ljubljana         Technology

                                            Final report, October 2007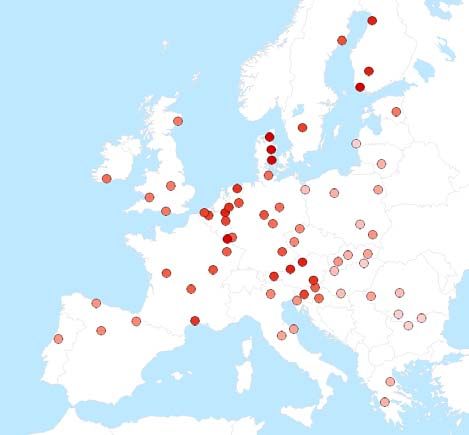
Smart cities – Ranking of European medium-sized cities

General notes
This report represents the final
report of a research project
sponsored by Asset One Immo-
bilienentwicklungs    AG, Kaiser-
feldgasse 2, 8010 Graz.

The project was elaborated from
April to October 2007. This report
was edited by the Centre of
Regional Science (SRF), Vienna
University of Technology in October
2007.

Contact:
Rudolf Giffinger
giffinger@srf.tuwien.ac.at
www.srf.tuwien.ac.at

Project team
The research was carried out in
collaborative work of persons from
the Centre of Regional Science at
the Vienna University of Technology
(lead partner), the Department of
Geography      at   University   of
Ljubljana and the OTB Research
Institute for Housing, Urban and
Mobility Studies at the Delft
University of Technology.

Rudolf Giffinger, Vienna UT
Christian Fertner, Vienna UT
Hans Kramar, Vienna UT
Robert Kalasek, Vienna UT
Nataša Pichler-Milanović, University
of Ljubljana
Evert Meijers, Delft UT

Moreover thanks to Markus Petzl,
Andreas Kleboth, Ernst Giselbrecht
for participating contextually at the
Kick-Off workshops.

Project homepage
www.smart-cities.eu

© Centre of Regional Science, Vienna UT, October 2007

                                                                                               1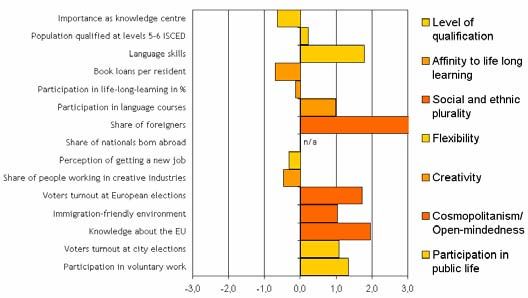
Smart cities – Ranking of European medium-sized cities

2
Smart cities – Ranking of European medium-sized cities

Content
1     Background                                                                                 5
    1.1    Aim of the project                                                                    5
    1.2    The role of city-rankings in regional competition                                     6

2     Objective                                                                                10
    2.1    Defining smart city                                                                  10
    2.2    Operationalizing smart city                                                          11

3     Methodology                                                                              13
    3.1    Selecting cities                                                                     13
    3.2    Identifying indicators and data sources                                              14
    3.3    Standardizing and aggregating data                                                   14

4     Results and dissemination                                                                15
    4.1    Performance of 70 cities                                                             15
    4.2    City profiles                                                                        17
    4.3    Dissemination                                                                        18
    4.4    Outlook                                                                              18

5     Annex                                                                                    21

Figures
Fig. 1:    Characteristics of a smart city                                                      11
Fig. 2:    Structuring the analysis                                                             11
Fig. 3:    Characteristics and factors of a smart city                                          12
Fig. 4:    z-transformation                                                                     14
Fig. 5:    City sample and total rating                                                         15
Fig. 6:    Final rating and composition by characteristics                                      15
Fig. 7:    Profile of Luxembourg                                                                17
Fig. 8:    Luxembourg – Performance in Smart People                                             17
Fig. 9:    Project homepage                                                                     18
Fig. 10:   Population in medium-sized cities in Europe                                          19

Tables
Tab. 1:    Elaborated city rankings                                                              6
Tab. 2:    Selection criteria                                                                   13
Tab. 3:    Databases used, number of indicators                                                 14
Tab. 4:    Final results and performance in characteristics                                     16
Tab. 5:    List of indicators                                                                   22
Tab. 6:    City sample                                                                          24

                                                                                                 3
Smart cities – Ranking of European medium-sized cities 4
Smart cities – Ranking of European medium-sized cities

1 Background

1.1 Aim of the project

Globalization, with trade liberalization measures and fast technological changes
altering the relations of production, distribution and consumption, has very
substantial effects on city development. As one important consequence, (network-)
economies evolved ”[…] with easier physical movement, globalized players making
decisions with no regard to national boundaries”(Thornley, 2000). Along with this
progress private firms of the service sector but even of the production sector are
increasingly footless and flexible in their location behaviour. Besides the
technological changes it is the European integration process, which reduces the
differences in economic, social and environmental standards and norms and, thus,
provides a common market. The ongoing reduction of differences and barriers
between nations also makes cities more similar in their preconditions. Thus, only a
few out of many location-based characteristics gain importance for global actors
(Begg, 1999; Parkinson et al., 2003) enforcing competition across cites by altering
each city as potential competitor to improve its location profile. Cities in Europe
face the challenge of combining competitiveness and sustainable urban development
simultaneously. This challenge is likely to have an impact on issues of Urban Quality
such as housing, economy, culture, social and environmental conditions changing a
city's profile and urban quality in its composition of factors and characteristics.

This project deals with medium-sized cities and their perspectives for development.
Even though the vast majority of the urban population lives in such cities, the main
focus of urban research tends to be on the ‘global’ metropolises. As a result, the
challenges of medium-sized cities, which can be rather different, remain unexplored
to a certain degree. Medium-sized cities, which have to cope with competition of the
larger metropolises on corresponding issues, appear to be less well equipped in terms
of critical mass, resources and organizing capacity. To enforce an endogenous
development and achieve a good position, even these cities have to aim on
identifying their strengths and chances for positioning and ensure and extend
comparative advantages in certain key resources against other cities of the same
level. City rankings are a tool to identify these assets. Although they are quite
common in recent time, rankings are very different in their approaches or methods.
Due to different interests behind rankings and the indicators and methodological
approaches used it is also normal that one city is ranked very different in different
rankings. Additionally, medium-sized cities are often not or only partially considered.

Hence, existing rankings and benchmarks are not satisfying for medium-sized cities.
The smart cities ranking, based on a comprehensive catalogue of indicators, offers a
new view on medium-sized cities in Europe and their respective differences and
comparative (dis-)advantages towards each other and allows to
    • illustrate differences in the respective characteristics and factors,
    • elaborate specific perspectives for development and positioning and
    • identify strenghts and weaknesses for the considered cities in a comparative
       way.

Finally, we will show that the aproach allows an in-depth analysis for every city
based on the comprehensive description of characteristics and the large number of
indicators.

                                                                                             5
Smart cities – Ranking of European medium-sized cities
1.2 The role of city-rankings in regional competition
City-rankings have become a central instrument for assessing the attractiveness of
urban regions over the last 20 years. In these kinds of comparative studies cities are
evaluated and ranked with regard to different economic, social and geographical
characteristics in order to reveal the best (and the worst) places for certain
activities. Consequently city-rankings are often used by the cities themselves to
sharpen their profile and to improve their position in the competition of cities: a top-
rank in a highly reputed city ranking helps to improve the international image of a
city and can therefore play a central role in its marketing strategy.
Examining and comparing different city-rankings in Germany, Schönert (2003) found
out that they are targeted on different goals and that they significantly differ in
methods and results. According to the chosen indicators and their weights many
cities showed rather different ratings in the city-rankings considered. Furthermore
there is no evidence that the evaluations are reflected in actual economic
performance. Based on a detailed analysis and comparison of 10 German rankings1
Schönert points out the following assets of city-rankings:
City-rankings draw public attention to major issues of regional science
City-rankings stimulate a broad discussion on regional development strategies
Regional actors are forced to make their decisions transparent and
comprehensible
Positive changes are also registered outside the region
The results in detail may initiate learning effects of local actors
On the other hand he considers some handicaps:
City-rankings tend to neglect complex interrelations in regional development
The discussion is mainly focused on the bare rank
Long-term development strategies may be threatened
Existing stereotypes may be strengthened
Badly ranked cities tend to ignore the results
In order to get a more detailed insight into the diverse methods, objectives and
results of different city-rankings, some international examples (as listed in table 1)
are described and compared. 3 main aspects of rankings should be noticed: The
objective of the ranking, the methodology and the final dissemination of the results.
The different characteristics from the chosen rankings will be used to illustrate these
aspects.
Tab. 1: Elaborated city rankings
# Title Author Published in Spatial scope
1 Quality of Living Survey Mercer Human Resource Consulting 2007 200 cities
worldwide
2 Canada’s most sustainable Corporate Knights – The Canadian 2007 Large Canadian
cities magazine for responsible business urban centres
3 How the world views its cities Anholt City Brands 2006 60 cities
worldwide
4 Worldwide cost of living Economist Intelligence Unit 2006 130 cities
worldwide
5 Dritter Großstadtvergleich IW Consult GmbH / Institute of the 2006 50 German cities
German industry
1
The city rankings considered have been published by the magazines Focus, Capital, Impulse and Bizz
between 1994 and 2003.
6Smart cities – Ranking of European medium-sized cities
6 Europas attraktivstes University of Mannheim / Manager 2005 58 European cities
Metropolen für Manger magazin
7 Les villes Européennes. UMR Espace (Rozenblat, Cicille) 2003 180 Western
Analyse comparative European cities
Objectives
The objective of a ranking is not only specified by its aim and its target audience but
also by its spatial scope and the desired factors and indicators behind the ranking.
The rankings chosen for elaboration include between 50 and 200 cities – at least
nation-wide but often also worldwide. This spatial scope depends of course on the
aim and the target audience.
The target audience of most rankings are either companies which have to relocate
executives (expatriates) or the (future) expatriates themselves (1,3,4,6), or political
leaders of cities and communes which stand in direct competition with others
(2,5,7). Hence, on the one hand a ranking can be used to rate certain costs of living
or individual development chances, and on the other hand to illustrate lacks or
advantages in a certain current state of development of a city opposite its direct
competitors.
Additional to the spatial scope, the chosen factors (and later the indicators) are
certainly bound to the actual aim and target audience of a ranking. Rankings focusing
on managers and expatriates mainly focus on individual living conditions for that
certain group (1,3,4,6). Rankings mainly focusing on the development state of cities
include a broader choice of factors ranging from demographic factors, goods turnover
to tourist attractivity etc. (5,7). However, rankings can also be used to analyse a
certain characteristic of the cities state, as e.g. environmental sustainability (2).
Methodology
Methodology does not only include the way of data collection and processing but in a
first step also the actual limitation of the selection of cities examined in the ranking.
Certainly, a broad spatial scope is already defined by the objectives (e.g. only
European cities). Still, as there are usually not enough resources to include all cities
within this broad scope a further selection is necessary. Many rankings select cities
on the basis of their population size (2,5,7), others by their importance in matters of
global significance or perceptional importance for their target audience (1,3,4).
Quite a comprehensive selection method was chosen for ranking 6: First a list of 643
European cities was elaborated which fulfilled one of various criteria (e.g. capital
function, at least 100,000 inhabitants, listed in certain other rankings or at least one
company headquarter according to Forbes 2000). All cities got a score for each
criterion which was the basis for the selection of 58 cities for the actual ranking.
Finally, data availability (for the subsequent ranking) also plays an important role in
the selection of the cities if resources are limited. The collection of data is mainly a
question of available project resources. Some data for rankings were elaborated by
field research, mainly by interviews (1,3), the majority of data, however, was
acquired by desk research, analysing primary and secondary data (2,4,5,6,7).
7Smart cities – Ranking of European medium-sized cities A crucial point which has to be considered in the methodology is the use of weighting. Usually it is necessary to weight factors or indicators due to their influence or importance for the aim of the ranking. This is typically done by the executing agencies themselves, which have certain aims or targets in mind. Nevertheless it is also possible to assess the weight of the factors for the ranking by interviews again (1) if the target group is clearly defined. Dissemination The way, how the results are evaluated, interpreted and presented is crucial for the impact of the ranking. An overall list of cities ranked is the typical result of city rankings. All elaborated rankings include such a list; some studies also include more differentiated results. One differentiation refers to the difference of the current status of a city and its recent development. In ranking 5 two rankings over all cities, a “Niveau”-Ranking and a “Dynamik”-Ranking were elaborated. Therefore cities with a lower state but with a recently very positive development were rated also high in the final ranking. Another approach was chosen in ranking 6: As the target group of the ranking were managers, 3 types of different managers with different demands were elaborated which influenced the weighting of the factors used. In ranking 7 a typology of core function(s) for each city was additionally elaborated through the performance within the different factors. This approach focuses especially on the strengths of each city. Another part of the dissemination aspect is the final availability of the results. Mostly the overall list (or the top) is available free of charge. On the contrary, partial results and interpretations or deeper insights are often not freely available. This might also be a reason for the sole public attention on the final results as addressed below. In brief it can be stated that there is a broad variety of how to do a ranking and it seems that rankings focusing on a more detailed and clearly defined issue provide more applicable results than rankings providing ‘just’ an overall list. Not only when analysing and interpreting existing city-rankings but also when developing a new one, it is important to consider these three aspects, giving evidence on their objectives, methodologies and dissemination. One serious problem of all city-rankings seems to be the fact that public attention is mainly focussed on the final ranking without considering the methodological aspects behind the ratings. This selective public perception of results enforces a confirmation of existing stereotypes and clichés neglecting the specific strengths and weaknesses of the cities in detail. The rankings are excessively acclaimed by the “winners” in order to improve their public image, while the “losers” tend to ignore the results which might threaten their position in city competition. Consequently both groups of cities pass up the chance to make use of the results in a constructive and positive way by discussing the main findings in detail. Only a serious examination of the results reveals actual strengths and weaknesses of cities and can therefore be used as an empirical base for detecting future fields of activity. Another major handicap of most city-rankings, which is especially relevant for medium-sized cities, lies in their generalistic approach: Since many financiers ask for clear results which can easily be communicated in public, most rankings aim at finding the “best” or “most attractive” city in general terms. Consequently these studies try to cover all fields of local attractiveness totally ignoring the fact that different activities need different conditions. It is quite obvious, however, that a city that offers a high quality of life does not necessarily have to be the ideal location for all industrial branches. This is especially true for medium-sized cities, which are not able to compete in all fields of economic activity, but have to focus on selected 8
Smart cities – Ranking of European medium-sized cities
branches. This strategy of specialisation is based on an accurate examination of
existing economic, social and environmental potentials in order to find specific
niches in which the city is able to establish some competitive advantage. For that
reason it does not really make sense to compare medium-sized cities generally and to
evaluate their attractiveness in total. Even more than in the case of metropolises,
city-rankings of medium-sized cities have to be highly specific in their approach and
always be related to a particular aspect of attractiveness: The results of rankings
focussing on quality of life or on cultural potentials will strongly diverge from the
findings of studies which try to evaluate regional conditions for tourism or innovative
industries. Consequently, rankings comparing medium-sized cities have to be
interpreted thoroughly and with caution and the results should not be published
without mentioning the factors and indicators considered.
Anticipating our own ranking approach as illustrated in the next chapter, some
conclusions should be drawn for the design and application of rankings dealing with
medium-sized cities:
The largest part of European urban citizens live in medium-sized cities
Need for definition of medium-sized cities
Poor data availability makes inclusion of data from different spatial levels and
limited sample necessary
Transparent and well structured approach necessary for serious examination
Focused rankings provide more applicable results
Differentiation through relevant factors allows information and policy advice
on strategic specialisation
These conclusions are especially relevant for the current study. However, for a
possible successor project certain adaptations are conceivable. The large number of
medium-sized cities and its weight in regards to citizens and number of cities is a
strong argument for the need of expanding the sample and continue research as
emphasized in the outlook in the last chapter.
9Smart cities – Ranking of European medium-sized cities 2 Objective 2.1 Defining smart city Rankings are only of value if the target is defined well and a transparent structure is used. The objective of this ranking is to compare characteristics and to identify strengths and weaknesses of medium-sized cities in a comparative way. Therefore it is not useful to solely focus on the performance of only one aspect of city development but on the performance in a broad range of characteristics. The specific feature of our approach is the evaluation of these characteristics regarding a forward-looking development on the basis of a combination of local circumstances and activities carried out by politics, business, and the inhabitants. As elaborated in a first phase of the project, a forward-looking development approach should consider issues as awareness, flexibility, transformability, synergy, individuality, self-decisive, strategic behaviour. Especially awareness seems important for a smart city as certain potentials can only be mobilised if inhabitants, companies or the administration are aware of the cities’ position – knowing the city from the inside but also being aware of the surroundings and the system of cities the city is located in. Although the term smart city is understood as a certain ability of a city and not focusing on single aspects, a further definition requires identifying certain characteristics for the evaluation. Although the term “Smart City” is not very widely used yet in spatial planning literature or urban research, it is still possible to identify various aspects as a basis for further elaboration. Concluding from literature research the term is not used in a holistic way describing a city with certain attributes, but is used for various aspects which range from Smart City as an IT-district to a Smart City regarding the education (or smartness) of its inhabitants. In the following the various aspects will be summarized. In association with economy or jobs Smart City is used to describe a city with a “smart” industry. That implies especially industries in the fields of information and communication technologies (ICT) as well as other industries implying ICT in their production processes. Also for business parks or own districts comprising of companies within this field the name Smart City is used. The term Smart City is also used regarding the education of its inhabitants. A Smart City has therefore smart inhabitants in terms of their educational grade. In other literature the term Smart City is referred to the relation between the city government resp. administration and its citizen. Good governance as an aspect of a smart administration often also referred to the usage of new channels of communication for the citizens, e.g. “e- governance” or “e-democracy”. Smart City is furthermore used to discuss the use of modern technology in everyday urban life. This includes not only ICT but also, and especially, modern transport technologies. Logistics as well as new transport systems as “smart” systems which improve the urban traffic and the inhabitants’ mobility. Moreover various other aspects referring to life in a city are mentioned in connection to the term Smart City like security/safe, green, efficient & sustainable, energy etc. To sum up, there are several fields of activity which are described in literature in relation to the term Smart City: industry, education, participation, technical infrastructure, various ‘soft factors’; finally we can identify six characteristics (see Fig. 1) as a roof for the further elaboration of smart cities which should incorporate the findings but also allow an inclusion of additional factors. 10
Smart cities – Ranking of European medium-sized cities

Referring to the first paragraph Fig. 1:    Characteristics of a smart city
we can structure the findings as
the following: A Smart City is a
city well performing in a
forward-looking way in these six
characteristics, built on the
‘smart’      combination      of
endowments and activities of
self-decisive, independent and
aware citizens.

Furthermore it should be
emphasized      that   we     are
currently only able to draw a
picture of the present state of a
city. Still, the path of
development is decisive for a
smart city and should be
considered in further research
that builds on time-series data.

2.2 Operationalizing smart city

To describe a smart city and its Fig. 2: Structuring the analysis
six    characteristics   it    is
necessary    to     develop     a
transparent and easy hierarchic
structure, where each level is
described by the results of the
level below. Each characteristic
is therefore defined by a
number of factors. Furthermore
each factor is described by a
number of indicators. The
factors were defined in several
workshops always having the
overall target, smart city
development in mind. Finally
33 factors were chosen to describe the 6 characteristics. To analyse the performance
in each factor 1-4 indicators were selected (see chapter 3.2) and assigned to each
factor. For two factors, “Ability to transform” and “Political strategies &
perspectives” it was not possible to receive sufficient data at the moment. Therefore
31 factors finally remained for the ranking. However, for further rankings we
recommend to include and elaborate also these two factors as they seem important
for the completion of the model.

The following table illustrates the 6 characteristics and their assigned factors. Smart
Economy includes factors all around economic competitiveness as innovation,
entrepreneurship, trademarks, productivity and flexibility of the labour market as
well as the integration in the (inter-)national market. Smart People is not only
described by the level of qualification or education of the citizens but also by the
quality of social interactions regarding integration and public life and the openness
towards the “outer” world. Smart Governance comprises aspects of political
participation, services for citizens as well as the functioning of the administration.

                                                                                              11
Smart cities – Ranking of European medium-sized cities
Local and international accessibility are important aspects of Smart Mobility as well
as the availability of information and communication technologies and modern and
sustainable transport systems. Smart Environment is described by attractive natural
conditions (climate, green space etc.), pollution, resource management and also by
efforts towards environmental protection. Finally, Smart Living comprises various
aspects of quality of life as culture, health, safety, housing, tourism etc.
Fig. 3: Characteristics and factors of a smart city
sd
SMART ECONOMY SMART PEOPLE
(Competitiveness) (Social and Human Capital)
Innovative spirit Level of qualification
Entrepreneurship Affinity to life long learning
Economic image & trademarks Social and ethnic plurality
Productivity Flexibility
Flexibility of labour market Creativity
International embeddedness Cosmopolitanism/Open-
Ability to transform mindedness
Participation in public life
SMART GOVERNANCE SMART MOBILITY
(Participation) (Transport and ICT)
Participation in decision-making Local accessibility
Public and social services (Inter-)national accessibility
Transparent governance Availability of ICT-infrastructure
Political strategies & Sustainable, innovative and safe
perspectives transport systems
SMART ENVIRONMENT SMART LIVING
(Natural resources) (Quality of life)
Attractivity of natural Cultural facilities
conditions Health conditions
Pollution Individual safety
Environmental protection Housing quality
Sustainable resource Education facilities
management Touristic attractivity
Social cohesion
These characteristics and factors form the framework for the indicators and the
following assessment a city’s performance as smart city.
12Smart cities – Ranking of European medium-sized cities
3 Methodology
3.1 Selecting cities
As written in the previous chapters the focus of this ranking lies on medium-sized
cities. However, there is no common definition of a medium-sized city. For this study
we chose to understand medium-sized cities as cities often also understood as
“second cities” on a European scale, cities which are mainly not recognised very well
on a European scale but often of crucial importance on a national and regional scale.
As a starting point we chose to focus on cities with a populuation between 100,000
and 500,000 inhabitants. The most comprehensive overview of cities or functional
urban areas (FUA) in Europe provides the Espon 1.1.12 study incorporating almost
1,600 entities in Europe3.
For the further selection of a feasible sample two main arguments were considered
according to the project’s aim and its timeframe: Cities should be of medium size
and they should be covered by accessible and relevant databases. For these reasons
three knock-out criteria were elaborated in a first selection phase on the basis of the
Espon 1.1.1 study. Additionally, the fact if a city is covered by Urban Audit – a
European wide database on cities – is decisive for the benchmark as for reasons of
data availability. Hence 94 cities remained.
Tab. 2: Selection criteria
Crit. Description Cities thereof covered
(FUA) by Urban Audit
- Starting point – functional urban areas in Europe 1,595 244
1 Population 100,000 – 500,000 584 128
(to obtain medium-sized cities)
2 At least 1 university 364 101
(to exclude cities with a weak knowledge basis)
3 Catchment area less than 1.500,000 256 94
(to exclude cities which are dominated by a bigger city)
In a second step the project team did some further adaptation and elaboration of the
city sample regarding data accessibility and quality. Also some cities which actually
are of medium-size but situated in a denser populated area and therefore having a
catchment area slightly larger than 1.5 mio. were included. Finally 70 cities were
chosen for the sample.
2
Nordregio (2004) ESPON 1.1.1: Potentials for polycentric development in Europe;
Project report, Luxembourg: European Spatial Planning Observation Network Coordination Unit.
3
The Espon 1.1.1 study included the EU27-member states plus Norway and Switzerland
13Smart cities – Ranking of European medium-sized cities
3.2 Identifying indicators and data sources
All indicators that jointly describe the factors of a smart city are derived from public
and freely available data, obtained from the following databases:
Tab. 3: Databases used, number of indicators
Database Spatial level Basis for
indicators
Urban Audit (CORE) local 35
Espon 1.4.3 project (FUA level) local-regional 3
Espon 1.2.1 project (NUTS3 level) regional 1
Eurostat database (NUTS3) regional 1
Eurostat database (NUTS2) regional 8
Eurostat database (NUTS0) national 1
Various Eurobarometer special surveys (NUTS0) national 24
Study4 on creative industries in Europe (NUTS0) national 1
In total 74 indicators were selected for the evaluation, whereas 48 (65 %) are based
on local or regional data and 26 (35 %) are based on national data. The inclusion of
national data was necessary to broaden the database but also because very interest-
ing data is available on that level. We tried to use the most current data as possible.
However, as for reasons of data availability we also had to include older data, finally
ranging from 2001 to 2007. Furthermore several datasets were complemented from
other sources by individual research by the project team so that we finally could
achieve a coverage rate of 87 % for the 70 cities by 74 indicators. The complete list
of indicators is available in the annex.
3.3 Standardizing and aggregating data
To compare the different indicators it is necessary to Fig. 4: z-transformation
xi − x
standardize the values. One method to standardize is by z-
transformation (see formula). This method transforms all
indicator values into standardized values with an average 0
and a standard deviation 1. It has the advantage to consider i z =
the heterogeneity within groups and maintain its metric s
information. Furthermore a high sensitivity towards changes
is achieved.
To receive results on the level of factors, characteristics and the final result for each
city, it is necessary to aggregate the values on the indicator level. For the
aggregation of indicators of factors we consider also the coverage rate of each
indicator. A certain result from an indicator of an indicator covering all 70 cities
weights therefore a little more than an indicator covering only 60 cities. Besides this
small correction the results were aggregated on all levels without any weighting. The
aggregation was done additive but divided through the number of values added. That
allows us to include also cities which do not cover all indicators. Their results are
calculated with the values available. Still, it is necessary to provide a good coverage
over all cities to receive reasonable results.
4
Ministère de la culture et de la communication, Délégation au développement et aux affaires
internationales (DDAI). Département des études, de la prospective et des statistiques (Deps): L’emploi
culturel dans l’Union européenne en 2002. Données de cadrage et indicateurs. Paris, 2005
14Smart cities – Ranking of European medium-sized cities
4 Results and dissemination
4.1 Performance of 70 cities
In the final ranking Scandinavian Fig. 5: City sample and total rating
cities and cities from the Benelux
countries and Austria are ranked in
the top group. Also Montpellier and
Ljubljana achieve top ratings. The
cities ranked lowest are mainly in the
new EU-member states. Within the
respective characteristics a similar
picture can be recognised. Still, also
some differences appear. The best
rating in Smart Economy achieve
Luxembourg, British, Irish and Danish
cities as well as Eindhoven,
Regensburg, Ljubljana and Linz.
Smart People is led by Scandinavian
cities as well as Dutch cities and
Luxembourg. Again Scandinavian and
also Austrian cities achieve a very The darker the colour the better the rating
good rating in Smart Governance. The
rating for Smart Mobility is very good in cities from Benelux countries and Denmark.
Smart Environment is fairly different from the total rating. French, Slovenian and
Greek cities as well as Timisoara achieve top ratings in this characteristic. The sixth
characteristic, Smart Living, is lead by Austrian, Belgian and two Finnish cities as
well as Luxembourg and Umeå. The following graph illustrates the composition of the
total rating by characteristics for each city. It also allows a first evaluation of
strengths and weaknesses of certain cities or groups of cities.
Fig. 6: Final rating and composition by characteristics
15Smart cities – Ranking of European medium-sized cities
Tab. 4: Final results and performance in characteristics
cc city Smart Smart Smart Smart Smart Smart total
Economy People Governance Mobility Environment Living
LU LUXEMBOURG 1 2 13 6 25 6 1
DK AARHUS 4 1 6 9 20 12 2
FI TURKU 16 8 2 21 11 9 3
DK AALBORG 17 4 4 11 26 11 4
DK ODENSE 15 3 5 5 50 17 5
FI TAMPERE 29 7 1 27 12 8 6
FI OULU 25 6 3 28 14 19 7
NL EINDHOVEN 6 13 18 2 39 18 8
AT LINZ 5 25 11 14 28 7 9
AT SALZBURG 27 30 8 15 29 1 10
FR MONTPELLIER 30 23 33 24 1 16 11
AT INNSBRUCK 28 35 9 8 40 3 12
AT GRAZ 18 32 12 17 31 5 13
NL NIJMEGEN 24 14 14 3 51 24 14
NL GRONINGEN 14 9 15 20 37 13 15
BE GENT 19 16 31 7 48 4 16
SI LJUBLJANA 8 11 43 31 3 29 17
NL MAASTRICHT 26 18 17 1 43 14 18
SE JOENKOEPING 36 10 7 34 22 26 19
BE BRUGGE 23 20 29 18 44 2 20
NL ENSCHEDE 31 17 16 4 35 23 21
DE GOETTINGEN 11 34 20 12 15 31 22
SE UMEAA 39 5 10 36 46 10 23
DE REGENSBURG 9 40 27 19 38 22 24
FR DIJON 38 29 22 26 9 25 25
FR NANCY 41 31 23 25 10 20 26
DE TRIER 21 44 19 10 18 33 27
FR CLERMONT-FERRAND 33 33 26 29 7 27 28
FR POITIERS 48 37 28 33 8 15 29
SI MARIBOR 49 21 37 40 2 32 30
IE CORK 2 26 25 45 66 21 31
DE ERFURT 32 47 21 13 21 45 32
DE MAGDEBURG 47 50 35 22 17 39 33
DE KIEL 45 45 48 16 23 38 34
HR ZAGREB 34 24 32 39 36 42 35
UK CARDIFF 13 39 44 38 60 30 36
UK LEICESTER 3 42 49 32 64 40 37
UK PORTSMOUTH 7 38 47 35 63 43 38
UK ABERDEEN 10 28 42 42 67 35 39
EE TARTU 40 15 30 47 49 60 40
ES PAMPLONA 22 48 39 51 32 41 41
CZ PLZEN 43 49 61 30 54 28 42
ES VALLADOLID 44 53 34 54 24 46 43
CZ USTI NAD LABEM 54 51 55 23 55 36 44
IT TRENTO 20 57 24 65 30 48 45
PT COIMBRA 52 63 54 49 16 37 46
SK NITRA 62 46 51 52 19 44 47
PL RZESZOW 69 19 53 41 56 50 48
IT TRIESTE 12 61 40 67 45 57 49
ES OVIEDO 37 55 38 44 68 34 50
IT ANCONA 35 59 36 68 34 49 51
IT PERUGIA 42 54 41 66 42 51 52
PL BIALYSTOK 67 22 59 56 47 55 53
SK KOSICE 66 43 50 48 53 52 54
RO TIMISOARA 50 64 64 62 4 59 55
SK BANSKA BYSTRICA 70 41 52 53 58 47 56
PL BYDGOSZCZ 68 27 57 46 52 61 57
GR PATRAI 59 58 46 60 5 67 58
LT KAUNAS 55 36 66 55 27 65 59
GR LARISA 61 60 45 63 6 66 60
HU GYOR 46 68 62 37 41 63 61
PL SZCZECIN 65 52 58 43 59 56 62
RO SIBIU 57 65 60 64 13 62 63
PL KIELCE 63 56 56 57 62 54 64
HU PECS 56 62 65 58 65 53 65
LV LIEPAJA 60 12 63 61 61 70 66
HU MISKOLC 58 67 67 50 70 58 67
RO CRAIOVA 64 66 68 70 33 64 68
BG PLEVEN 51 70 69 69 57 69 69
BG RUSE 53 69 70 59 69 68 70
16Smart cities – Ranking of European medium-sized cities
4.2 City profiles
The analysis in characteristics allows already a broad outline of strengths and
weaknesses of the included cities. However, a more detailed analysis is necessary
because the performance within the respective characteristics or even within factors
can vary. The transparent structure of the ranking-approach enables a quick insight
into characteristics and factors, providing detailed city profiles. The following graph
shows a detailed profile of Luxembourg, ranked on first place in the final ranking.
Luxembourg has in every Fig. 7: Profile of Luxembourg
characteristic a rating above
average. Especially in Smart
Economy is Luxembourg far above
the average of all 70 cities. Still,
even in this characteristic we can
see a different picture when
zooming on the level of factors.
Three factors, economic image,
productivity and international
embeddedness are extraordinary
well rated while the other three are
closer to the average but still
above. An even more diverse rating
is within Smart People. One can see
that the very good rating on the
level of characteristics is mainly
caused by the very good
performance in the factor social and
ethnic plurality. On the other hand,
the factors creativity and flexibility
are even under average. We can
even have a deeper look on the
results by changing one level lower
to the level of indicators.
The figure to the right Fig. 8: Luxembourg – Performance in Smart People
illustrates the performance of
Luxembourg in Smart People on
the level of indicators. While
some factors comprise quite
homogeneous indicators as
Cosmopolitanism or
Participation in public life,
others offer a diverse picture.
Within the factor Level of
qualification Luxembourg
achieves a relatively weak
rating as knowledge centre – an
indicator describing the quality of research centres and universities on a European
scale. On the other hand the citizens of Luxembourg have language skills (at least
one foreign language) far above-average. The analysis on the level of indicators
provides most detailed information on a city’s comparative performance.
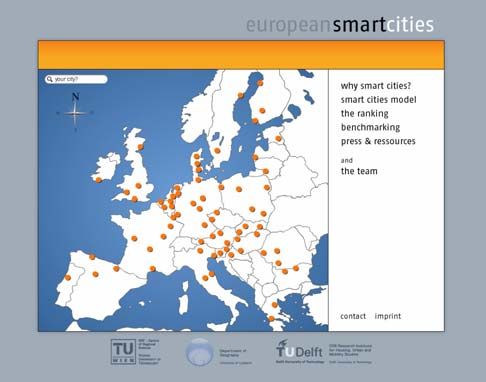
17Smart cities – Ranking of European medium-sized cities 4.3 Dissemination Besides this report, the most Fig. 9: Project homepage important results are available on the project homepage, www.smart- cities.eu. With the implemented online database it is possible to get an insight view on the 70 cities and their comparative strengths and weaknesses on the level of characteristics and factors. Besides, all project partners gave interviews to several newspapers in the Netherlands, Luxemburg (German and French newspapers), Germany and, most of all, in Austria. In particular, some cities www.smart-cities.eu (resp. their marketing sections) got into contact with us in order to get comprehensive information about their cities resp. on the factor and indicator scores. 4.4 Outlook This study was the first of its kind to focus on medium-sized cities, thereby considering a broad range of factors and indicators, inherent to the concept of ‘smart cities’. As was stated before, rankings can only be meaningful when the data- collection and analysis has been carried out in a transparent way (and hence, its results should be reproducible by others). Moreover, this transparency allows considering the ranking of medium-sized cities from various viewpoints. Which one prevails, depends on the objective of the user of the information and his/her needs. With other words, the consideration of different characteristics, factors and indictors in an non-weighted way expresses that the authors are convinced that urban development is a complex process in different dimensions and its perception and evaluation, finally, depends on the actors themselves resp. their preferences and individual objectives. However, we do not have a complete overview about the perception of our study through corresponding actors across Europe, but we have got the impression that this ranking approach detected a niche within existing rankings and some of the medium- sized cities are very much aware of its usefulness for their own positioning. In front of these first reactions from newspapers and concerned cities two conclusions can be done: First, some of the medium-sized cities resp. their marketing and planning sections are already aware of this increasing pressure of competition and their need for positioning within the European urban system. Thus, strategic advice through such a ranking and through the benchmarking with other cities along characteristics and factors seems to be useful for them. In particular some recent remarks and questions even let expect that a more detailed policy advice is in their interest. Of course, this policy advice could be realized on the base of the indicator scores identifying fields 18
Smart cities – Ranking of European medium-sized cities

of action according to strengths and weaknesses and advising the most effective
governance approaches between competition and cooperation.

Second, this approach concerns a large number of cities and citizens in Europe. 120
mio. or 40 % of all urban citizens live in cities with a population between 100,000 and
500,000 inhabitants. These 600 cities figure as the engines of economic development
in space. Because of their large number they are the most decisive actors in order to
make Europe more competitive and at the same time to make spatial development
more sustainable. Thus, this group should be object of further investigation in order
to identify their recent strengths and weaknesses and their perspectives in
positioning.

Fig. 10: Population in medium-sized cities in Europe

Source: Data derived from Nordregio et al (2004) Espon 1.1.1

Concluding, this research project presents a current overview of European medium-
sized cities, but an analysis of time-series data was beyond its scope. Such an
exercise, however, would be extremely useful, as smart city development is perhaps
more concerned with making progress as concerns the smart indicators rather than a
cities’ positioning in a ranking – which inevitably is a snapshot in time. Nevertheless,
the ranking features innovative aspects and results:
   -   Focus on medium-sized cities, a class of cities normally neglected in
       international comparative analyses
   -   Analysis of characteristics and factors decisive for a successful forward-
       looking city development
   -   Use of a transparent and comprehensive catalogue of indicators, using data
       from official, public and freely available sources
   -   Elaboration of detailed city profiles on the basis of 74 indicators providing
       applicable statements on comparative strengths and weaknesses

Perhaps it would not be an exaggeration to say that truly smart cities use this city-
ranking as a tool to benchmark with other cities, and draw lessons from better
performing cities, perhaps resulting in policy transfer. This should become evident in
a follow-up to this project that will allow an assessment of the cities performance in
each smart characteristic.

                                                                                               19
Smart cities – Ranking of European medium-sized cities 20
Smart cities – Ranking of European medium-sized cities

5 Annex
Literature

Begg I. (1999): Cities and Competitiveness, in Urban Studies, Vol. 36, Nos 5-6, S. 795-
      810.

Nordregio et al (2004) ESPON 1.1.1: Potentials for polycentric development in
     Europe, Project report. Stockholm/Luxembourg: Nordregio/ESPON Monitoring
     Committee.

Parkinson, M., Hutchins, M., Simmie, J., Clark, G. and Verdonk, H. (Eds.) (2003):
      Competitive European Cities: Where Do The Core Cities Stand?.

Schönert, M. (2003): Städteranking und Imagebildung: Die 20 größten Städte in
     Nachrichten- und Wirtschaftsmagazinen. In: BAW Monatsbericht 2/03, S.1-8

Thornley A. (2000): Strategic Planning in the Face of Urban Competition. In: Salet,
     W. – Faludi, A. (eds) 2000: The Revival of Strategic Spatial Planning.
     Proceedings of colloquim. Royal Netherlands Academy of Arts and Sciences.
     Amsterdam

                                                                                            21
Smart cities – Ranking of European medium-sized cities
Tab. 5: List of indicators
factor indicator year level
Innovative spirit R&D expenditure in % of GDP 2003 regional
Employment rate in knowledge-intensive sectors 2004 regional
Patent applications per inhabitant 2003 regional
Entrepreneurship Self-employment rate 2001 local
New businesses registered 2001 local
Smart Economy
Economic image Importance as decision-making centre (HQ etc.) 2007 regional
& trademarks
Productivity GDP per employed person 2001 local
Flexibility of Unemployment rate 2005 regional
labour market
Proportion in part-time employment 2001 local
International Companies with HQ in the city quoted on national 2001 local
embeddedness stock market
Air transport of passengers 2003 regional
Air transport of freight 2003 regional
Level of Importance as knowledge centre (top research centres, 2007 regional
qualification top universities etc.)
Population qualified at levels 5-6 ISCED 2001 local
Foreign language skills 2005 national
Affinity to life Book loans per resident 2001 local
long learning
Participation in life-long-learning in % 2005 regional
Participation in language courses 2005 national
Smart People
Social and ethnic Share of foreigners 2001 local
plurality
Share of nationals born abroad 2001 local
Flexibility Perception of getting a new job 2006 national
Creativity Share of people working in creative industries 2002 national
Cosmopolitanism/ Voters turnout at European elections 2001 local
Open-mindedness
Immigration-friendly environment (attitude towards 2006 national
immigration)
Knowledge about the EU 2006 national
Participation in Voters turnout at city elections 2001 local
public life
Participation in voluntary work 2004 national
Participation in City representatives per resident 2001 local
decision-making
Political activity of inhabitants 2004 national
Smart Governance
Importance of politics for inhabitants 2006 national
Share of female city representatives 2001 local
Public and social Expenditure of the municipal per resident in PPS 2001 local
services
Share of children in day care 2001 local
Satisfaction with quality of schools 2005 national
Transparent Satisfaction with transparency of bureaucracy 2005 national
governance
Satisfaction with fight against corruption 2005 national
22Smart cities – Ranking of European medium-sized cities
factor indicator year level
Local Public transport network per inhabitant 2001 local
accessibility
Satisfaction with access to public transport 2004 national
Satisfaction with quality of public transport 2004 national
Smart Mobility
(Inter-)national International accessibility 2001 regional
accessibility
Availability of Computers in households 2006 national
ICT-
Broadband internet access in households 2006 national
infrastructure
Sustainable, Green mobility share (non-motorized individual traffic) 2001 local
innovative and
Traffic safety 2001 local
safe transport
systems Use of economical cars 2006 national
Attractivity of Sunshine hours 2001 local
natural
Green space share 2001 local
conditions
Smart Environment
Pollution Summer smog (Ozon) 2001 local
Particulate matter 2001 local
Fatal chronic lower respiratory diseases per inhabitant 2004 regional
Environmental Individual efforts on protecting nature 2004 national
protection
Opinion on nature protection 2006 national
Sustainable Efficient use of water (use per GDP) 2001 local
resource
Efficient use of electricity (use per GDP) 2001 local
management
Cultural facilities Cinema attendance per inhabitant 2001 local
Museums visits per inhabitant 2001 local
Theatre attendance per inhabitant 2001 local
Health conditions Life expectancy 2001 local
Hospital beds per inhabitant 2001 local
Doctors per inhabitant 2001 local
Satisfaction with quality of health system 2004 national
Individual safety Crime rate 2001 local
Death rate by assault 2001-03 regional
Smart Living
Satisfaction with personal safety 2004 national
Housing quality Share of housing fulfilling minimal standards 2001 local
Average living area per inhabitant 2001 local
Satisfaction with personal housing situation 2004 national
Education Students per inhabitant 2001 local
facilities
Satisfaction with access to educational system 2004 national
Satisfaction with quality of educational system 2004 national
Touristic Importance as tourist location (overnights, sights) 2007 regional
attractivity
Overnights per year per resident 2001 local
Social cohesion Perception on personal risk of poverty 2006 national
Poverty rate 2005 national
23Smart cities – Ranking of European medium-sized cities
Tab. 6: City sample
Austria Germany Poland
GRAZ ERFURT BIALYSTOK
INNSBRUCK GOETTINGEN BYDGOSZCZ
LINZ KIEL KIELCE
SALZBURG MAGDEBURG RZESZOW
REGENSBURG SZCZECIN
Belgium TRIER
Portugal
BRUGGE
Greece
GENT COIMBRA
LARISA
Bulgaria PATRAI Romania
PLEVEN CRAIOVA
Hungary
RUSE SIBIU
GYOR TIMISOARA
Croatia MISKOLC
PECS Slovakia
ZAGREB
BANSKA BYSTRICA
Czech Republic Ireland
KOSICE
PLZEN CORK NITRA
USTI NAD LABEM
Italy Slovenia
Denmark ANCONA LJUBLJANA
AALBORG PERUGIA MARIBOR
AARHUS TRENTO
TRIESTE Spain
ODENSE
OVIEDO
Estonia Latvia
PAMPLONA
TARTU KAUNAS VALLADOLID
Finland Lithuania Sweden
OULU LIEPAJA JOENKOEPING
TAMPERE UMEAA
Luxembourg
TURKU
United Kingdom
LUXEMBOURG
France ABERDEEN
Netherlands CARDIFF
CLERMONT-FERRAND
DIJON EINDHOVEN LEICESTER
MONTPELLIER ENSCHEDE PORTSMOUTH
NANCY GRONINGEN
POITIERS MAASTRICHT
NIJMEGEN
24Smart cities – Ranking of European medium-sized cities
25Smart cities
Ranking of European medium-sized cities
Final report
Edited by the Centre of Regional Science, Vienna UT
www.smart-cities.eu
October 2007
Centre of Regional Department of Research Institute for Housing,
Science (SRF) Geography Urban and Mobility Studies
(OTB)
Vienna University of University of
Technology Ljubljana Delft University of TechnologyYou can also read