Office Market: Investment Opportunities in German Secondary Locations - Survey Client: DEMIRE - Deutsche Mittelstand Real Estate AG Frankfurt am ...
←
→
Page content transcription
If your browser does not render page correctly, please read the page content below
Survey
Office Market: Investment Opportunities in
German Secondary Locations

Client: DEMIRE - Deutsche Mittelstand Real Estate AG
Frankfurt am Main, April 2018
SURVEY                                                                                                              bulwiengesa
OFFICE MARKET: INVESTMENT OPPORTUNITIES IN GERMAN SECONDARY
LOCATIONS

TABLE OF CONTENTS
                                                                                                                                                 Page

         PRELIMINARY REMARK                                                                                                                         1

1        EXECUTIVE SUMMARY                                                                                                                          2

2        THE PECULIARITIES OF GERMANY’S OFFICE REAL ESTATE MARKET                                                                                   4

3        FOCUS SUBJECT: THE OFFICE REAL ESTATE MARKETS OF GERMANY’S SECOND-TIER CITIES                                                              7

4        PERFORMANCE POTENTIAL OF SECOND-TIER CITIES                                                                                               16

         SUMMARY OF FINDINGS                                                                                                                       18

         ANNEX

PROPRIETARY INFORMATION
The results and figures presented in this survey have been conducted          led to disclose the survey or parts hereof (always citing the source) for
on the basis of existing and compiled sources according to the best of        the purpose agreed at the time the survey was commissioned. The re-
our knowledge and with appropriate care. A guarantee for factual accu-        production, publication and dissemination of contents to any third party
racy can only be made with regard to information and data that has            is not permitted except after prior written authorization by bulwiengesa
been elaborated by bulwiengesa AG themselves. A guarantee for the             AG (original source must be cited). Exempt from the foregoing is the
factual accuracy of data and information provided by third parties can-       use of this evaluation or parts thereof for marketing brochures. In this
not be made.                                                                  case, prior written approval must be requested from the bulwiengesa
                                                                              AG without exception. The results are interpreted and assessed in the
bulwiengesa AG remains the owner of this survey (electronic or printed        context of bulwiengesa AG'S experience in its German and European
form) until the agreed fee has been fully paid. The survey is protected       research and consultancy activities.
by copyright and registered by bulwiengesa AG. Only the client is entit-

    bulwiengesa AG

    Eschersheimer Landstr. 10   Vorstand:            Aufsichtsratsvorsitzender:   Hauptsitz: Berlin              HypoVereinsbank München
    60322 Frankfurt am Main     Ralf-Peter Koschny   Hartmut Bulwien              Rechtsform: AG                 BLZ: 70020270, Kto.: 4410433058
    Tel. +49 69 75 61 467-60    Andreas Schulten     info@bulwiengesa.de          USt-ID: DE 164508347           BIC: HYVEDEMMXXX
    Fax +49 69 75 61 467-69     Thomas Voßkamp       www.bulwiengesa.de           Charlottenburg HRB 95407 B     IBAN: DE13700202704410433058

© bulwiengesa AG 2018 – P1802-4264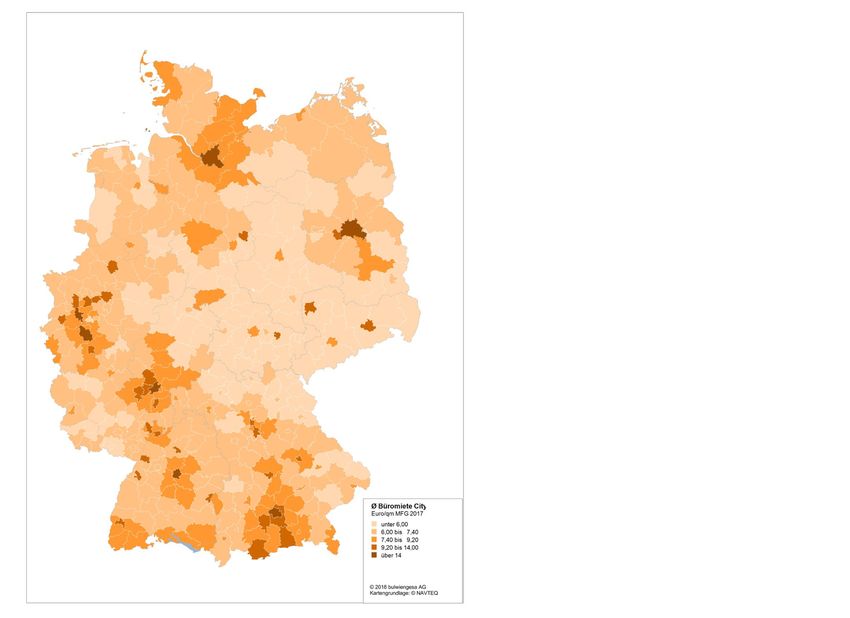
SURVEY bulwiengesa
OFFICE MARKET: INVESTMENT OPPORTUNITIES IN GERMAN SECONDARY
LOCATIONS
PRELIMINARY REMARK About the Methodology
DEMIRE (Deutsche Mittelstand Real Estate AG) has commer- The idea is to raise awareness for, and the transparency of,
cial real estate holdings in mid-sized cities and in up-and-co- Germany’s second-tier cities, and the real estate market data
ming locations on the periphery of German metro regions. To of our proprietary RIWIS1 information system will be used to-
raise awareness for so-called second-tier cities, DEMIRE as- ward this end.
ked bulwiengesa to conduct an analysis of selected cities in
Germany, this being the second edition of the survey that was
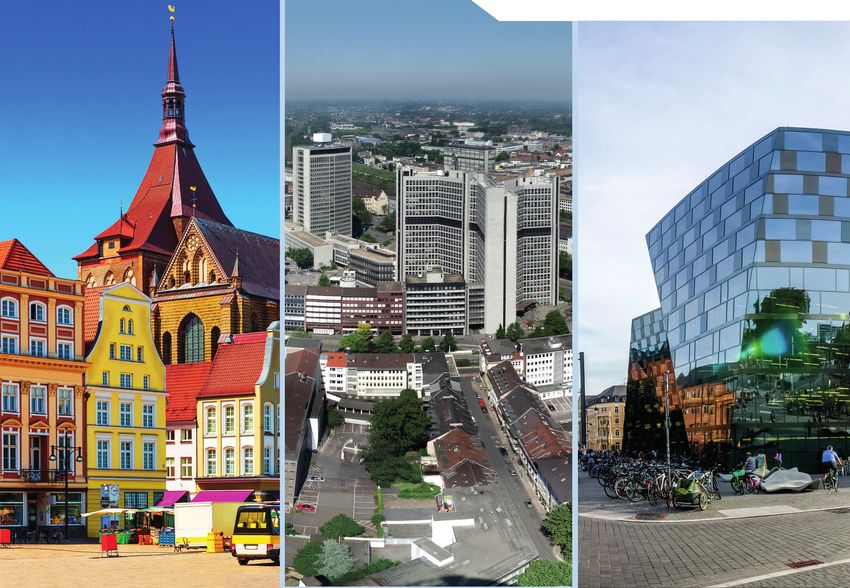
conducted for the first time in 2017. Overview of Second-Tier Cities
The survey focuses on the office segment. The analysed cities
are depicted in the map chart below. Compared to the 2017
survey, the selection of analysed cities was expanded by ad-
ding another ten cities (Lüneburg, Ingolstadt, Kempten, Reutlin-
gen, Karlsruhe, Mannheim, Potsdam, Jena, Chemnitz and Es-
sen) to the survey.
Survey Structure
The survey now before you divides into four chapters that are
thematically interlinked. It starts with an Executive Summary
that outlines the return / risk representation of the second-tier
cities. The subsequent chapter will elaborate the structure of
Germany’s office real estate market. To put it into perspective,
this snapshot will be compared to the office markets in France
and the United Kingdom. The primary parameter in this context
will be the distribution of the office take-up in the cities of each
country. Another benchmark compared in the chapter is the
gross value added. The third chapter will conduct a detailed
analysis of the second-tier cities by comparing them to Ger-
many’s seven Class A cities. Parameters used for this compari-
son include the trends in office occupancy, in office vacancy, in
office employment and in office take-up as well as construction
activity, transaction volume and net initial yields. With the mar-
ket environment in the second-tier cities established in the third
chapter, the final chapter will discuss the yield upside of value-
add properties in the secondary cities. The chapter will also
present an asset managed by DEMIRE in Leipzig (Gutenberg-
galerie) to illustrate the points made. The survey will conclude Source: © NAVTEQ
with a summary of the key findings in tabular form.
1
RIWIS = bulwiengesa’s proprietary regional information system for
Germany’s real estate industry.
© bulwiengesa AG 2018 – P1802-4264 Page 1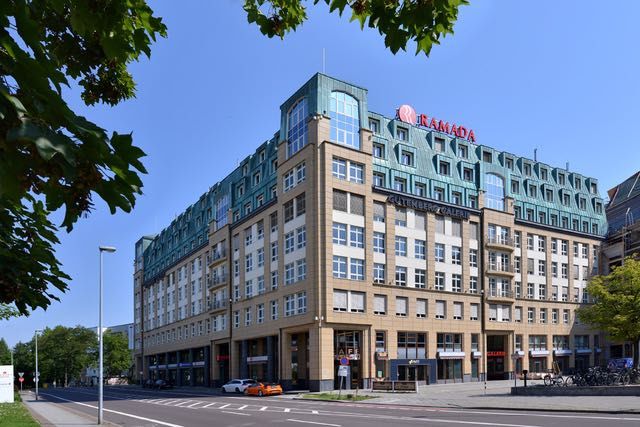
SURVEY                                                                                                   bulwiengesa
OFFICE MARKET: INVESTMENT OPPORTUNITIES IN GERMAN SECONDARY
LOCATIONS

1      EXECUTIVE SUMMARY                                               Trend in Office Take-up
                                                                       The office take-up, meaning the volume in lettings and owner-
The market action in France and the United Kingdom is domi-            occupancy, mirrors the dynamic and activity of a given market.
nated by their first cities, Paris and London, respectively. Com-      The sensible thing to do prior to investment decisions is to en-
pared to these and other countries in Europe, the German of-           sure the investment asset is of market-consistent size. The re-
fice real estate market is characterised by a different market         lation of the take-up to the underlying stock reflects the propen-
structure – a polycentric one. In addition to Germany’s "Big           sity of tenants to relocate. The latter is much more pronounced
Seven", there are other cities characterised by dynamic market         in the Class A markets than in the second-tier cities.
action and positive economic parameters. For investors, these
present interesting investment opportunities. The market dyna-
mics of selected second-tier cities was therefore investigated         Investment Market
for the purposes of this survey, using a variety of different para-    In the absence of investment opportunities and low yield ex-
meters. The analysis returned the following findings:                  pectations in the markets of the Class A cities, players invest
                                                                       increasingly in second-tier cities. In 2017, approximately 27,5
                                                                       billion euros were invested outside the major metropolises –
Trend in Average Rents                                                 thereof 15 billion euros in second-tier cities. The heightened in-
In the wake of country’s upbeat economic development, the              terest in the second-tier cities is explained by the higher yield
German office markets has shown a rather handsome perfor-              average combined with a very stable rent level. While rising de-
mance in recent years. The Class A markets, for instance,              mand will push the net initial yields down to historic lows even
achieved rent growth rates of 28 % over the past ten years.            in the second-tier cities, the yield spread between these mar-
Some of the small locations (second-tier cities) registered an         kets and the Class A cities is still considerable at 2 percentage
even brisker performance, reflected in rent hikes of over 40 %.        points.

Trend in New Office Completions                                        Risk / Return Representation
Speculative building activity (without pre-lettings) could push up     Within the framework of the present survey, the Class A mar-
vacancy rates in time of slowing demand. Unlike in the Class A         kets and secondary markets were also studied in regard to
markets, where the share of unlet floor area approximates              their stability of income and the achievable return on invest-
40 % at the start of a given project, new developments in se-          ment. The findings are represented in the chart on the next
cond-tier cities are generally aligned with demand, i.e. they          page. They suggest that the yield upside is higher in every one
tend to show a high pre-let ratio. It is a good way to reduce the      of the second-tier cities than in the Class A markets. The bra-
risk associable with market upheavals.                                 cket of achievable net initial yields extends from 4.1 % in Bonn
                                                                       to 7.0 % in Stralsund and Chemnitz. By contrast, the average
                                                                       achieved in Class A cities is only 3.2 %. The already mentioned
Trend in Vacancies                                                     stability of income in many of the second-tier cities is reflected
The vacancy rate represents a given office market’s share of           in the rent volatility as well: Markets like Bonn and Dortmund,
available floor area, and is an important indicator for the situati-   for instance, show a very low spread of rents, thereby minimi-
on on that market. In nearly all Class A cities, the bullish perfor-   sing the risk of rent corrections on the market side. Conversely,
mance of the office markets helped to bring down vacancies             locations like Berlin and Munich – but also places like Kempten
significantly. Analogously, several second-tier cities also regis-     and Regensburg – combine market fluctuations with a compa-
tered a substantial reduction of their vacant office space. The        ratively high rent volatility.
trend is explained, on the one hand, by a rise in demand and,
on the other hand, by a demand-driven number of completions.           To put the return potential and the earnings risk in relation, a
                                                                       quotient of yield and volatility was created. It is mapped in the
                                                                       chart on the next page. As the chart suggests, cities like Bonn
Trend in Office Jobs                                                   and Dortmund have very favourable relations, whereas the
The development of office employment is an important demand            Class A cities (Berlin, Munich and Hamburg) and even Leipzig
indicator for office accommodation. The highly positive econo-         are found at the bottom of the list because of their massive rent
mic conditions of recent years triggered a fast increase in office     fluctuations.
employment, with growth rates of 19 % reported from the Class
A cities and of up to 39 % from the second-tier cities. Going for-
ward, the office job growth is expected to continue and to have
a favourable effect on the market situation.

© bulwiengesa AG 2018 – P1802-4264                                                                                                Page 2
SURVEY bulwiengesa
OFFICE MARKET: INVESTMENT OPPORTUNITIES IN GERMAN SECONDARY
LOCATIONS
Risk / Return Representation
7.5
Class A cities
Selected second-tier cities
7.0 11 18
6.5 21
Return (net initial yield, 2017, in %)
3
6.0 5 889/ 9 2020
22
/ 22 33
12
15
14
5.5 29
6
17
5.0 26 30
32 34
16
2 10 28
4.5 4 13
23 27 31 35
1
4.0
7
24
3.5 19
25
36
3.0 38
37
2.5
0 0.02 0.04 0.06 0.08 0.1 0.12 0.14 0.16
Rent volatility (coefficient of variation = relative standard deviation of the average rent*)
Selection of cities** sorted by return- / risk-quotient***
1 Bonn Sec.-tier cities 14 Leverkusen Sec.-tier cities 27 Münster Sec.-tier cities
2 Dortmund Sec.-tier cities 15 Wuppertal Sec.-tier cities 28 Dresden Sec.-tier cities
3 Koblenz Sec.-tier cities 16 Bremen Sec.-tier cities 29 Kassel Sec.-tier cities
4 Essen Sec.-tier cities 17 Ulm Sec.-tier cities 30 Osnabrück Sec.-tier cities
5 Bayreuth Sec.-tier cities 18 Stralsund Sec.-tier cities 31 Freiburg (B.) Sec.-tier cities
6 Rostock Sec.-tier cities 19 Stuttgart A cities 32 Potsdam Sec.-tier cities
7 Düsseldorf A cities 20 Jena Sec.-tier cities 33 Kempten (Allgäu) Sec.-tier cities
8 Flensburg Sec.-tier cities 21 Schwerin Sec.-tier cities 34 Regensburg Sec.-tier cities
9 Göttingen Sec.-tier cities 22 Lüneburg Sec.-tier cities 35 Leipzig Sec.-tier cities
10 Darmstadt Sec.-tier cities 23 Karlsruhe Sec.-tier cities 36 Hamburg A cities
11 Chemnitz Sec.-tier cities 24 Cologne A cities 37 Berlin A cities
12 Reutlingen Sec.-tier cities 25 Frankfurt A cities 38 Munich A cities
13 Mannheim Sec.-tier cities 26 Ingolstadt Sec.-tier cities
*The relative standard deviation (average rent) refers to the period between 2008 and 2017.
**Cities shaded in yellow were added to the survey since the previous edition of 2017.
***The risk/return quotient is obtained by dividing the net initial yield by the relative standard deviation of the average rent.
Source: RIWIS
© bulwiengesa AG 2018 – P1802-4264 Page 3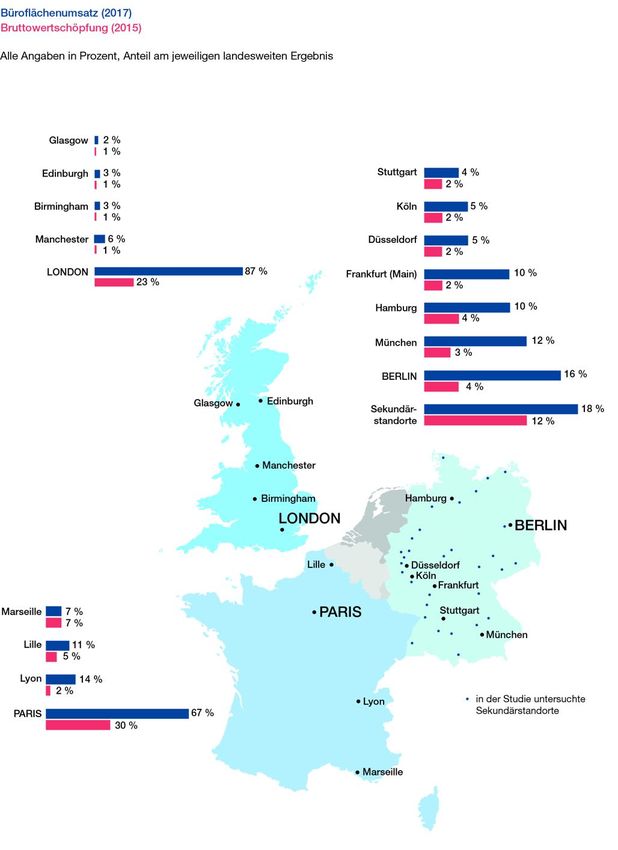
SURVEY                                                                                                   bulwiengesa
OFFICE MARKET: INVESTMENT OPPORTUNITIES IN GERMAN SECONDARY
LOCATIONS

2      THE PECULIARITIES OF GERMANY’S                                                      Office Take-up (2017)
       OFFICE REAL ESTATE MARKET
                                                                      City                     Office Take-up                in %
In addition to the seven metropolises (among them Hamburg,
Berlin and Munich), Germany’s office real estate market inclu-        France (FR)
des a large number of second-tier cities, some of which show a        Marseille                  564,600 sqm                 7%
brisk market dynamic. In order to structure the hierarchy of
                                                                      Lille                      881,600 sqm                 11 %
German metropolises and second-tier cities, bulwiengesa cate-
gorised them into Class A through Class D cities according to         Lyon                      1,092,200 sqm                14 %
their functional significance. The categorisation is based on the     Paris Central             5,222,700 sqm                67 %
performance of different parameters such as office take-up or
prime rent. The next chapter will highlight the peculiarities of      FR total                  7,761,100 sqm               100 %
the German office real estate market.                                 United Kingdom (UK)
                                                                      Glasgow                    60,200 sqm                  2%
Comparing Germany, France and the United Kingdom – in
Terms of Office Take-up                                               Edinburgh                  95,700 sqm                  3%
                                                                      Birmingham                 121,700 sqm                 3%
The map at the end of this chapter shows, inter alia, the distri-
bution of the office take-up among Germany’s "Big Seven" cit-         Manchester                 198,300 sqm                 6%
ies and the examined second-tier cities in 2017, along with se-       London Central            3,064,800 sqm                87 %
lected cities in France (Lille, Lyon, Marseille, Central Paris) and
in the United Kingdom (Birmingham, Edinburgh, Glasgow, Cen-           UK total                  3,540,700 sqm               100 %
tral London, Manchester). It clearly reveals the difference bet-      Germany (GER)
ween the polycentric market structure of Germany and the refe-
                                                                      Stuttgart                  264,000 sqm                 4%
rence countries: In France, around 67 % of the take-up is con-
centrated in a single city – Central Paris – while the office mar-    Cologne                    307,000 sqm                 5%
ket in Central London accounts for around 87 % of the take-up         Düsseldorf                 325,000 sqm                 5%
in the UK. Within the Central London market, about 51 % is ab-
sorbed in the City of London and around 41 % in London’s              Frankfurt (Main)           624,000 sqm                 10 %
West End and Midtown.                                                 Hamburg                    635,000 sqm                 10 %
                                                                      Munich                     750,000 sqm                 12 %
By contrast, Germany’s seven leading metropolises, taken to-
gether, only account for a combined take-up share of around           Berlin                    1,010,000 sqm                16 %
62 %, and the examined second-tier cities only for about 18 %.
                                                                      second-tier cities        1,117,000 sqm                18 %
Out of the total, the highest take-up was registered in Berlin
with a share of around 16 %. In 2017, the German capital actu-        other cities              1,223,800 sqm                20 %
ally set a new record with an office take-up of about 1,010,000       GER total                 6,255,800 sqm               100 %
sqm RAC. This increase in take-up is based on the sustained
                                                                      Sources: PMA (France / United Kingdom);
growth of the service industry and the TMT sector (technolo-          bulwiengesa (Germany)
gies, media and telecommunication), which also accounts for
the majority of start-ups. The city with the smallest share of the    Interim Summary
"Big Seven" take-up total is Stuttgart, accounting for around         Compared to other European countries, the take-up in Germany is
4 %.                                                                  not concentrated in a single metropolis but spread across a number
                                                                      of diverse cities. With these parameters in mind, the German office
                                                                      market should be understood as having a polycentric structure.

© bulwiengesa AG 2018 – P1802-4264                                                                                                  Page 4
SURVEY                                                                                                   bulwiengesa
OFFICE MARKET: INVESTMENT OPPORTUNITIES IN GERMAN SECONDARY
LOCATIONS

Comparing Germany, France and the United Kingdom –
                                                                                     Gross Value Added (GVA)* (2015)
in Terms of Gross Value Added (GVA)
                                                                                                       GVA
                                                                     City / Region                                             in %
Another criterion for comparing the market structures in Fran-                                    (in Mio. Euro)
ce, the United Kingdom and Germany is the parameter of the           France (FR)
gross value added. The gross value added is an indicator for
the economic performance of a given municipality. The subse-         Provence-Alpes-Côte             136,574                    7%
quent table shows the gross value added in selected cities and       d'Azur (Marseille)
regions in France, the United Kingdom and Germany in 2015.           Nord-Pas-de-Calais
                                                                                                      97,546                    5%
                                                                     (Lille)
Here as elsewhere, the polycentric market structure in Ger-
                                                                     Auvergne (Lyon)                 32,615                     2%
many becomes apparent: In greater London, roughly 23 % of
the UK’s entire gross value added is being generated. Other          Île de France (Paris)           589,843                   30 %
British cities such as Glasgow or Manchester account for only        rest FR                        1,093,245                  56 %
about 1 % each. In France, the Île de France region, which in-
cludes Paris among other cities, delivers an actual 30 % of the      FR total                       1,949,824                 100 %
country’s gross value added. The other regions show figures          United Kingdom (UK)
between 2 % and 7 %.
                                                                     Glasgow City                    27,036                     1%
This contrasts with the German Class A cities, which collective-     Edinburgh City                  25,401                     1%
ly generate only a gross value-added share of around 19 %.
                                                                     Birmingham                      34,154                     1%
Berlin and Hamburg make the highest single contributions to
the gross value added with a share of around 4 %. The Hanse-         Manchester                      23,462                     1%
atic City of Hamburg is one of Germany’s leading business lo-        London (Region)                 521,360                   23 %
cations. Home to the third-largest port in Europe, the city has a
domestic and international significance that radiates far into the   rest GB                        1,665,049                  73 %
metro region. The fact is reflected not least in the city’s econo-   UK total                       2,296,462                 100 %
mic key ratios – such as gross value added per employee. At
                                                                     Germany (GER)
approximately 81,000 euros per employee (2015), the ratio is
well above the German average (63,000 euros/employee). Si-           Stuttgart                       46,031                     2%
milarly, the GVA in Berlin was characterised by steady growth        Cologne                         55,850                     2%
over the past years, achieving a new all-time high in 2015. It is
attributable primarily to developments in the various service        Düsseldorf                      42,984                     2%
sectors as well as to forward-looking industries such as media/      Frankfurt (Main)                60,195                     2%
information and communications technology.
                                                                     Hamburg                         97,317                     4%
The examined second-tier cities account for a collective gross       Munich                          93,777                     3%
value-added share of around 12 %. Among the selected cities,
                                                                     Berlin                          111,442                    4%
Bremen tops the list with a gross value added of approximately
24.6 billion euros. Being another hanseatic city, its port repre-    second-tier cities              330,420                   12 %
sents a major economic factor with its shipyard industry along       other cities                   1,891,646                  69 %
with the sectors transport and logistics. Next in line after Bre-
men are the cities Essen and Bonn.                                   GER total                      2,729,662                 100 %
                                                                     *The cities in the various German states are grouped with different
                                                                     NUTS levels.
                                                                     Sources: Eurostat (France / United Kingdom); bulwiengesa (GER)

                                                                     Interim Summary
                                                                     Unlike in France and the United Kingdom, the German gross
                                                                     value added is generated everywhere in the country. The
                                                                     fact highlights the prominence of mid-market companies for
                                                                     the German economy, as these companies often have their
                                                                     principal places of business in second-tier cities.

© bulwiengesa AG 2018 – P1802-4264                                                                                                   Page 5
SURVEY                                                                                           bulwiengesa
OFFICE MARKET: INVESTMENT OPPORTUNITIES IN GERMAN SECONDARY
LOCATIONS

                                 Second-tier cities versus metropolises in the various German states

   Office Take-up (2017)
   GVA (2015)

   All figures in percent, share in the respective state-level total.

                                                                             Cologne

                                                                            Munich

                                                                          Second-tier
                                                                          cities

                                                                                               Second-tier cities

© bulwiengesa AG 2018 – P1802-4264                                                                                  Page 6
SURVEY bulwiengesa
OFFICE MARKET: INVESTMENT OPPORTUNITIES IN GERMAN SECONDARY
LOCATIONS
3 FOCUS SUBJECT: THE OFFICE REAL West-German capital. The prime rent, for instance, which is tra-
ESTATE MARKETS OF GERMANY’S SE- ditionally paid not in the town centre but in the federal district
submarket, rose by around 17 % or 2.90 euros/sqm RAC since
COND-TIER CITIES
2015. By the end of 2017, it achieved its highest-ever level of
19.60 euros/sqm RAC. The trend is primarily attributable to sig-
Compared to the office real estate markets in the United King-
nings for new-build schemes within this submarket. Moreover,
dom and France, the German market is characterised by a lar-
the vacancy rate is down to 2.4 % at the moment. But the rela-
ge number of smaller cities, some of which show a brisk market
tive supply shortage is not yet reflected in the average rent,
dynamic. The key ratios of these cities will be discussed in the
which has followed a stable trend since 2008.
sections below. They will analyse, in addition to the develop-
ment of office rents, office vacancies, office employment and
office take-up, the construction activity and the liquidity of each Development of the average rent (CBD offices) in the
market. The period under review here extends from 2008 cities surveyed (2008 - 2017)
through 2017.
Kempten 42 %
Trend in Average Rents (2008 - 2017) Leipzig 33 %
Freiburg (B.) 32 %
The currently excellent market environment is also reflected in Osnabrück 31 %
the performance of the second-tier cities. As the chart on this Kassel 31 %
page suggests, the average rent2 has experienced upward Regensburg 28 %
A Cities 28 %
growth in virtually all of the examined cities when looking at the
past ten years. The relevant margin for growth ranges from Potsdam 28 %
around 5 % in Darmstadt to 42 % in Kempten. Leipzig (+33 %), Schwerin 25 %
Lüneburg 23 %
Freiburg (+32 %), Osnabrück (+31 %) and Kassel (+31 %)
Jena 22 %
counts among the cities with the fastest rental uplift.
Ingolstadt 21 %
Münster 20 %
Starting from a low-level rent average (2008: 5.50 euros/sqm
Leverkusen 18 %
RAC), the city of Kempten has established itself as an attracti-
Stralsund 18 %
ve regional office market in the alpine foothills of Bavaria. What Dresden 18 %
draws many companies to the city is particularly the science & Wuppertal 18 %
research sector around the Kempten University of Applied Sci- Karlsruhe 16 %
ences and a strong food technology sector. Important plants in Ulm 16 %
addition to retail multiple Feneberg Lebensmittel GmbH and Chemnitz 15 %
dairy company Edelweiss GmbH also include the Schur Flexib- Bremen 15 %
les GmbH packaging manufacturer and the logistics operator Reutlingen 12 %
Dachser (principal place of business). A sound demand/supply Flensburg 11 %
ratio in this town has pushed up the average rent to 7.80 euros/ Koblenz 9%
sqm RAC (2017). Göttingen 9%
Rostock 9%
In terms of office stock and take-up, Leipzig counts among the Mannheim 8%
most important office markets in East Germany, along with Bayreuth 7%
Essen 7%
Dresden. Known for its trade fairs, the city has seen its office
market perform rather handsomely in recent years. Both prime Darmstadt 5%
rents and average rents experienced a surge, whereas the va- Dortmund 5%
Bonn 0%
cancy rate dropped noticeably to 9.9 % (2017). The high va-
cancy rate when compared to other second-tier cities is a le-
0% 10 % 20 % 30 % 40 % 50 %
gacy of the difficult 1990s. It has been in decline since 2005,
not least because vacant buildings facing obsolescence were 2008 - 2017
taken off the market. Generally speaking, the office market in
Source: RIWIS
Leipzig has shown signs of regeneration in recent years. No
growth impulses have been registered in Bonn lately – at least
not in regard to the average rent. At first glance, this may seem
odd, given the generally very healthy market environment and
the booming demand in the so-called Federal City and former
2
Average rent = to determine the average rent, the rents negotiated
for the leases that were signed during the defined period of time
are weighted with the floor area rented before the mean is calcula-
ted.
© bulwiengesa AG 2018 – P1802-4264 Page 7SURVEY bulwiengesa
OFFICE MARKET: INVESTMENT OPPORTUNITIES IN GERMAN SECONDARY
LOCATIONS
Average rent (CBD offices) in the cities surveyed in euros/sqm RAC (2017)
Flensburg
LK Vorpommern-
Rügen
Rostock
Schwerin
Lüneburg
Bremen
Potsdam
Osnabrück
Münster
Göttingen
Dortmund Leipzig
Essen
Wuppertal Kassel
Dresden
Leverkusen Jena
Chemnitz
Bonn
Koblenz
Bayreuth
Darmstadt
Mannheim
Karlsruhe
Regensburg
Ingolstadt
Reutlingen
Ulm
Freiburg
under 6.00
6.00 to 7.40
7.40 to 9.20
Kempten
9.20 to 14.00
above 14.00
© 2018 bulwiengesa AG
Source: © NAVTEQ
© bulwiengesa AG 2018 – P1802-4264 Page 8SURVEY bulwiengesa
OFFICE MARKET: INVESTMENT OPPORTUNITIES IN GERMAN SECONDARY
LOCATIONS
growing steadily – bringing the total up to more than 2.6 million
Interim Summary sqm RAC by year-end 2017. To put this in context, historic
In the wake of country’s prospering economic development, completion rates of the past ten years ranged from 7,200 sqm
the German office markets has shown a rather handsome RAC (2011) to 51,100 sqm RAC (2016). The 2016 figure inclu-
performance in recent years. The Class A markets, for in- des the new scheme at Domshof for the Bremer Landesbank
stance, achieved rent growth rates of 28% over the past ten with 20,000 sqm RAC, among other completions. By contrast,
years. Some of the small locations (second-tier cities) regis- hardly any office accommodation was completed in Stralsund
tered an even brisker performance, reflected in rent hikes of during the period under review. This is attributable to the mar-
ket action during the second half of the 1990s. Between 1995
over 40%.
and 2000, around 110,000 sqm RAC in new office space were
put on the market which still have not been entirely absorbed
(the vacancy rate being 12.4 % in 2017).
Trend in New Office Completions
The attractiveness of an office market is also mirrored in its Floor space stock (2017) in relation to new-built (08 - 17)
completion rate. Shown below are the completions in the exa-
Office stock, ... thereof new-built
mined cities for the period 2008 through 2017. They are import- City
in sqm RAC
ant to map because they will lend themselves to meaningful in-
ferences during the analysis of office employment and office Ingolstadt 645,000 24 %
vacancies. Ulm 866,000 14 %
Darmstadt 1,613,000 14 %
The average construction activity over the past ten years Kempten 315,000 13 %
shows that completion rates were highest in some of the Class
Freiburg (B.) 1,372,000 13 %
B cities selected, specifically Essen, Bremen, Dortmund, Müns-
Regensburg 1,043,000 12 %
ter, Bonn and Mannheim. Conversely, the lowest rates were
found in the Class D cities of Jena, Leverkusen, Kempten, Essen 3,142,000 11 %
Flensburg, Reutlingen, Bayreuth, Göttingen, Schwerin, Lüne- Münster 2,224,000 11 %
burg and Stralsund. The spectrum among the cases selected Bremen 2,641,000 11 %
ranges from around 700 sqm RAC/year in Stralsund to 36,000 Mannheim 2,076,000 11 %
sqm RAC/year in Essen.
Kassel 1,149,000 11 %
The market action in Essen shows comparatively fast momen- Dortmund 2,618,000 11 %
tum for a Class B city. It is evident in the completion rate, Jena 607,000 10 %
among other factors, which was the highest in 2017 among the A cities 79,713,000 10 %
cities selected. The past five years saw construction start for a Koblenz 994,000 10 %
number of buildings intended either for owner-occupancy or as
Osnabrück 915,000 10 %
head offices by ThyssenKrupp, Funke Mediengruppe, AOK
Potsdam 1,351,000 10 %
Rheinland and DB Schenker, among other companies. By the
end of 2017, Essen was on record with the second-biggest Flensburg 397,000 9%
completions volume during the period under review. Owing to Leverkusen 667,000 9%
large-scale projects such as the 3rd construction stage of the Bayreuth 430,000 8%
Europa-Center complex, it added up to 70,000 sqm RAC. Karlsruhe 2,394,000 8%
Reutlingen 451,000 8%
Overview – new office space added (2017) Rostock 1,014,000 7%
Market size, New office space ad- Bonn 3,236,000 7%
City
in sqm RAC ded, in sqm RAC Chemnitz 13,093,000 6%
Essen 3,142,000 73,000 Dresden 2,631,000 5%
Mannheim 2,076,000 37,000 Lüneburg 328,000 5%
Bonn 3,236,000 27,000 Wuppertal 1,623,000 4%
Münster 2,224,000 26,000 Göttingen 709,000 4%
Freiburg (B.) 1,372,000 25,000 Leipzig 2,724,000 4%
Source: RIWIS Schwerin 721,000 3%
Another city where a large volume of new completions came Stralsund 210,000 3%
on-stream during the period under review is Bremen. The new Source: RIWIS
office space put on the market caused the overall stock to keep
© bulwiengesa AG 2018 – P1802-4264 Page 9SURVEY bulwiengesa
OFFICE MARKET: INVESTMENT OPPORTUNITIES IN GERMAN SECONDARY
LOCATIONS
Similarly, the office vacancy rate in Essen went up by 1.5 per-
Interim Summary centage points during the period under review. While the city’s
Speculative building activity (without pre-lettings) could push vacancy rate used to be around 5 %, it rose to more than 6 %
up vacancy rates in time of slowing demand. Unlike in the in 2017 after Karstadt vacated around 40,000 sqm RAC of of-
Class A markets, where the share of unlet floor area approxi- fice space.
mates 40 % at the start of a given project, new develop-
ments in second-tier cities are generally aligned with de-
mand, i.e. they tend to show a high pre-let ratio. It is a good Trend in vacancies in percentage points
way to reduce the risk associable with market upheavals. (2008 - 2017)
Leipzig -15.9
Jena -5.3
Trend in Vacancy Rates (2008 - 2017)
A cities -4.7
Münster -3.8
The currently available supply in office accommodation of a gi-
Kempten -3.5
ven city is reflected in the respective vacancy rate3 (see chart),
Rostock -3.5
which ranged from 1.5 % in Freiburg to 12.4 % in Stralsund by
Kassel -3.1
the end of 2017. The highest rates were reported from the East Regensburg -3.1
German second-tier cities of Stralsund, Chemnitz, Schwerin, Dresden -2.9
Leipzig and Dresden, which is explained by the high floor spa- Darmstadt -2.2
ce supply dating back to the 1990s. Here, the excess supply Karlsruhe -2.2
created in the post-reunification years has (still) not been enti- Mannheim -2.2
rely absorbed by the market. Koblenz -1.7
Potsdam -1.6
Chemnitz -1.5
Overview – Vacancy Rate (2017)
Leverkusen -1.4
Schwerin -1.4
City Vacancy in sqm Vacancy Rate Bonn -1.2
Stralsund 26,000 12.4 % Lüneburg -1.0
Flensburg -0.8
Chemnitz 158,000 12.1 %
Wuppertal -0.6
Schwerin 80,000 11.1 % Osnabrück -0.6
Leipzig 270,000 9.9 % Bremen -0.4
Dresden 215,000 8.2 % Ingolstadt -0.4
Göttingen -0.3
: : :
Ulm 0
Koblenz 23,000 2.3 % Bayreuth 0.1
Ingolstadt 13,000 2.0 % Stralsund 0.2
Münster 39,000 1.8 % Dortmund 0.2
Reutlingen 0.2
Göttingen 12,000 1.7 %
Freiburg (B.) 0.3
Freiburg 20,000 1.5 % Essen 1.5
Source: RIWIS
-20 -15 -10 -5 0 5 10
As far as the general trend goes, however, the vacancy rate 2008 - 2017
dropped in all of the cities except in Bayreuth, Reutlingen, Dort-
Source: RIWIS
mund, Stralsund, Freiburg and Essen (see chart) during the
analysed period of 2008 through 2017. With the exception of The fastest reduction of vacant office space during the period
Stralsund, the office vacancy rates in the listed cities have re- under review was reported from Leipzig (-16 %) and Jena (-5
turned to a low level. During the period surveyed, the vacancy %). Jena, for one, has spent the past few decades transforming
rate in Freiburg, for instance, has barely moved, rising from itself from an industrial town into a high-tech location in the
1.2 % in 2007 to 1.5 % in 2017. This puts it below the level of fields of optics and photonics, health technology and precision
so-called fluctuation reserve which is essential for any well- engineering. The transition is driven by the local university with
functioning office market. its student body of around 18,000 and other scientific instituti-
ons such as the research organisations Fraunhofer Society and
3
Max Planck Society. The local research and science landscape
The term “office vacancy rate” refers to the usable office space va-
cant at the end of a given year, taking into account only marketable has also stimulated the city’s office market.
properties while ignoring structural vacancy.
© bulwiengesa AG 2018 – P1802-4264 Page 10SURVEY bulwiengesa
OFFICE MARKET: INVESTMENT OPPORTUNITIES IN GERMAN SECONDARY
LOCATIONS
in 2015 (Germany: 70,400 euros per gainfully employed per-
Interim Summary son).
The vacancy rate represents a given office market’s share of
available floor area, and is an important indicator for the situ-
ation on that market. In nearly all Class A cities, the bullish Trend in Office Employment*
performance of the office markets helped to bring down va- (2008 - 2017)
cancies significantly. Analogously, several second-tier cities
also registered a substantial reduction of their office space Ingolstadt 39 %
vacancies. The trend is explained, on the one hand, by a Leipzig 24 %
rise in demand and, on the other hand, by a demand-driven Freiburg 23 %
Jena 22 %
number of completions.
Regensburg 20 %
Münster 20 %
Trend in Office Employment (2008 - 2017) A cities 19 %
Ulm 18 %
The trend in office jobs4 is an important demand indicator for Reutlingen 17 %
office accommodation. As the subsequent chart illustrates, all Lüneburg 17 %
of the selected cities – with the exception of Stralsund – experi- Leverkusen 16 %
Essen 16 %
enced an upward trend in office employment during the period
of 2008 through 2017. Notably Ingolstadt, Leipzig, Freiburg and Karlsruhe 16 %
Bayreuth 14 %
Jena registered growth rates in excess of 20 %.
Mannheim 14 %
The most dynamic growth in office employment among the se- Kempten 13 %
cond-tier cities was reported from Ingolstadt with a rate of Dresden 12 %
Potsdam 12 %
around 39 %. The city’s location in the Bavarian heartland and
Darmstadt 12 %
within the Munich metro region has been attracting highly pro-
Bonn 11 %
ductive companies. In addition to the automotive industry – the
Kassel 11 %
city being Audi’s principal place of business – the trades and
Rostock 11 %
the tertiary sector play important roles for Ingolstadt’s economy. 11 %
Dortmund
Lately, the service sector has been gaining in economic signifi- Bremen 11 %
cance for the city. Specifically, 11.9 % of the office jobs in the Göttingen 10 %
city belonged in the area of other high-end corporate services Osnabrück 7%
in 2015, which implies an increase by 2.4 percentage points Koblenz 7%
since 2010. In terms of office employment, the city also boasts Flensburg 7%
the fastest growth rate within the case selection for the forecast Chemnitz 7%
period 2017 through 2021. Wuppertal 1%
Schwerin 1%
Conversely, office employment in the cities of Wuppertal and Stralsund 5%
Schwerin is subject to slow growth rates of 1.1 % and 0.6 %,
respectively. This suggests that the structural change that the -10 0 10 20 30 40
cities’ economies have undergone since 1960 or 1990 – Wup-
2008 - 2017
pertal as a centre of textile and metalworking, Schwerin as a
manufacturing hub for leather goods – is progressing slowly. *For the cities Göttingen, Lüneburg, Reutlingen, figures are
available only on the county level.
Source: RIWIS
The less auspicious market key ratios of Stralsund are also re-
flected in the analysis of office employment in the city. Between
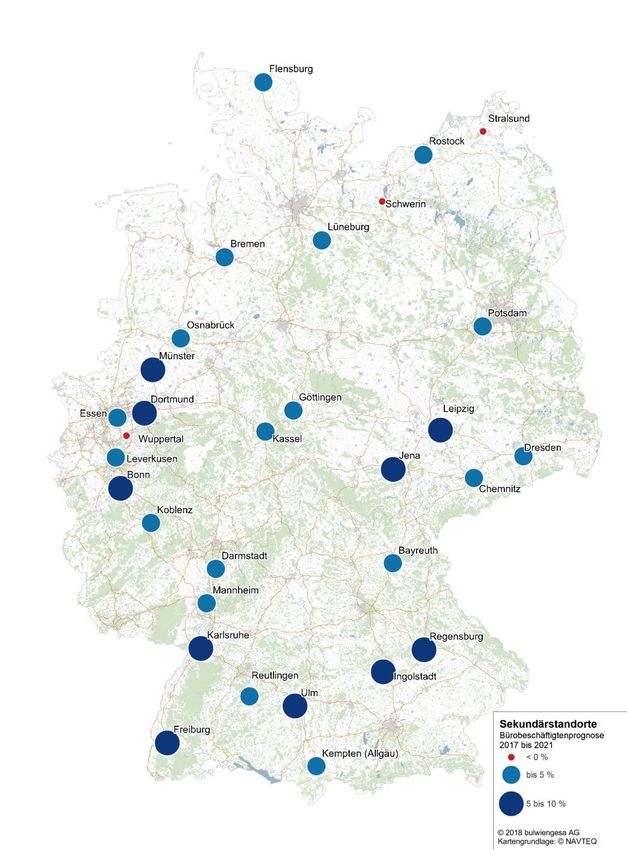
The forecast period of 2017 through 2021 (see the map below)
2008 and 2017, it suffered a decline by around 5 %. Given the
is expected to bring positive growth in office employment for all
present economic parameters, there is nothing to suggest that
of the cities surveyed, with the exception of Wuppertal, Schwe-
the situation in Stralsund will improve any time soon, with the
rin and Stralsund. Here, Ingolstadt tops the list with the highest
unemployment rate at 14.0 % in 2017 (Germany as a whole:
growth expectations (+10 %) because of the continued expan-
6.3 %) and a gross domestic product per gainfully employed
sion at Audi, specifically of its Research & Development depart-
person in the County of Vorpommern-Rügen at c. 49,900 euros
ment. Next in line are Leipzig (+7 %), Freiburg (+7 %) and
Münster (+6 %).
4
The number of office jobs is determined via a drilldown of insurable
employees by professions. It is based on profession-specific quo-
tas for insurable employees according to the Dobberstein method,
which are supplemented with specific quotas for civil servants, self-
employed persons and family workers.
© bulwiengesa AG 2018 – P1802-4264 Page 11SURVEY bulwiengesa
OFFICE MARKET: INVESTMENT OPPORTUNITIES IN GERMAN SECONDARY
LOCATIONS
Trend in Office Employment in % (2017 - 2021)
Second-Tier Cities
Trend in Office Employment
2017 to 2021
under 0 %
to 5 %
5 % to 10 %
© 2018 bulwiengesa AG
Source: © NAVTEQ
© bulwiengesa AG 2018 – P1802-4264 Page 12SURVEY bulwiengesa
OFFICE MARKET: INVESTMENT OPPORTUNITIES IN GERMAN SECONDARY
LOCATIONS
At the bottom of the take-up list are the cities Kempten (5,600
Interim Summary sqm RAC/year) Lüneburg (5,400 sqm RAC/year) and Stralsund
The trend in office employment is an important demand indi- (4,300 sqm RAC/year). In the case of Stralsund, slow take-up
cator for office accommodation. The highly positive econo- coincides with a high vacancy rate, which is therefore almost
mic conditions of recent years triggered a fast increase in of- impossible to bring down.
fice employment, with growth rates of 19 % reported from
the Class A cities and up to 39 % from the second-tier cities.
Going forward, the office job growth is expected to continue Office Take-up
and to have a favourable effect on the market situation.
Take-up in sqm RAC Take-up in % of the
City
(ø 2008 - 2017) total stock
Frankfurt 425,800 4.2 %
Trend in Office Take-up (2008 - 2017) Düsseldorf 313,700 4.1 %
Munich 546,600 4.0 %
The demand for office accommodation is mapped in the repre- Hamburg 510,400 3.7 %
sentation of the take-up5. Among the cities included in the se- Leipzig 98,400 3.6 %
lection, the Class B cities stand out because, unlike the Class Cologne 274,500 3.6 %
C and D cities, they not only boast the highest completion rates Essen 112,100 3.6 %
but also the highest average annual take-up. The overall take- Berlin 666,000 3.5 %
up spectrum among ranges from around 4,300 sqm RAC in Stuttgart 249,700 3.2 %
Stralsund to 112,000 sqm RAC in Essen. While Essen thus Dortmund 82,100 3.1 %
tops the list among the analysed cities in terms of construction Mannheim 65,000 3.1 %
activity with an annual average of 36,000 sqm RAC, the high Bremen 820,400 3.1 %
completions rate is matched by keen demand. Dresden 79,200 3.0 %
Darmstadt 45,300 2.8 %
Darmstadt, a city known as science hub, shows a take-up of Osnabrück 25,400 2.8 %
around 45,000 sqm RAC/year, which puts it in the upper half Bonn 89,000 2.7 %
among the cities included in the case selection. The letting Münster 58,700 2.6 %
business in the city is characterised primarily by small-scale Ingolstadt 15,300 2.4 %
signings. The city’s lead sectors include chemicals, pharma- Regensburg 24,200 2.3 %
ceuticals and bio-engineering as well as the information and Stralsund 4,300 2.0 %
communication technology, mechanical engineering and Koblenz 19,700 2.0 %
electrical engineering. The take-up in this city extends from Jena 11,800 1.9 %
32,000 sqm RAC (2009) to 67,000 sqm RAC (2014). Leverkusen 12,800 1.9 %
Ulm 16,400 1.9 %
Among the cities with a robust take-up is Wuppertal, too. With Flensburg 7,500 1.9 %
a floor space stock of about 1.6 million sqm, Wuppertal has the Kempten 5,600 1.8 %
second-largest office market among Germany’s Class C cities Potsdam 23,500 1.7 %
– after Erfurt. The take-up ranges from 15,000 sqm RAC Freiburg 22,600 1.6 %
(2016) to 34,000 sqm RAC (2013). Lüneburg 5,400 1.6 %
Karlsruhe 38,900 1.6 %
With a take-up of around 20,000 sqm RAC/year, Koblenz is Wuppertal 25,900 1.6 %
another city showing a robust performance. The market action Bayreuth 6,800 1.6 %
here is defined by public-sector administration (federal and sta- Kassel 16,700 1.4 %
te level authorities) as well as by the finance, credit and insu- Rostock 13,400 1.3 %
rance business (one of Germany’s major insurance companies, Reutlingen 5,700 1.3 %
Debeka, having its head office here). Similarly positive are the Göttingen 7,000 1.0 %
other metrics of Koblenz: The average rent in the town centre Chemnitz 11,500 0.9 %
is in the top segment among the Class D cities, whereas the Schwerin 6,300 0.9 %
vacancy rate counts among the lowest.
Source: RIWIS
5
The take-up is quoted as an annual sum and limited mainly to the
office space (in sqm RAC) that is transferred through letting (no
lease renewals, no lease-backs), but also includes accommodation
acquired by owner-occupiers. The key date for take-up is the day a
lease is signed or the day that marks the start of construction on or
the acquisition of owner-occupied properties, as the case may be.
© bulwiengesa AG 2018 – P1802-4264 Page 13SURVEY bulwiengesa
OFFICE MARKET: INVESTMENT OPPORTUNITIES IN GERMAN SECONDARY
LOCATIONS
%) and logistics real estate (9 %). Investor demand for office
Interim Summary real estate manifests itself in the headline yield of a given mar-
The office take-up, meaning the volume in lettings and ow- ket. Over the past years, it has hardened considerably. In the
ner-occupancy, mirrors the dynamic and activity of a given absence of investment opportunities in Germany’s "Big Seven"
market. The sensible thing to do prior to investment decisi- cities and given the elevated rates of return in second-tier ci-
ons is to ensure the investment asset is of market-consistent ties, the latter have moved into the focus of investors lately. As
size. The relation of the take-up to the underlying stock re-
a result of this development, net initial yields7 in all of the cities
flects the propensity of tenants to relocate. The latter is
selected for this survey in 2017 have dropped to a new all-time
much more pronounced in the Class A markets than in the
low (see table).
second-tier cities.
Overview – net initial yield (2016 / 2017)
Investment Market City NIY 2016 NIY 2017 Basis points
Chemnitz 7.9 % 7.0 % -90
Transaction volume commercial property ( 2008 - 2017*) Stralsund 7.3 % 7.0 % -30
Schwerin 7.1 % 6.5 % -60
40 100
35 Koblenz 6.5 % 6.1 % -40
change – previous
30 50 Bayreuth 6.7 % 6.0 % -70
in billion euro
year in %
25 Flensburg 6.5 % 6.0 % -50
20 0
Göttingen 6.6 % 6.0 % -60
15
10 -50 Jena 6.3 % 6.0 % -30
5 Kempten 6.5 % 6.0 % -50
0 -100 Lüneburg 6.6 % 6.0 % -60
08 09 10 11 12 13 14 15 16 17
Reutlingen 6.0 % 5.9 % -10
A cities change Sec.-t. c.
Wuppertal 6.4 % 5.8 % -60
Second-tier cities Leverkusen 5.8 % 5.7 % -10
*No data available on years before 2008 Kassel 6.0 % 5.5 % -50
Source: RIWIS
Rostock 5.9 % 5.3 % -60
Since the financial crisis in 2009, investments in German com- Ulm 5.5 % 5.1 % -40
mercial real estate6 have steadily increased in volume. The
Ingolstadt 5.5 % 5.0 % -50
trend is reflected in the transaction total, too: Compared to
2010, when approximately 16 billion euros were invested in Osnabrück 5.6 % 5.0 % -60
Class A cities and second-tier cities, the investment volume in Potsdam 5.3 % 4.8 % -50
2017 added up to approximately 45 billion euros, of which 15 Regensburg 5.1 % 4.8 % -30
billion euros were investment outside the metropolises. This Bremen 5.3 % 4.7 % -60
translates into a growth by nearly 200 %. Accordingly, the year-
Darmstadt 5.3 % 4.6 % -70
end transaction total of 2017 represents a new record level in
Dortmund 5.0 % 4.6 % -40
the wake of the consolidation in 2016. Out of the total, foreign
investors were responsible for roughly 48 % of all transactions Dresden 5.0 % 4.6 % -40
in the commercial real estate sector. Essen 5.0 % 4.5 % -50
Mannheim 5.0 % 4.5 % -50
Generally speaking, the Class A cities remain the preferred in- Freiburg (B.) 5.0 % 4.4 % -60
vestment location with a 5-year average share of around 80 %
Karlsruhe 5.0 % 4.4 % -60
of the total volume (2013 - 2017). But market players invest in-
creasingly in second-tier cities, too. These registered a year- Leipzig 5.0 % 4.4 % -60
on-year increase in transaction volume by around 14 % in Münster 5.0 % 4.4 % -60
2017. Bonn 4.6 % 4.2 % -40
A cities 3.6 % 3.2 % -40
Among the various segments, office real estate remains the Scource: RIWIS
most popular class of investments. It accounts for around 55 %
of all investment in 2017. Next in line were retail real estate (20
7
Net initial yield (NIY) = this ratio puts the net rental income in relati-
6
Commercial real estate = office, retail and logistics real estate on to the purchase price before the property-specific incidental ac-
along with certain other properties (hotels, senior-living real estate, quisition costs. Accordingly, a low net initial yield rate suggests a
etc.) high asking price.
© bulwiengesa AG 2018 – P1802-4264 Page 14SURVEY bulwiengesa OFFICE MARKET: INVESTMENT OPPORTUNITIES IN GERMAN SECONDARY LOCATIONS By the end of 2017, net initial yield rates in the surveyed se- cond-tier cities ranged from 7.0 % in Chemnitz to 4.2 % in Bonn. In terms of prime yields (net initial yield), Bonn is the pri- ciest among the Class B cities in Germany. Year on year, the net initial yield for centrally located office schemes hardened by another 40 basis points and stood at 4.2 % by the end of 2017. This means that the net initial yield rate in Bonn is 40 basis points below the average of the Class B cities, which is around 4.6 %. Most expensive among the Class C and D cities is Freiburg (4.4 %) and Ingolstadt (5.0 %), respectively. Generally spea- king, net initial yields are highest in Class D cities due to their small market footprint. Interim Summary In the absence of investment opportunities and low yield ex- pectations in the markets of the Class A cities, players invest increasingly in second-tier cities. In 2017, approximately 27,5 billion euros were invested outside the major metropoli- ses – thereof 15 billion euros in second-tier cities. The heightened interest in the second-tier cities is explained by the higher yield average combined with a very stable rent level. While rising demand will push the net initial yields down to historic lows even in the second-tier cities, the yield spread between these markets and the Class A cities is still considerable at 2 percentage points. © bulwiengesa AG 2018 – P1802-4264 Page 15
SURVEY                                                                                                      bulwiengesa
OFFICE MARKET: INVESTMENT OPPORTUNITIES IN GERMAN SECONDARY
LOCATIONS

4      PERFORMANCE POTENTIAL OF SE-                                                     0IRR – Second-Tier
                                                                                                 2        4Cities* 6                   8
       COND-TIER CITIES
                                                                          Stralsund                          4.2         6.6        7.6
A good way to map the performance of real estate investments              Chemnitz                             4.5       6.6       7.3
is the application of the IRR method (internal rate of return).                Jena                        3.8       5.7     6.4
Within the framework of survey to determine lucrative invest-             Lüneburg                        3.7      5.5      6.1
ment destinations ("5 % Studie: Wo investieren sich noch                   Kempten                     3.2         5.4        6.4
lohnt"), bulwiengesa has modelled the return potential for the             Schwerin                      3.6      5.3          6.6
entire German real estate market. The survey distinguishes                 Bayreuth                     3.4       5.3        6.3
between core property (stable rental situation, good location)               Leipzig               2.3           5.2 5.4
and non-core property (impaired properties). Methodologically,            Flensburg                     3.4     5.0        6.0
an ownership period of ten years is assumed, followed by a              Leverkusen                     3.1      5.0      5.7
sale (exit). With a view to the uncertainties of the current in-            Koblenz                      3.5 4.9            6.1
vestment market that make it hard venture forward-looking pre-            Göttingen                        3.5   4.9           6.1
dictions, no further yield compression is projected (initial yield =        Dresden                  2.5         4.8    5.0
exit yield). The chart on the side here shows the findings for the        Ingolstadt                 2.8        4.7       5.3
second-tier cities examined. The analysis refers purely to the           Reutlingen                     3.2 4.6              5.8
property effects while disregarding other levers (e.g. through fi-       Wuppertal                    3.0      4.6            5.9
nancing effects). Accordingly, the internal rate of return serves            Kassel                  2.7       4.5         5.5
as relevant benchmark for an investment.                                Regensburg                2.3        4.2        5.0
                                                                            Rostock                  2.8     4.2          5.3
The currently strong need for yield has caused the IRRs to take            Potsdam                 2.5      4.1          5.1
a nosedive in recent years. This explains why prime properties                  Ulm                  2.8 4.0             5.1
(core property) in Germany’s Class A cities only return yields           Osnabrück               2.2       3.9            5.3
between 1.6 % and 3.7 % despite the bright rent outlook. This                 Essen             2.1      3.6         4.5
is where second-tier cities come into play, as some of them                 Bremen             1.9       3.6          4.7
come with far higher return potential. Market-consistent invest-          Dortmund               2.2 3.5             4.5
                                                                         Darmstadt                2.2 3.4           4.4
ments in cities like Stralsund, Chemnitz or Jena, for instance,
                                                                            Freiburg            2.0    3.4          4.4
will generate initial yields between 5.7 % and 6.6 % even when
buying high-quality assets.                                                 Münster            1.9      3.4           4.4
                                                                         Mannheim              1.9    3.1          4.4
The return potential shown (core) may actually be topped                  Karlsruhe          1.6     3.0           4.4
                                                                               Bonn          1,7
                                                                                             1.7     2.9          4,1
                                                                                                                  4.1
through active property management. Yield-oriented investors
will therefore buy properties with certain flaws (such as vacan-
                                                                                       0%          2%            4%          6%       8%
cies) in high-quality locations. Vacancy reductions and/or rent
increases can sustainably raise the value of such properties                              IRR from...                       IRR base value
and with it their return on investment. But such an investment                            ... IRR max. up to
strategy presupposes in-depth knowledge of the local market,
on the one hand, and adequate acquisition volumes, on the              *Applies to core office locations
                                                                       Source: bulwiengesa "5% Studie 2017" (2018 update)
other hand. Special attention should be paid to the size of a gi-
ven market, which in the case of office markets is reflected in
the take-up. The mixed-use property Gutenberggalerie in Leip-
zig, which DEMIRE acquired in 2015, is a fine example for the
successful implementation of such a strategy.

© bulwiengesa AG 2018 – P1802-4264                                                                                                     Page 16
SURVEY bulwiengesa
OFFICE MARKET: INVESTMENT OPPORTUNITIES IN GERMAN SECONDARY
LOCATIONS
Digression – Appreciation in the DEMIRE Portfolio The mixed-use property, which includes retail units, a hotel
(122 rooms, 4-star), an underground car park and offices, is lo-
cated downtown in the sub-market “Grafisches Viertel,” a com-
Leipzig – Gutenberggalerie mercial location of long-standing tradition. The 9-storey building
with about 23,000 sqm of usable area is superbly positioned in
Acquisition Status
terms of its architecture, aesthetics and functionality. The de-
(May 2015) (31.12.2017)
sign of the atrium is inspired by the historic courtyards and ar-
EPRA-Vacancy cades once typical of Leipzig’s town centre. The excellent mi-
30 % 10 % cro-environment of the property, which was raised in 1994, its
rate
convenient access to public transportation, and its high building
Rental income 1.3 million euros 1.7 million euros quality justify rent rates between 6.50 euros/sqm and 7.50 eu-
ros/sqm.
Market value 19.0 million euros 27.5 million euros DEMIRE substantially reduced the vacancy by introducing a
new use concept to stimulate the retail business. The success-
Illustrative IRR* ful lease signings since the acquisition show that commercial
8.7 %
2015 - 2022 units with sound transport links in central locations of second-
tier cities are subject to brisk demand, and that commercial
*Projected sale at current market value
Source: DEMIRE property with vacancies offer an attractive value-added potenti-
al.
© bulwiengesa AG 2018 – P1802-4264 Page 17SURVEY bulwiengesa
OFFICE MARKET: INVESTMENT OPPORTUNITIES IN GERMAN SECONDARY
LOCATIONS
Summary of findings
ø-rent, CBD, in eu- Trend in ø-rent, Development of NIY*** Trend in NIY, central
Vacancy rate
ros/sqm RAC CBD, forecast vacancy rate (fore- central locations locations (forecast
(2017)**
(2017)* through 2021 cast through 2021) (2017)** through 2021)
Bayreuth 7.2 (+1.4 %) 2.8 % (- 40) 6.0 % (- 70)
Bonn 10.5 (+1.9 %) 2.8 % (+ 20) 4.2 % (- 40)
Bremen 8.6 (+ 1.2 %) 4.2 % (- 30) 4.7 % (- 60)
Chemnitz 7.5 (+ 4.2 %) 12.1 % (- 20) 7.0 % (- 90)
Darmstadt 10.0 (+ 2.0 %) 2.8 % (- 180) 4.6 % (- 70)
Dortmund 10.5 (0.0 %) 4.2 % (- 80) 4.6 % (- 40)
Dresden 9.9 (+ 2.1 %) 8.2 % (- 20) 4.6 % (- 40)
Essen 10.2 (+ 4.1 %) 6.5 % (+ 90) 4.5 % (- 50)
Flensburg 7.2 (+ 7.5 %) 4.8 % (- 30) 6.0 % (- 50)
Freiburg (B.) 12.5 (+ 8.7 %) 1.5 % (+ 10) 4.4 % (- 60)
Göttingen 8.2 (+ 1.2 %) 1.7 % (- 10) 6.0 % (- 60)
Ingolstadt 9.7 (+ 3.2 %) 2.0 % (- 10) 5.0 % (- 50)
Jena 9.5 (+ 5.6 %) 3.5 % (- 30) 6.0 % (- 30)
Karlsruhe 9.3 (+ 1.1 %) 3.3 % (- 30) 4.4 % (- 60)
Kassel 7.2 (+ 5.9 %) 3.9 % ( - 60) 5.5 % (- 50)
Kempten 7.8 (+ 1.3 %) 3.5 % (- 10) 6.0 % (- 50)
Koblenz 8.2 (+ 2.5 %) 2.3 % (- 90) 6.1 % (- 40)
Leipzig 10.0 (+ 6.4 %) 9.9 % (- 150) 4.4 % (- 60)
Leverkusen 7.7 (+ 1.3 %) 4.9 % (- 40) 5.7 % (- 10)
Lüneburg 9.5 (+ 5.6 %) 4.0 % (- 10) 6.0 % (- 60)
Mannheim 11.5 (+ 0.9 %) 4.8 % (+ 40) 4.5 % (- 50)
Münster 10.2 (+ 2.0 %) 1.8 % (- 30) 4.4 % (- 60)
Osnabrück 8.8 (+ 3.5 %) 3.4 % (- 20) 5.0 % (- 60)
Potsdam 10.2 (+ 2.0 %) 3.3 % (- 40) 4.8 % (- 50)
Regensburg 9.5 (+ 2.2 %) 4.3 % (- 100) 5.9 % (- 30)
Reutlingen 8.4 (+ 1.2 %) 4.7 % (- 130) 5.9 % (- 10)
Rostock 8.5 (+ 1.2 %) 5.9 % (- 60) 5.3 % ( - 60)
Schwerin 6.9 (+ 1.5 %) 11.1 % (0) 6.5 % (- 60)
Stralsund 6.2 (+ 1.6 %) 12.4 % (0) 7.0 % (- 30)
Ulm 11.3 (+ 0.9 %) 3.8 % (- 20) 5.1 % (- 40)
Wuppertal 8.0 (+ 1.3 %) 4.9 % (- 40) 5.8 % (- 60)
*The figure in brackets represents the percentage change on year earlier.; **The figure in brackets represents the change on year earlier in basis
Wuppertal
points.; ***NIY = net initial yield; note: cities shaded in yellow were added to the survey since the previous edition.
© bulwiengesa AG 2018 – P1802-4264 Page 18SURVEY bulwiengesa OFFICE MARKET: INVESTMENT OPPORTUNITIES IN GERMAN SECONDARY LOCATIONS ANNEX © bulwiengesa AG 2018 – P1802-4264 Page 19
SURVEY                                                                                                   bulwiengesa
OFFICE MARKET: INVESTMENT OPPORTUNITIES IN GERMAN SECONDARY
LOCATIONS

General Classification of Cities

                                                        Overview A-, B-, C- and D-Cities

 City                   Category   City                   Category      City               Category   City                  Category
 Berlin                    A       Lübeck                     C         Gelsenkirchen         D       Neuss                    D
 Düsseldorf                A       Magdeburg                  C         Gera                  D       Oberhausen               D
 Frankfurt (Main)          A       Mainz                      C         Gießen                D       Offenburg                D
 Hamburg                   A       Mönchengladbach            C         Görlitz               D       Oldenburg                D
 Köln                      A       Mülheim (Ruhr)             C         Göttingen             D       Paderborn                D
 München                   A       Offenbach (Main)           C         Greifswald            D       Passau                   D
 Stuttgart                 A       Osnabrück                  C         Gütersloh             D       Pforzheim                D
                                   Potsdam                    C         Hagen                 D       Plauen                   D
 Bochum                    B       Regensburg                 C         Halberstadt           D       Ratingen                 D
 Bonn                      B       Rostock                    C         Halle (Saale)         D       Ravensburg               D
 Bremen                    B       Saarbrücken                C         Hamm                  D       Recklinghausen           D
 Dortmund                  B       Wuppertal                  C         Hanau                 D       Remscheid                D
 Dresden                   B                                            Heilbronn             D       Reutlingen               D
 Duisburg                  B       Albstadt                   D         Herne                 D       Rosenheim                D
 Essen                     B       Aschaffenburg              D         Hildesheim            D       Salzgitter               D
 Hannover                  B       Bamberg                    D         Ingolstadt            D       Schweinfurt              D
 Karlsruhe                 B       Bayreuth                   D         Jena                  D       Schwerin                 D
 Leipzig                   B       Bergisch Gladbach          D         Kaiserslautern        D       Siegen                   D
 Mannheim                  B       Bottrop                    D         Kassel                D       Solingen                 D
 Münster                   B       Brandenburg (Hl.)          D         Kempten (Allgäu)      D       Stralsund                D
 Nürnberg                  B       Bremerhaven                D         Koblenz               D       Suhl                     D
 Wiesbaden                 B       Chemnitz                   D         Konstanz              D       Trier                    D
                                   Coburg                     D         Krefeld               D       Tübingen                 D
 Aachen                    C       Cottbus                    D         Landshut              D       Ulm                      D
 Augsburg                  C       Dessau                     D         Leverkusen            D       Villingen-Schwenn.       D
 Bielefeld                 C       Detmold                    D         Lüdenscheid           D       Weimar                   D
 Braunschweig              C       Düren                      D         Ludwigshafen          D       Wilhelmshaven            D
 Darmstadt                 C       Eisenach                   D         Lüneburg              D       Witten                   D
 Erfurt                    C       Flensburg                  D         Marburg               D       Wolfsburg                D
 Erlangen                  C       Frankfurt (Oder)           D         Minden                D       Würzburg                 D
 Freiburg                  C       Friedrichshafen            D         Moers                 D       Zwickau                  D
 Heidelberg                C       Fulda                      D         Neubrandenburg        D
 Kiel                      C       Fürth                      D         Neumünster            D

Classification of Locations
The cities picked by bulwiengesa AG for the RIWIS database are grouped into 4 categories depending on their functional signifi-
cance for the international, national, regional or local real estate market.

Class A cities: Germany's leading centres, having national and in some cases international significance. Large functional markets
across segments.

Class B cities: Major cities of national and regional significance.

Class C cities: Important cities of regional and to some extent national significance, and serving as centre for the surrounding regi-
on.

Class D cities: Small towns of regional focus with a central role for the directly surrounding countryside; marked by lower market
volume and take-up.

© bulwiengesa AG 2018 – P1802-4264                                                                                            Page 20
SURVEY bulwiengesa OFFICE MARKET: INVESTMENT OPPORTUNITIES IN GERMAN SECONDARY LOCATIONS Client DEMIRE – Deutsche Mittelstand Real Estate AG Editorial desk bulwiengesa AG Eschersheimer Landstr. 10 60322 Frankfurt am Main Telefon: +49 69 7561 46 - 760 www.bulwiengesa.de Index of figures Cover: Shutterstock, Scanrail1, anweber, LaMiaFotografia; page 1: Shutterstock, MKstudio; page 4: Shutterstock, Tobias Arhelger; page 16: Shutterstock, Jakob Fischer; page 17: DEMIRE © bulwiengesa AG 2018 – P1802-4264 Page 21
You can also read