Towards sustainable energy system options for improving energy access in Southern Africa - SciELO SA
←
→
Page content transcription
If your browser does not render page correctly, please read the page content below
Volume 31 Number 2
                                                                                                    May 2020

Towards sustainable energy system options for improving
energy access in Southern Africa

Henerica Tazvinga1*, Oliver Dzobo2, Maxwell Mapako3
1 South African Weather Service, 01 Eco park Drive, Eco glades Block B, Cnr. Olievenhoutbosch and Ribbon
  Grass Street, Centurion, Pretoria, South Africa
  ORCiD: https://orcid.org/0000-0002-7538-6169
2 Department of Electrical and Electronic Engineering Science, University of Johannesburg, Cnr. Kingsway Road
  & University Road, Auckland Park, 2006, Johannesburg, South Africa
  ORCiD: https://orcid.org/0000-0001-9602-6835
3 Council for Scientific and Industrial Research, P.O. Box 395, Pretoria 0001, South Africa
  ORCiD: https://orcid.org/0000-0003-4095-0329

Abstract
Access to modern energy services is one of the pre-requisites to improved livelihood, yet the poor, par-
ticularly in developing countries, remain tied to unhealthy and inefficient traditional fuels. Renewable
energy technologies are increasingly popular energy supply alternatives to fossil-based fuels in many
countries. This study presents sustainable energy system implementation options for increasing energy
access in developing countries, with special emphasis on Sub-Saharan Africa. A feasibility case study and
various implementation options are presented for possible deployment of these systems. Hybrid opti-
mization of multiple energy resources software was used to simulate and validate the proposed hybrid
system design and performance. The simulation results indicate that hybrid systems would be feasible
options for distributed generation of electric power for remote locations and areas not connected to the
electricity grid. Such a hybrid energy system, through providing modern energy services, gives promise
to free-up rural communities to engage in productive activities. The opportunity to power or facilitate
productive activities such as agro-processing, fabrication and services can potentially reduce poverty.

Keywords: hybrid system design, distributed generation, fossil-based fuels, agro-processing

Highlights
• Renewable energy technologies are becoming popular energy options.
• Provision of sustainable energy services is crucial.
• Renewable energy technologies have potential of creating income through job diversification.
• Mini grids have considerable potential in the Southern African Development Community region.

                               Journal of Energy in Southern Africa 31(2): 59–72
                          DOI: http://dx.doi.org/10.17159/2413-3051/2020/v31i2a6504

        This work is licensed under a Creative Commons Attribution-ShareAlike 4.0 International Licence
            Published by the Energy Research Centre, University of Cape Town ISSN: 2413-3051
                                        https://journals.assaf.org.za/jesa

                           Sponsored by the Department of Science and Technology

* Corresponding author: Tel: +27 (0)12 367 6276;
  email: henerica.tazvinga@weathersa.co.za

                                                       59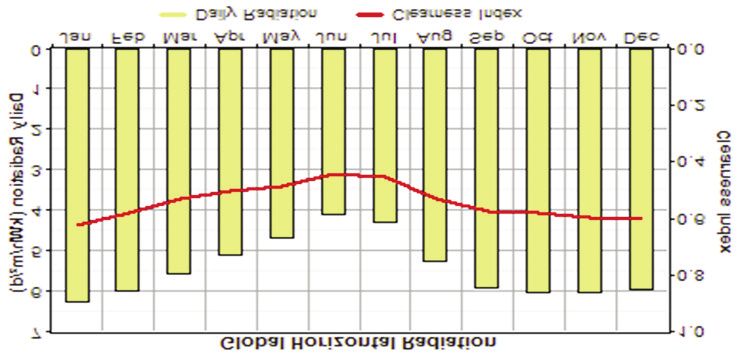
1. Introduction                                        in 2018 in SSA (IEA, 2019), because of the
Access to modern energy services is very               reliance on inefficient and polluting cook stoves.
important for the well-being of people and for         Various studies have identified several factors
national economic development, yet this                that influence diffusion of clean cooking that
remains limited. About 1.7 billion of the world        need to be considered when rolling out these
population of just over 6 billion did not have         technologies (Rosenthal et al., 2017; Kumar and
access to electricity (International Energy            Igdalsky, 2019; Hou et al., 2018; Abdalla and
Agency (IEA), 2017) in 2000. The number of             Makame, 2017). These include traditional cook-
people without access to electricity decreased to      ing practices, cultural habits, low empowerment
1.3 billion people in 2009 and about 2.7 billion       levels of women, and low awareness of the
people did not have clean cooking facilities           social, economic, health and environmental ben-
(IEA, 2011). By 2016, there was a further              efits of using clean technology options.
decrease in the number of people without                   There is a growing call to address these
access to electricity to 1.1 billion (IEA, 2017).      issues and specifically to address energy pover-
There has, then been considerable progress             ty. Electricity demand in SSA is increasing
worldwide in relation to electricity access, with      steadily, and the future of rural electrification
the number of people without electricity access        lies more in local, flexible and innovative decen-
for the first time falling below a billion in 2017     tralised production than in centralised produc-
(World      Energy      Outlook,     2018;      IEA,   tion because of financial limitations to grid
International Renewable Energy Agency                  extension and the sparsely distributed house-
(IRENA), United Nations Statistics Division            hold settlements. The SSA region’s low rates of
(UNSD), World Bank Group (WB), World Health            electrification provide a strong motivation for
Organisation (WHO), 2019). The same report             implementation of distributed generation sys-
reveals that the provision of universal electricity    tems with a high share of renewable energy
for all will most likely be achieved through           (RE) technologies. Clean energy technologies
decentralised systems, led by solar photovoltaic       are increasingly being deployed, owing to the
(PV) in off-grid and mini-grid systems, and that       need to reduce reliance on finite fossil-based
grid extension will still have a role to play, espe-   fuels, given their impact on the environment
cially in urban areas. Most of the world’s popu-       and their increasing price. Increased uptake of
lation is in developing countries, mostly in rural     RE sources has great potential to address the
and remote areas where the communities are             impacts of climate change on health (reducing
poor and marginalised.                                 pollutants that cause disease) and the environ-
    Sub-Saharan Africa (SSA) is one region             ment, while addressing energy access and secu-
where energy poverty needs urgent attention,           rity. The main driver for implementing these
with 600 million people not having access to           technologies in SSA is to reduce energy poverty
electricity and about 900 million people lacking       as well as address the Sustainable Develop-
access to clean cooking energy (IEA, 2019).            mental Goals set by the United Nations General
Access to modern energy services is increasing         Assembly in 2015.
at a low rate because of various factors.                  According to IEA (2019), Vigolo et al., (2018)
Achieving clean cooking for all relies primarily       and Hou et al., (2018), the provision of sustain-
on the deployment of liquefied petroleum gas           able energy services, especially in poor commu-
(LPG), natural gas and electricity in urban areas,     nities, is crucial in the transition from subsis-
and a range of technologies in rural areas. The        tence livelihoods to increased productivity,
IEA (2017) estimated that about 730 million            income generation and improved living stan-
people (92% of the population) in SSA rely on          dards. To support this transition, there is need
traditional biomass cooking fuels such as wood,        for reliable power supply systems that provide
charcoal, dung and agricultural residues. About        uninterrupted power. These systems include a
6% of the population cooks with kerosene,              mix of dispatchable energy sources, such as
which is used by 12% of urban households. The          diesel generators, biogas generators, fuel cells,
same report notes that only 32% of the urban           storage batteries and the grid. Diesel generators
population have access to cleaner fuels for            have low initial costs, but their operation costs
cooking. According to IEA (2019), about 95% of         are high (Middlemiss and Gillard, 2015;
those who lack access to clean cooking use solid       Ogunjuyigbe et al., 2016; Tazvinga and Hove,
biomass, i.e., fuelwood, charcoal or dung in open      2010). Battery banks (typically lead-acid batter-
fires), while 5% use kerosene or coal. Reliance        ies) in PV-battery systems improve the supply
on these traditional fuels is detrimental to peo-      reliability but sometimes they must be oversized
ple’s health, the environment and economic             to achieve the required hours or days of auton-
development. Household air pollution contribut-        omy, leading to high capital costs. Oversizing of
ed to about 500 000 million premature deaths           battery storage systems is often necessitated by

                     60 Journal of Energy in Southern Africa • Vol 31 No 2 • May 2020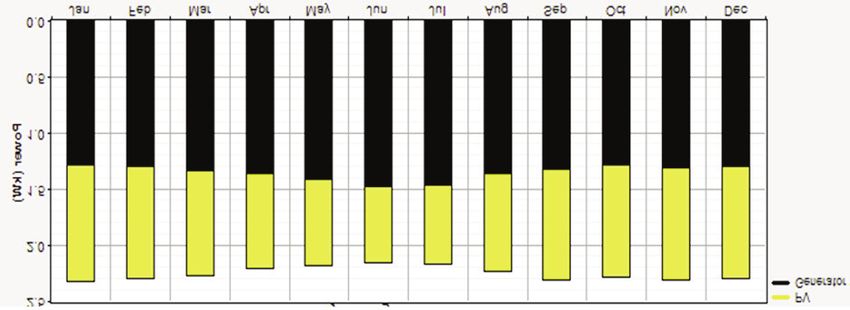
the need to store more energy from the PV              ments with a high level of system reliability
array when the sun is available to ensure that         through PV systems, and biogas plants that use
the user can have energy supply during periods         animal wastes as well as other agricultural
when there is little or no production (Jadhav, et      wastes as feedstock for bio-digesters to produce
al., 2017; Taha, 1995; Quoilin et al., 2016).          biogas, i.e., methane, which can then be used in
Battery banks are sometimes oversized to com-          combustion engines (generators) to produce
pensate for peak load supply, besides catering         electricity, while individual households can use
for increased days of autonomy (Chotia and             biogas generated from co-digestion of various
Chowdhury, 2015). Batteries are replaced more          household and animal wastes directly from
frequently than any other component of a PV            digesters to meet their thermal needs (Tazvinga
system, therefore oversizing will increase the         et al., 2017).
cost of the system, hence the need for optimal              Numerous hybrid energy system models
sizing and design. The current decrease in PV          have been proposed, as have a wide range of
technology prices has resulted in greater uptake       tools and methodologies for estimating costs
of PV technology in the residential and utility        and revenues, sizing, social and environmental
sectors. Battery bank costs are also expected to       impacts of various energy technologies (Fulzele
reduce over time. Diesel generators, on the            and Daigavane, 2016; Tazvinga, 2015; Petrillo et
other hand, have been favoured options for off-        al., 2016; Zakeri and Syri, 2015). While there is a
grid applications for many years owing to their        global call for a shift to environment-friendly
low initial capital costs, despite their disadvan-     sustainable energy systems, the challenge is that
tages cited earlier.                                   systems incorporating RE sources are complex.
    Fuel cell (FC)–electrolyser combinations may       This necessitates consideration of three dimen-
be considered for backup and a long-term stor-         sions of sustainability: (1) life cycle assessment;
age system, with a battery bank for short-time         (2) social life cycle assessment; and (3) economic
backup to supply transient power (Wang et al.,         life cycle cost. These respectively consider envi-
2008; Sichilalu et al., 2016; Wang et al., 2020).      ronmental aspects and potential impacts associ-
However, for the system to be environmentally          ated with a service, product or process; the
friendly, the RE sources must be sized to meet         impacts of a product or system on the society at
the electrolyser’s energy requirements for             large; and all costs linked to the life cycle of a
hydrogen production. Compared with internal            product or system, including externalities
combustion engines, FCs operate in a silent and        (Petrillo et al., 2016). The present study address-
clean mode and require less fuel, as they are          es the sustainability dimensions through
more efficient. Stationary FC technology is near       analysing the benefits of using RE-based energy
commercialisation and is expected to tap into a        systems. For proper determination of the feasi-
large market in residential, commercial and            bility of the project/system and alternative
industrial applications in future. Currently the       investment choices, a life cycle cost (LCC) over
FC–electrolyser system is more expensive than          the project life must be established (Leckner and
the diesel generator system. Another challenge         Zmeureanu, 2011). In most cases, building own-
associated with this technology is that the pro-       ers and investors in RE and energy-efficient
duction of hydrogen (electrolysis) using renew-        projects are interested only in the associated
able electricity and the conversion back into          investment in order to make investment deci-
electricity (FCs) is associated with energy losses     sions (Rahman et al., 2015). Ogunjuyigbe et al.
and additional costs (Adefarati et al., 2017).         (2016) used a genetic algorithm to study five
    Biogas technology is very flexible as it utilis-   scenarios of RE-based hybrid systems to serve a
es various types of feedstock, including the           typical load profile of a residential house with
organic fraction of municipal solid wastes, waste      the objective of minimising the LCC, carbon
streams from food industries, households, agri-        emissions and dumped energy.
culture and agro-processing, wastewater sludge              In this study, a systems dynamics approach
and many other organic wastes. Biogas can be           is used to enhance understanding of the benefits
produced by co-digesting various feedstocks,           of hybrid energy systems. The paper also pre-
which are in abundance in many communities.            sents a feasibility study of a hybrid energy sys-
Besides this flexibility, it contributes towards       tem solution for meeting the rural energy needs
improving the energy balance, preserving natu-         in a sustainable way. The case study area is in
ral resources, and environmental protection            Masvingo rural community, a small farming
(Suzuki et al., 2011; Garcia, 2018). On a small        community about 40 km south of Masvingo, in
scale, biogas systems are easy to build, with low      Masvingo Province, Zimbabwe. Various generic
capital investment costs. Many farms, institu-         implementation models that could be imple-
tions, businesses, households and communities          mented are presented. The aim was to show the
can meet their energy consumption require-             benefits of using RE-based systems, and that

                     61 Journal of Energy in Southern Africa • Vol 31 No 2 • May 2020
such a model can help address energy poverty         services to rural communities through rural
and improve the livelihoods of the rural popu-       electrification and development of new and RE
lation. There is, however, no single solution to     sources such as solar, biomass and wind. The
satisfy all community energy requirements, as        2015 SADC Industrialisation Strategy and
each location has its own site-specific energy       Roadmap is another recent policy document
needs, profile and characteristics. This means       relevant to the energy sector; among other
that appropriate technology choices should be        aspects, it encourages the region to leverage its
guided by resource availability, the energy needs    ample natural resources endowment, including
of the community, and distance from current          energy resources, particularly RE ones. The
and future planned transmission grid in each         strategy encourages use of clean, reliable, effi-
location. It was also important to consider the      cient, sustainable and cost-effective energy sup-
cost of the current and proposed energy ser-         ply sources, while minimising greenhouse gas
vices for the proposed users to make informed        emissions, to address energy security. SADC’s
choices. Hybrid optimization of multiple energy      policy instruments and legal framework are in
resources (HOMER) software was used for the          line with other regional and international com-
simulation and optimisation of the system            mitments, such as the African Union’s Agenda
(Kumar and Deokar, 2018; Ebrahimi et al., 2019).     2063 of 2013 which also identifies energy as
                                                     one of the priority areas (SADC, 2016).
2. Electrification levels for Southern African           The electrification levels for SADC countries
Development Community                                as of 2019 are shown in Table 1. It shows that,
The Southern African Development Commun-             except for Mauritius, Seychelles and to a certain
ity (SADC), in a geographical region of SSA          extent South Africa, the member states have
defined by the SADC Treaty of 1992 (SADC,            very low electrification levels, with urban levels
2020a), support cooperation between its mem-         higher than rural. As mentioned above, many
ber states in relation to socio-economic devel-      factors contribute to the low levels and to the
opment, politics, defence, security and regional     disparities between rural and urban shares, and
integration. SADC has some 26 protocols (legal       across countries. Many rural areas of SSA coun-
agreements ratified by member states) covering       tries including the SADC region suffer from
many areas of collaboration including energy,        poor distribution of grid electricity and/or lack
trade, mining, science and technology, corrup-       of financial resources for grid extension. There
tion, and shared water courses (SADC 2020b).         is also relatively low energy demand in most
Numerous instruments under these protocols           rural areas, making it uneconomic to connect
are discussed in this section. In 1996, SADC         them to the grid, given the high cost of long-
passed the protocol on energy, which provides        range transmission lines. This justifies the use of
a framework for cooperation on energy policy         more decentralised power supply systems,
among member states. Since then, the organisa-       which are modular and can be built anywhere
tion and its member states have engaged in sev-      near the locations of use. Distributed generation
eral strategies and plans to improve access to       options for providing power include stand-alone
energy (Promethium Carbon, 2016). These              renewables, diesel generator sets, or a combina-
include the Energy Activity Plan in 2000, the        tion of these in a hybrid system. The solution for
Energy Cooperation Policy and Strategy in            energy access in SSA and SADC lies in decen-
1996, the Energy Action Plan in 1997, and the        tralised distributed systems based on RE
Regional Infrastructure Development Master           sources. Renewable energy technologies have
Plan and its Energy Sector Plan in 2012. In          many well documented advantages, including
2015, SADC endorsed the Revised Regional             environmental friendliness, and modularity,
Indicative Strategic Development Plan (Revised       especially in the case of technologies such as
RISDP) 2015–2020 to guide the implementation         solar and wind (Hove and Tazvinga, 2010;
of SADC programmes during this period, as            Ashok, 2007). Solar and wind technologies are,
well as to provide approved economic and             however, variable in nature and not many of the
social policies and priorities. Investment in        SSA countries have abundant wind resources,
energy is covered under Priority B on                limiting its application in countries like
Infrastructure in Support of Regional                Zimbabwe and Zambia. In addition, wind data
Integration, and members in the energy sector        for energy generation is generally not available.

                                                     3. Benefits of renewable energy-based
have tried to align all their activities, pro-

                                                     systems
grammes and projects to the Revised RISDP.
One of the energy targets was for at least 70%
of rural communities within southern Africa to       Provision of renewable and affordable energy is
have access to modern energy sources. This           crucial for the reduction of extreme poverty and
implies improved access to affordable energy         for the attainment of the United Nations

                    62 Journal of Energy in Southern Africa • Vol 31 No 2 • May 2020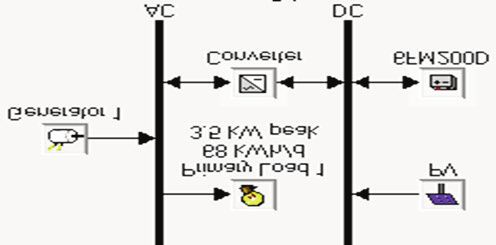
Table 1: Electrification levels for Southern African Development Community countries.
(Index Mundi, 2019; IEA, IRENA, UNSD, WB, WHO, 2019)
Country Total (%) Rural Urban Access target
(% of total) (% of total)
Angola 42 8 73 60% by 2025
Botswana 63 38 80 100% by 2030
Congo (DR) 19 1 49 100% by 2020
Lesotho 34 20 70 Universal access to modern energy
services by 2030
Malawi 13 4 58 30% by 2030
Mauritius 100 100 100 Achieved
Mozambique 27 5 73 100% by 2030
Namibia 53 29 77 Basic social services and infrastructural
facilities in urban and rural areas by 2030
Seychelles 100 100 100 Achieved
South Africa 84 93 68 100% by 2030 with 90% on-grid
connections and remaining access
provided by off-grid connections.
Swaziland 74 67 93 100% by 2025
Tanzania 33 17 65 100% by 2030
Zambia 40 14 75 100% by 2030
Zimbabwe 40 19 86 85% by 2020
Madagascar 13 8 22 100% by 2030
Sustainable Development Goal 7, which calls for efits of RE-based systems. The benefits can be
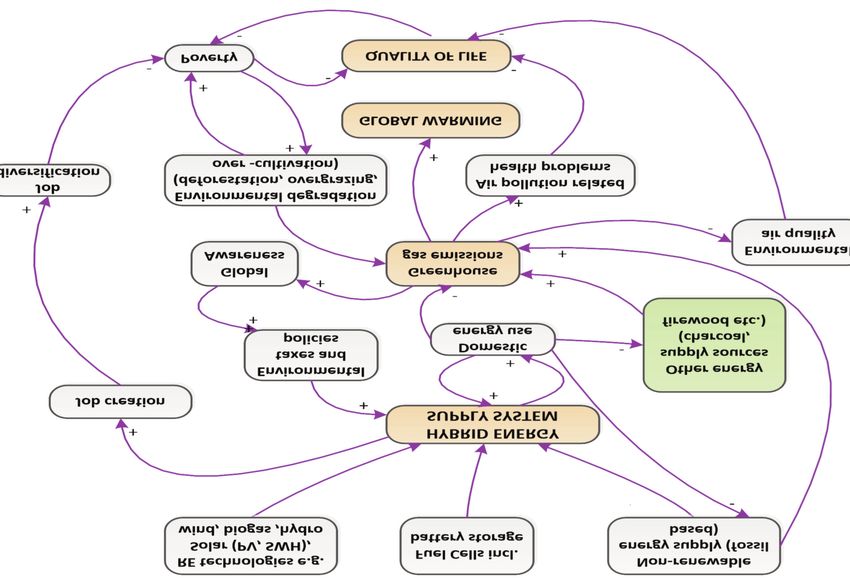
access to affordable, reliable, sustainable and explained using a causal relation diagram
modern energy for all. Figure 1 shows an exam- between any two events. This exists in cases
ple of environmental, economic and social ben- where the occurrence of one causes the other.
Figure 1: Environmental, economic and social benefits of renewable energy systems.
(Tazvinga and Dzobo, 2018)
63 Journal of Energy in Southern Africa • Vol 31 No 2 • May 2020The first event is the cause and the second is • Model 1 – Cash sales: The RE supplier sells
the effect. A positive causal link means the two the RE system directly or through a dealer
events change in the same direction. This to the end-user who becomes the owner of
means that if the start link decreases, the end the system.
link also decreases, and vice versa (Tazvinga et • Model 2 – Credit sales: The end-user ac-
al., 2011). A reduction in greenhouse gas emis- quires the RE system on credit. The credit
sions leads to a reduction in air pollution-related sales are divided into three categories:
health problems caused by the pollutants from • Dealer credit: The RE supplier/dealer
fossil-based fuels. This reduction has a positive sells the system to the end-user, who also
effect on the general well-being of individuals enters into a credit arrangement with the
and communities. supplier/dealer. Depending on the
Figure 1 shows that a decrease in fossil- arrangements, the end-user takes delivery
based fuel usage leads to a decrease in green- of the system, immediately or when all
house gases, especially carbon dioxide build-up payments are made.
in the atmosphere, which in turn reduces the • End-user credit: The supplier/dealer sells
effect of global warming. Implementation of the system to the end-user, who obtains
RE-based technologies has the potential to cre- consumer credit from a third-party credit
ate income through job diversification. This can institution. The end-user usually takes
lead to small enterprise development, which will delivery of the system immediately, or
in turn reduce poverty and promote sustainable when all payments are made.
rural livelihoods. Reduction in poverty results in • Lease/hire-purchase: The supplier/dealer
a decrease in the traditional use of biomass or a financial intermediary leases the sys-
(wood) and related effects such as deforestation, tem to the end-user: At the end of the
overgrazing and over-cultivation, as there is a lease period, ownership may or may not
correlation between poverty and environmental be transferred to the end-user, depending
degradation. This is in agreement with observa- on the arrangements. During the lease
tions by Bimenyimana and Li (2018). An period, the lessor remains owner of the
increase in greenhouse gases increases global system and is responsible for its mainte-
warming and, to mitigate this effect, there is a nance and repair.
need to intensify awareness that can be • Model 3 – Fee for service: An electricity sup-
achieved through educating people on the use ply company (ESCO) owns the system and
of clean RE technologies to reduce the carbon provides energy services to the end-user,
footprint. The increase in greenhouse gas emis- who pays a periodic fee, e.g., monthly, to the
sions results in increased need for awareness ESCO. The end-user is not responsible for
campaigns and implementation of various poli- the maintenance of the RE system and
cies supporting uptake of RE-based energy sys- never becomes the owner, although the
tems and introduction of environmental taxes, end-user may own, e.g., the battery and
resulting in increased use of RE-based hybrid lamps/radio/gas stove.
systems. Increased usage of RE systems then
results in a decrease in greenhouse gas emis- Another concept linked to hybrid systems is
sions and global warming. the micro/mini-grids concept. Mini-grids can be
made of single or multiple generation sources.
3.1 Industry implementation models Mini-grids have considerable potential in the
SADC has put in place various policies and SADC region, but their success lies in the imple-
strategies to address energy access through mentation model adopted. The business models
increased uptake of clean and RE technologies. for mini-grids may include, but are not limited
In light of this, the present study presents some to, the following categories (Roland and Glania,
innovative RE implementation models that can 2011):
be used to encourage widespread affordability • Community-based model: The community
and acceptance of RE technologies in the SADC owns and operates the mini-grid, with a
region, based on global experiences (IEA cooperative often established to own and
Photovoltaic Power Systems (PVPS) Task 9, manage the system. This model usually
2003). When developing a new RE market, it is relies on initial capital support from govern-
important to make informed choices of the ments or philanthropic organisations, as
most appropriate implementation models. It is well as technical support for project imple-
critical to note that the local conditions require mentation. This model is good in that it is
tailored solutions and approaches, or combina- owned by the community and can create
tions of the models described here. The three employment opportunities for locals, and
generic models are: engagement with all parties involved is easy
64 Journal of Energy in Southern Africa • Vol 31 No 2 • May 2020at all levels. However, there is need for a lot larly, developers desire confidence to sell to the
of support as communities often lack tech- grid at an agreed tariff or be otherwise compen-
nical skills and business experience and for sated for their assets if the national grid does
measures to be in place to manage any con- eventually expand into their service territory.
4. Feasibility case study
flicts that can adversely affect project suc-
cess.
• Private sector-based model: A private organ- The present study considered a feasibility case
isation (or organisations) manages the con- study of a Zimbabwean rural farming communi-
struction and operation of the mini-grid, ty. As in most SSA and developing countries,
with varying levels of external financial sup- energy access remains a big challenge in
port, depending on the level of government Zimbabwe, with a rural electrification level of
involvement and type of subsidies available. below 40% as reflected in IEA (2019). There
In this model, skills and experience are the have been many initiatives to address the ener-
key potential success factors. Financial via- gy access issue by the government and donor
bility is important, therefore once the busi- agencies, but there is still a big gap
ness case is established the chances of fail- (Bhattacharyya et al., 2012). The country’s ener-
ure are reduced. The problems associated gy supply is mostly from hydroelectric power
include the possibility of focusing more on and from a few thermal coal power plants. It
profit than serving the community and use has experienced power shortages in recent
of inexperienced personnel. years and some urban households have
• Utility-based model: The national utility is responded by installing PV and solar water-
responsible for the construction and opera- heating systems as well as diesel and petrol gen-
tion of the mini-grid. This model has high erators in urban and off-grid locations.
chance of success because utilities can easily Innovative solar technology applications such
access public-sector financing mechanisms as in street lighting and traffic controls have
and have experience with electrification been demonstrated in some urban areas. It was
projects. However, this model is prone to found that 80–90% of the rural population relies
bureaucratic red tape and delays, external on wood fuel and kerosene for cooking and
political interference and some utilities may lighting (energypedia, 2019). A high proportion
have bias towards grid electrification as of the rural population consists of peasant farm-
opposed to micro-grids from a cost or other ers, who mostly grow maize. Grain-milling is
perspective. thus an important processing activity in most of
• Hybrid model: This involves various combi- these communities and it is usually carried out
nations, such as public-private partnerships by diesel-powered mills. Renewable energy
where the government finances the con- technologies can play an important role in
struction of a mini-grid that is then man- activities such as water-pumping, grain-milling,
aged by a private organisation, or a private- cellphone-charging, hair salons, battery-charg-
ly-owned mini grid that is maintained by the ing, and lighting. Improved lighting extends
community that it serves. As the name study times for learners in rural communities.
implies, this model has high chances of suc- Small businesses within the communities may
cess by combining the benefits of other go a long way in improving livelihoods
models. (Magrath, 2015). Although energy access does
not necessarily guarantee gender equality,
Related to the mini-grid models are the asso- which is also a big challenge globally, it is an
ciated tariffs that could be implemented, and important step towards the emancipation of
these tariffs directly affect sustainability of the women by enabling them to have more time to
mini-grid as well as willingness of developers to engage in productive activities (Bazilian et al.,
venture into this business. Considering that the 2012). An example of solar technology applica-
payback period for mini-grids can be long, the tion in rural communities in Zimbabwe is the
political and regulatory environment are impor- solar-powered borehole water supply for
tant factors for long-term business model sus- Masasa Clinic, primary and secondary schools,
tainability. Developers and investors want to be donated by the Chandiwana Memorial
confident that any agreements, tariff approvals Foundation with support from Frinton Free
or subsidies on which their financial and opera- Church, United Kingdom and Masasa Com-
tional viability depends will be valid for the munity in Chivhu, a small farming community
duration — ideally at least ten years — to ensure about 140 km south of Harare, in Mashonaland
not only cost-recovery but also profitability. East Province, Zimbabwe. The community now
Otherwise key dependencies of their business have access to clean water and do not have to
model may suddenly become annulled. Simi- travel long distances to fetch water. Like other
65 Journal of Energy in Southern Africa • Vol 31 No 2 • May 2020SSA countries, Zimbabwe has a limited supply Table 2: Demand analysis data.
of electricity because of poor distribution of grid Code Appliance No. Power Total
electricity and lack of financial resources for no. rating (W) power (W)
grid extension and generation expansion. In 1 Drug refrigerator 1 300 300
addition, the relatively low energy demand in 2 Clinic lights 15 20 300
most rural areas justifies use of decentralised
3 Computer 1 150 150
power supply systems.
Table 3: Appliance usage matrix.
4.1 System configuration
The considered system architecture is as shown Time Appliances in use
in Figure 2. The system is made up of a PV gen- (hr) 1 2 3 4 5 6 7 8 9
erator, diesel generator, and battery storage. 1:00 1 1 0 0 0 0 1 0 0
The PV generator supplies the load whenever 2:00 1 1 0 0 0 0 1 0 0
PV output is available, otherwise the battery 3:00 1 1 0 0 0 0 1 0 0
storage is dispatched, provided it is within its 4:00 1 1 0 0 0 0 1 0 0
operating limits to meet the supply shortfall. If
5:00 1 1 0 0 0 0 1 0 1
both PV and battery cannot meet the load, the
Table 4: Load profile.
diesel generator is dispatched to ensure that the
load is fully satisfied and to charge the battery.
The PV generator also charges the battery Time Load (kW)
when there is excess PV generation. The system 0 0
design minimises of usage the diesel generator 1 1.5
while maximising utilisation of solar energy 2 1.5
when available thus limiting diesel generator
3 1.5
operation and related maintenance costs.
4 1.5
each appliance, resulting in an N x 1 matrix,
where N is the number of appliances. Table 3
shows that an appliance usage matrix was then
developed, which is a method convenient for
the computation of the load data. The table
shows the time of the day and the appliance in
use for each hour. This 24 x N matrix, when
multiplied by the N x 1 matrix, results in a 1 x
Figure 2: System configuration, where PV, DC
24 matrix that represents the load as shown in
and AC = photovoltaic, direct current, and
Table 4. The load profile was then used as input
alternating current respectively.
in the Homer software to produce the monthly
profiles shown in Figure 3.
The solar resource data used for a location at
4.2 Optimal system considerations -20.079 latitude and 30.838 longitude in
A global standard software for optimising Masvingo Rural District in Zimbabwe was
microgrid design, HOMER, was used to optimise obtained online (NASA Open data portal, nd).
the system under study. An average daily load This was used for the study area in the same
profile for the selected rural community was province because of the unavailability of data at
obtained using a methodology developed by the actual location. The annual average solar
Hove and Tazvinga (2010). This load data was radiation was 5.427 kWh/m2/day and the aver-
used as input in the Homer software to produce age clearness index was 0.542. Figure 4 shows
monthly profiles as shown in Figure 3. An ener- the annual radiation and clearness index for a
gy demand survey was carried out at the poten- location in Masvingo. Clearness index is a
tial site, and the energy demand analysis was dimensionless parameter that indicates the frac-
performed in accordance with the methodology tion of the solar radiation striking the top of the
shown in Table 2. This shows a sample of atmosphere that makes it through the atmo-
required appliances or equipment details such sphere to strike the earth’s surface.
as their number and nominal power that was For the system design, the cost of a 1.5 kW
subsequently multiplied by the number of hours converter was set at USD 900 with a replace-
of operation on a typical day. ment cost of 80% of the capital cost, 90% effi-
The total power was obtained by multiplying ciency and lifetime of 15 years. Converter sizes
the appliance number by the power rating of were optimised between 0 and 6 kW. The diesel
66 Journal of Energy in Southern Africa • Vol 31 No 2 • May 2020Note: The names of the months are abbreviated.
Figure 3: Scaled average daily load profile.
Note: The names of the months are abbreviated.
Figure 4: Average daily radiation and clearness index.
generator should not run at less than the mini- cost of USD 1.50/W. The rated power of the
mum load ratio of 30%. The diesel generator inverter was determined using the peak load. It
was optimised within the range 0–5.5 kW at a is important to choose an inverter that will sat-
cost of USD 1 500, lifetime of 15 000 hours, and isfy a system’s peak-load requirements. Most
the price of diesel in Zimbabwe was set at USD inverters can exceed their rated wattage for lim-
1.20/litre. A diesel generator sometimes does ited periods of time. This is necessary since
not need to be equal or above the peak load.The appliances may require many times their rated
Vision 6FM200D from Vision Battery with a wattage during start up and to accommodate
nominal capacity of 200 Ah (2.4 kWh) and the minimum surge requirement. The power
nominal voltage of 12V for a single battery was rating to match the inverter specifications was
used; and quantities optimised in the range of 0– achieved by multiplying the peak power by a
3 batteries. The battery efficiency was set at factor of 1.2 to account for inverter loss. Some
80% with a minimum state of charge of 40% inverters have the added advantage that they
and a cost of USD 400 per battery. For system have a built-in battery charger so that when the
sizing, solar PV capacity was optimised between batteries need charging from an AC source
0 and 5 kW and panel sizes of 100 W, 250 W (generator), the current can be fed into the
and 300 W from Enersol were considered, at a inverter, changed to DC and then used.
67 Journal of Energy in Southern Africa • Vol 31 No 2 • May 20205. Results and discussion supply mix. The simple and discounted payback
The optimised results in Table 5 show the com- periods are 2.64 and 2.85 years respectively.
bination with the lowest cost of energy as the This is attractive for those willing to invest in
best option and this constitutes a 5 kW PV, 2.5 such systems. Figure 5 shows the cash flow
kW diesel generator and one 2.4 kWh battery. summary for the different system components.
The dispatch strategy is the load following one. Fuel consumption is revealed as the major cost
The operation of the system as observed from of concern. The diesel generator replacement
the results is such that the use of PV is max- costs are also significant compared to battery
imised during the day when the sun is available, and converter replacement costs. The opera-
while the use of the generator is minimised as tional costs and salvage value were low. The PV
much as possible, considering the operation and investment costs were more significant than the
maintenance cost of the diesel generator. The costs of the other components, but there are no
PV system supplies energy during the daytime replacement costs in the lifetime of the system.
and charges the battery. During periods when Figure 6 shows the average monthly elec-
the PV output is not enough to match the load, tricity generation by the PV and diesel genera-
the battery comes in to match the shortfall, pro- tor systems. The PV contribution is significant
vided its charge is within its operating limits. with a penetration rate of 43.4 %. As expected,
When both PV and battery output cannot meet PV generation is low in winter months and
the load, the diesel generator comes in to meet higher in summer months. PV penetration
the imbalance. The diesel generator runs mostly refers to the ratio of total peak PV power to
during the night from about 18h00 and during peak load apparent power, while the renewable
morning hours for the feasibility study area con- fraction is the fraction of the energy delivered to
sidered in this study. The PV system operates the load that originated from renewable power
during the day, while both the battery and gen- sources.
erator come in to match the load whenever the It is critical to consider the cost of extending
PV output cannot meet the load on its own. the grid to determine the cost-effectiveness of
When compared with the diesel generator only an isolated system. The breakeven grid exten-
case, the annual operating cost is much higher sion distance is the distance from the grid that
than for the optimal system although the initial makes the net present cost of extending the grid
cost is low for this case. The difference in the equal to the net present cost of the stand-alone
cost of energy for the two scenarios, i.e., optimal system; in this case it was 7.15 km. The net pre-
and diesel only, is a significant 33.95%. The per- sent cost or life-cycle cost of a system is the
centage difference in diesel consumption is 50%, present value of all the costs of installing and
showing a significant reduction in fuel con- operating that system over the project lifetime,
sumption owing to the use of a hybrid energy minus the present value of all the revenues it
system, i.e., optimal system. earns over the project lifetime. The stand-alone
Table 5 shows a sample of the optimised system is optimal for a location far from the grid
technologies or systems. The PV/DG/B was the and grid extension is optimal nearer to the grid.
most optimum option out of the optimised com- This means that, in terms of cost, it is only eco-
binations. Although the diesel generator-only nomical to connect the grid for distances less
option had the least initial capital costs, it was than 7.15 km, while it does not make any eco-
the least optimum solution because of other nomic sense for any distance exceeding 7.15 km.
associated costs. The grid is far from the site considered, making
These results show that households and prospects of being connected unlikely, as it will
institutions in developing countries such as be too expensive.
Zimbabwe which currently use only diesel gen- It is known that solar PV alone, even on a
erators for their operations can save money by high-power production day, cannot meet the
incorporating PV and storage in their energy load as it is only available during the day. For
Table 5: Optimised results.
System PV DG B Co IC OC TNPC COE REF CS D OH
(kW) (kW) (kWh) (kW) (USD) (USD/yr) (USD) (USD/kWh) (%) (%) (L) (hr)
PV/DG/B 5 2.5 1 3 11538 6764 98001 0.428 34 2 4967 7161
PV/DG 5 2.5 0 3 11138 6830 98444 0.434 32 3 5137 7553
DG/B 0 2.5 1 1 2238 9773 127172 0.553 0 1 7277 8760
DG 0 4 0 0 1500 10896 140785 0.603 0 0 8278 8760
Note: PV = photovoltaic, DG = diesel generator, B = battery, Co = converter, IC = initial capital, TNPC = total net present cost, COE = cost
of energy, REF = renewable energy fraction, CS = capacity shortage, D = diesel, OH = operating hours.
68 Journal of Energy in Southern Africa • Vol 31 No 2 • May 2020Note: Con = converter, PV = photovoltaic, DG = diesel generator, B = battery
Figure 5: Optimal system cash flow summary.
Figure 6: Monthly average electric production by the photovoltaic (PV) and
diesel generator systems.
the diesel generator to meet the load there are domestic use and from boreholes would be pos-
considerable costs involved in terms of fuel and sible. Energy provision also has the potential to
maintenance costs. Combining PV and diesel enable economic activities through the avail-
generator systems results in fuel savings and ability of solar lights, cell phone- and battery-
reduced air pollution. It is beneficial for the charging, as well as increased agricultural pro-
communities to use clean energy for their daily ductivity through the use of the hybrid system
activities when sunshine is available. The results for water-pumping. Use of fossil fuel-based
of the feasibility study have shown that, if an options and batteries in rural communities,
optimal system is implemented, the PV system especially at household level, remain a big chal-
would supply energy during the day and, if the lenge due to the high operational, maintenance,
energy is insufficient to meet the load, the bat- and replacement costs.
tery would cater for the imbalance. In cases While the feasibility case study was done for
when both the PV system and the battery can- a community in the Masvingo rural community
not meet the load, the generator would switch in Zimbabwe, such systems can easily be repli-
on to meet the imbalance, otherwise the gener- cated in any country within the SADC or SSA
ator would mostly run during night when the region, given the good solar resources present.
sun is not available and when the battery Implementation of similar systems in mini-grids,
charge is lower than the minimum permissible has great potential to contribute to energy
limits. Such a hybrid energy system was shown access, while contributing to sustainable devel-
to be a feasible solution for providing energy to opment goals and climate change mitigation.
rural communities and hence have the potential Diesel-only systems readily exist within the
to enable the communities to engage in more region in households and mini-grids. With sup-
productive activities owing to reduced time porting policies, hybrid PV, diesel and battery
spent on activities such as walking long dis- systems have the potential to play a role in the
tances to fetch water, as water-pumping for SADC or SSA region, given the drastic reduc-
69 Journal of Energy in Southern Africa • Vol 31 No 2 • May 2020tion in the cost of PV systems in recent years developing country in sub-Saharan Africa.
and the continued decrease in costs of battery Typical productive activities in the region,
storage systems. Increasing the PV system con- including fabrication, recycling, agro-processing
tribution has a great potential to increase sav- and other services can be powered by such
ings on diesel, while maintaining the hybrid sys- hybrid systems which can potentially be adapt-
tem’s supply reliability. It is also important for ed and replicated in different countries. The
individuals, developers and investors or other hybrid system presented in this work has poten-
interested parties to choose the most favourable tial for replication in other rural settings in
and sustainable implementation model for both
southern Africa, given its good solar resources.
Acknowledgements
single household systems and micro/mini-grid
options.
5. Conclusions
The authors acknowledge the support for this
work provided by the Council for Scientific and
This study has cited research showing that
Industrial Research, the National Research
poverty remains one of the seemingly
Foundation of South Africa and the University of
intractable problems facing the world, with the
Johannesburg, South Africa.
majority of people in the developing regions of
Author roles
the world living without access to many ser-
vices. One of these is modern energy services,
which have the potential to improve health Henerica Tazvinga: research formulation, data
through a cleaner environment, and to facilitate collection, case study system design and simula-
and power productive activities. This could help tions, analytical techniques, implementation
to pull remote communities out of poverty. models, write-up.
Using the Hybrid Optimization of Multiple Oliver Dzobo: research formulation, data collec-
Energy Resources software and data from a tion, case study system design and simulations.
remote study site in Zimbabwe, this study Maxwell Mapako: research formulation, imple-
showed that a hybrid power-generating system mentation models, checked the results of the
would be viable in an off-grid community in a case study and reviewed the text.
References
Abdalla, H.S. and Makame, O.M. 2017. Adoption of the new highly efficient cooking stoves by urban
households in Zanzibar, Tanzania. Journal of Development and Agricultural Economics, 9(11): 320-327.
Adefarati, T., Papy, N.B., Thopil, M. and Tazvinga, H. 2017. Non-renewable distributed generation tech-
nologies: A review. In Handbook of Distributed Generation, 69-105. Springer, Cham.
Ashok, S. 2007. Optimised model for community-based hybrid energy system. Renewable Energy, 32(7):
1155-1164.
Bazilian, M., Nussbaumer, P., Rogner, H.H., Brew-Hammond, A., Foster, V., Pachauri, S., Williams, E.,
Howells, M., Niyongabo, P., Musaba, L. and Gallachóir, B.Ó. 2012. Energy access scenarios to 2030
for the power sector in sub-Saharan Africa. Utilities Policy, 20(1): 1-16.
Bhattacharyya, S.C. 2012. Energy access programmes and sustainable development: A critical review
and analysis. Energy for sustainable development, 16(3): 260-271.
Bimenyimana, S., Asemota, G.N. and Li, L. 2018. The state of the power sector in Rwanda: a progressive
sector with ambitious targets. Frontiers in Energy Research, 6: 68.
Chotia, I. and Chowdhury, S. 2015, November. Battery storage and hybrid battery supercapacitor stor-
age systems: A comparative critical review. IEEE Innovative Smart Grid Technologies, Asia (ISGT
ASIA), 1-6.
Ebrahimi, S., Jahangiri, M., Raiesi, H.A. and Ariae, A.R. 2019. Optimal planning of on-grid hybrid micro-
grid for remote Island Using HOMER software. Kish in Iran. International Journal of Energy, 3(2): 13-
21.
Fulzele, J.B. and Daigavane, M.B. 2015. Optimization of PV-wind hybrid renewable energy system for
rural electrification. In 2015 7th International Conference on Emerging Trends in Engineering &
Technology. Kobe, Japan, November 18-20, IEEE. 101-105.
Hou, B., Liao, H. and Huang, J. 2018. Household cooking fuel choice and economic poverty: evidence
from a nationwide survey in China. Energy and Buildings, 166, pp.319-329.
Index Mundi, 2019, Accessed 01/06/2020), https://www.indexmundi.com/factbook/countries
IEA [International Energy Agency]. 2014. Energy in Africa Today, Africa Energy Outlook,
https://www.iea.org/publications/freepublications/publication/africa-energy-outlook.html.
70 Journal of Energy in Southern Africa • Vol 31 No 2 • May 2020IEA [International Energy Agency]. 2014. Africa Energy Outlook: World Energy Outlook Special Report,
OECD/IEA, Paris.
IEA [International Energy Agency]. 2019. Africa Energy Outlook: Special Report, OECD/IEA, Paris.
https://webstore.iea.org/world-energy-outlook-2019
IEA [International Energy Agency]. 2017. WEO-2017 Special Report: Energy Access Outlook,
OECD/IEA, Paris.
IEA [International Energy Agency], IRENA [International Renewable Energy Agency], UNSD [United
Nations Statistics Division], WB [World Bank], WHO [World Health Organization]. 2019. Tracking
SDG 7: The Energy Progress Report 2019, International Bank for Reconstruction and Development,
Washington DC.
IEA [International Energy Agency], PVPS [Photovoltaic Power Systems]. 2003. 16 Case Studies on the
Deployment of Photovoltaic Technologies in Developing Countries. Available at: http://www.iea-
pvps.org.
Jadhav, A.S., Chembe, D.K., Strauss, J.M. and Van Niekerk, J.L. 2017. Status of solar technology imple-
mentation in the Southern African Developing Community (SADC) region. Renewable and
Sustainable Energy Reviews, 73: 622-631.
Khatib, H. 2012. IEA world energy outlook 2011 – A comment. Energy Policy, 48: 737-743.
Kumar, P. and Deokar, S. 2018. Optimal design configuration using HOMER. Advances in Systems,
Control and Automation, 101-108. Springer, Singapore.
Kumar, P. and Igdalsky, L. 2019. Sustained uptake of clean cooking practices in poor communities: role
of social networks. Energy research & social science, 48: 189-193.
Leckner, M. and Zmeureanu, R. 2011. Life cycle cost and energy analysis of a Net Zero Energy House
with solar combisystem. Applied Energy, 88(1): 232-241.
Magrath, J. 2015. Transforming lives in Zimbabwe: Rural sustainable energy development project.
Oxford, UK: Oxfam GB.
Middlemiss, L. and Gillard, R. 2015. Fuel poverty from the bottom-up: Characterising household energy
vulnerability through the lived experience of the fuel poor. Energy Research & Social Science, 6: 146-
154.
NASA [Surface Meteorology and Solar Energy] Open Data Portal (no date). Surface Meteorology and
Solar Energy | Available at: https://data.nasa.gov/Earth-Science/Surface-Meteorology-and-Solar-
Energy/wn3p-qsan (Accessed: 31 January 2019).
Ogunjuyigbe, A.S.O., Ayodele, T.R. and Akinola, O.A. 2016. Optimal allocation and sizing of
PV/Wind/Split-diesel/Battery hybrid energy system for minimizing life cycle cost, carbon emission
and dump energy of remote residential building. Applied Energy, 171: 153-171.
Petrillo, A., De Felice, F., Jannelli, E., Autorino, C., Minutillo, M. and Lavadera, A.L. 2016. Life cycle
assessment (LCA) and life cycle cost (LCC) analysis model for a stand-alone hybrid renewable ener-
gy system. Renewable energy, 95: 337-355.
Promethium C. 2016. Electricity Market Reform in Southern Africa. Promethium Carbon, Johannesburg.
Quoilin, S., Kavvadias, K., Mercier, A., Pappone, I. and Zucker, A. 2016. Quantifying self-consumption
linked to solar home battery systems: Statistical analysis and economic assessment. Applied Energy,
182: 58-67.
Rahman, H.A., Majid, M.S., Jordehi, A.R., Kim, G.C., Hassan, M.Y. and Fadhl, S.O. 2015. Operation and
control strategies of integrated distributed energy resources: A review. Renewable and Sustainable
Energy Reviews, 51:1412-1420.
Roland, S. and Glania, G. 2011. Hybrid mini-grids for rural electrification: Lessons learnt. Alliance for
Rural Electrification (ARE)/USAID. Brussels, Belgium.
Rosenthal, J., Balakrishnan, K., Bruce, N., Chambers, D., Graham, J., Jack, D., Kline, L., Masera, O.,
Mehta, S., Mercado, I.R. and Neta, G. 2017. Implementation science to accelerate clean cooking for
public health. Environmental health perspectives, 125(1): A3-A7.
SADC [Southern African Development Community], 2020a. History and Treaty.
https://www.sadc.int/about-sadc/overview/history-and-treaty/. Accessed 22 May 2020.
SADC [Southern African Development Community], 2020b. SADC Protocols.
https://www.sadc.int/about-sadc/overview/sa-protocols/. Accessed 22 May 2020.
SADC [Southern African Development Community], SARDC [Southern African Research and
Documentation Centre], 2016. SADC Energy Monitor 2016: Baseline Study of the SADC Energy
Sector. Southern African Development Community and Southern African Research and
Documentation Centre, Gaborone and Harare.
SADC [Southern African Development Community], SARDC [Southern African Research and
Documentation Centre]. 2018. SADC Energy Monitor 2018 – Enabling Industrialization and Regional
71 Journal of Energy in Southern Africa • Vol 31 No 2 • May 2020Integration in SADC. SADC, SARDC. Gaborone, Harare.
SADC [Southern African Development Community], 2016. Renewable Energy and Energy Efficiency
Strategy & Action Plan: REEESAP 2016-2030. Southern African Development Community,
Gaborone.
Sichilalu, S., Tazvinga, H. and Xia, X. 2016. Optimal control of a fuel cell/wind/PV/grid hybrid system
with thermal heat pump load. Solar Energy, 135: 59-69.
Suzuki, A.B.P., Fernandes, D.M., Faria, R.A.P. and Vidal, T.C.M. 2011. Use of biogas in internal combus-
tion engines. Applied Research & Agrotechnology, 4(1): 221-237.
Taha, A.Z. 1995. The oversizing method of estimation in PV systems. Renewable energy, 6(5-6): 487-490.
Tazvinga, H. 2015. Energy optimisation and management of off-grid hybrid power supply systems
(Doctoral dissertation), University of Pretoria, South Africa.
Tazvinga, H., Amigun, B., Stafford, W.H. and Mapako, M. 2011. Can solar-biogas hybrid systems be the
solution to sustainable energy supply in rural areas? Nineteenth Conference on Domestic use of ener-
gy. Cape Town: Cape Peninsula University, 12-13 April, 2011, 203–208.
Tazvinga, H. and Dzobo, O. 2018, April. Hybrid energy systems for rural communities in Zimbabwe. In
Proceedings of the EAI International Conference on Research, Innovation and Development for Africa:
480-492. Institute for Computer Sciences, Social-Informatics and Telecommunications Engineering.
Tazvinga, H. and Hove, T. 2010. Photovoltaic/diesel/battery hybrid power supply system. VDM
Publishers.
Tazvinga, H. and Hove, T. 2010. Technical model for optimising PV/diesel/battery hybrid power sys-
tems, 3rd CSIR Biennial Conference, CSIR International Convention Centre: Pretoria, 1 August - 01
September 2010. Available at: http://researchspace.csir.co.za/dspace/handle/10204/4229.
Tazvinga, H., Thopil, M., Numbi, P.B. and Adefarati, T. 2017. Distributed renewable energy technologies.
In Handbook of Distributed Generation (pp. 3-67). Springer, Cham.
Wang, C. and Nehrir, M.H. 2008. Power management of a stand-alone wind/photovoltaic/fuel cell ener-
gy system. IEEE transactions on energy conversion, 23(3): 957-967.
Wang, Y., Diaz, D.F.R., Chen, K.S., Wang, Z. and Adroher, X.C. 2020. Materials, technological status, and
fundamentals of PEM fuel cells–a review. Materials Today, 32: 178-203.
Vigolo, V., Sallaku, R. and Testa, F. 2018. Drivers and barriers to clean cooking: A systematic literature
review from a consumer behaviour perspective. Sustainability, 10(11): 4322.
Wellinger, A., Murphy, J.D. and Baxter, D. eds. 2013. The biogas handbook: science, production and appli-
cations. Elsevier.
Zakeri, B. and Syri, S. 2015. Electrical energy storage systems: A comparative life cycle cost analysis.
Renewable and Sustainable Energy Reviews, 42: 569-596.
72 Journal of Energy in Southern Africa • Vol 31 No 2 • May 2020You can also read