Rebuttal to review comments on "Revisiting global hydrological cycle: Is it intensifying?" - hessd
←
→
Page content transcription
If your browser does not render page correctly, please read the page content below
Rebuttal to review comments on “Revisiting global hydrological
cycle: Is it intensifying?”
Demetris Koutsoyiannis
Department of Water Resources and Environmental Engineering, School of Civil Engineering, National Technical
University of Athens, Heroon Polytechneiou 5, GR 157 80 Zographou, Greece
Correspondence to: dk@itia.ntua.gr

          It is in the precise proportion that a law once obtained endures this extreme severity of trial, that its value and
          importance are to be estimated; and our next step in the verification of an induction must therefore consist in extending
          its application to cases not originally contemplated; in studiously varying the circumstances under which our causes act,
          with a view to ascertain whether their effect is general; and in pushing the application of our laws to extreme cases.
          (John Herschel, 1880)

           [T]he general attitude which promotes a search for falsifying instances has been most important in the history of
          science. Herschel encouraged this attitude. He demanded that the scientist assume the role of antagonist against his own
          theories, and seek both direct refutations and exceptions which limit the range of application of these theories. Herschel
          believed that the worth of a theory is proved only by its ability to withstand such attacks. (John Losee, 2001)

          The history of science, like the history of all human ideas, is a history of irresponsible dreams, of obstinacy, and of error.
          But science is one of the very few human activities—perhaps the only one—in which errors are systematically criticized
          and fairly often, in time, corrected. This is why we can say that, in science, we often learn from our mistakes, and why we
          can speak clearly and sensibly about making progress there. (Karl Popper, 2002)

          An open society (that is, a society based on the idea of not merely tolerating dissenting opinions but respecting them) and
          a democracy (that is, a form of government devoted to the protection of an open society) cannot flourish if science
          becomes the exclusive possession of a closed group of specialists. (Karl Popper, 1994)

1    Introduction

Zbigniew W. Kundzewicz (2020; hereafter ZWK) and Axel Kleidon (2020; hereafter AK) provided reviews on my
paper (Koutsoyiannis 2020; hereafter “I” —as I am a single author— when I refer to the author, and “paper” or “my
paper” when I refer to the paper in review, while I refer to the present report as “rebuttal”). I am thankful to them for
being eponymous, for their time and effort, and for their comments, which give me the opportunity to provide
clarification in this rebuttal. I hope that the Editor and the reviewers ZWK and AK would understand that I have to
defend my paper and, thus, view (and judge) my rebuttal on criteria of defence and not of noblesse—which may oblige
but may not defend. Overall, in this rebuttal I am trying to persuade the Editor and the Reviewers that most of their
suggestions and comments, if followed, would worsen rather than improve the paper, and to locate those particular
comments that are constructive and beneficial.
      In what follows I visually reproduce in figures all of the reviewers’ comments separated in parts and arranged in
a way that I found easier to discuss. Also I combine the parts of each of the two reviews that are similar. I have
numbered each part (in blue font in each extract) and I present all parts. This presentation does not follow a serial order
but is according to the logical structure that is reflected in the sections of the rebuttal.
        The reviewers share similar concerns, but also have differences in the way they have viewed the paper. Figure 1
contains the reviewers’ final recommendations as well as their summaries of the paper content. I can indeed recognize
my paper in ZWK’s summary (with a question mark in one word in parenthesis, selective, which I am discussing in
section 9 of the rebuttal) but not in AK’s one. ZWK recommends moderate modification while AK recommends
rejection (encouraging resubmission of a more focussed and substantiated manuscript).

                                                                  1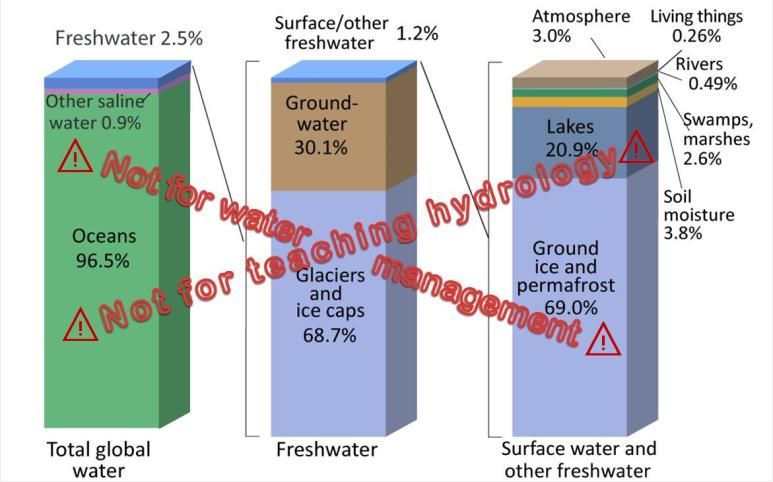
Figure 1. The recommendations and the first paragraphs of the two reviews.

       Obviously, it is disappointing to receive a recommendation for rejection. Despite the fact that such
recommendations for rejections, most often followed by outright rejections, have been quite common for my papers*,
particularly my best ones (e.g. those which later were my most cited), I may have not yet become emotionally immune
to rejection recommendations.
       On the positive side, I found the very review comments encouraging, albeit negative, because, as I will try to
show, they in fact confirm that the paper is publishable. My argumentation is this. In 2016 a Joint Editorial by Editors
of several hydrological journals was published, not only in Hydrology and Earth System Sciences, but also in
Hydrological Sciences Journal, Journal of Hydrology, Journal of Hydrology: Regional studies, Proceedings of the
International Association of Hydrological Sciences, Vadose Zone Journal, and Water Resources Research. Among
other things, the Joint Editorial includes the main points that matter in the evaluation of papers in the review process,
along with those that do not matter. These are reproduced in Figure 2.

* See Koutsoyiannis (2014b); a list of my rejected papers with links to the full rejection files and exchanges can be seen in
http://www.itia.ntua.gr/en/search/?authors=koutsoyiannis&tags=rejected.
                                                             2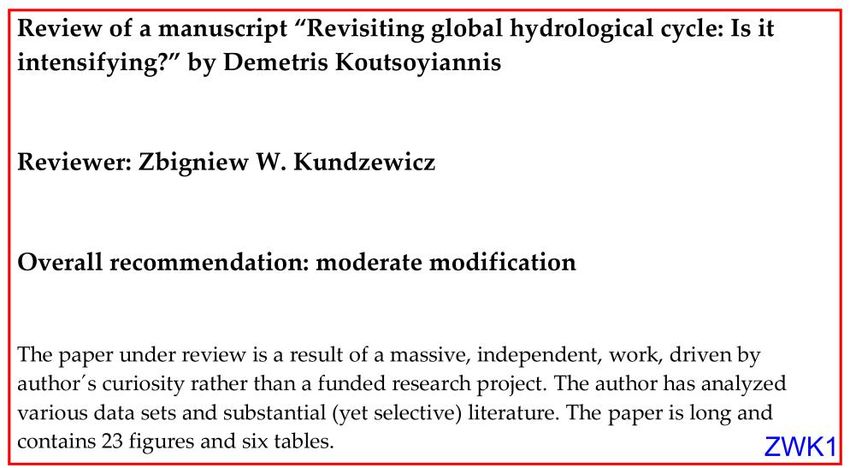
What does not matter in evaluation of papers                        What does matter in evaluation of papers

Figure 2. Images copied from the Joint Editorial (Koutsoyiannis et al., 2016) with lists of points that matter and do not matter
in the evaluation of papers in the review process.

     With reference to the points that do matter in the evaluation of papers (right part of Figure 2), according to my
reading, the review comments confirm that my paper is publishable. Specifically:

     •    There is no mention that anything in my paper is incorrect or mistaken. For me this is the most important,
          given that I have processed a great deal of datasets and tried to extract solid results from every data set.
          Further, no reviewer pointed out any ambiguity.
     •    None of the reviewers states or implies that the paper is trivial. AK does not assess whether it is important or
          unimportant. ZWK finds that I delve in too many important topics.
     •    None of the reviewers doubts the novelty of the paper. The fact that it is not copied from other sources is
          confirmed by the record low Similarity Index (3%) of the Similarity Report, automatically produced through
          the journal. And this low 3% is intentional. It refers to descriptions of the data that I used, which I wanted to
          be faithful to their sources, and to quotations from several sources which are included in the text as quotations.
     •    My analyses and results are global and therefore useful for all regions.
     •    Illustrations of the controversial attitude, as well as that of provoking discussion and thought, and challenging
          established ideas, methods or wisdom, are provided by several external discussions of the paper, published on
          the web.* Most of these comments take a positive stance for the paper †. Some attempt to provide explanations
          for some of my results. But, again, what pleases me the most is that no blogger/commenter has spotted any
          error in my analyses.

Therefore, AK’s reasons for recommending rejection are not understandable to me. Whether or not his approach is
based on, or affected by, the points that do not matter in evaluation of papers (left part of Figure 2) is not my
competence to discuss.

* A list of such discussions can be found in http://www.itia.ntua.gr/2042/. I am thankful to all for their interest in my work and
particularly to Andrew Montford and John Robson for compiling summaries of my paper.
† For the reader’s amusement, I am copying here part of one of the comments by a commenter nicknamed “ludin”: “[T]his guy will

never get through the peer review process. [H]is paper will be rejected because it does not comply with the IPCC doomsday
machine.”
                                                                3
Figure 3. Review comments suggesting splitting the paper in two or three and finding my tone defensive.
2 On defensive tone (and constructive reviewers without prejudices)
As seen in Figure 3, ZWK makes an indirect suggestion, that the paper would be better split in two, three or more, and a
judgment that my tone is defensive. The two issues are indeed related. Perhaps I am defensive. Based on my experience,
I expected difficulties (if not attacks) and I judged that publishing more than one paper would amplify these difficulties.
To this, I wish to add a more general reason that makes me reluctant to follow this suggestion: I try not to contribute to
the fashion of “salami publishing” (Kundzewicz and Koutsoyiannis, 2005; Koutsoyiannis et al., 2016; Quinn et al.,
2018).
But I am surprised for this comment by ZWK and I will explain my reasons. First, if he read the
Acknowledgments, he would see that the paper originated (in part) from my planned lecture that was cancelled because
of political/activist reactions. The mixing of science and politics has unfortunately become a common place, even
within hydrology. I am giving several examples related merely to EGU activities, as HESSD is one of its journals. In
EGU 2020 the session “Communicating A Global Climate Crisis: If our house is on fire, why haven’t we called the fire
brigade…?”* was organized with presentations having titles like “How to Win the New Climate War…”. In EGU 2018,
a hydrologist stated in his talk: “We are all scientists and we are all activists”, without any protest from the audience†. In
EGU 2017, delegates including hydrologists were announcing with pride their participation in a “March for Science”. In
EGU 2010, a Great Debate on Climate Change was organized under the title “To what extent do humans impact the
Earth's climate?”.‡ Showstack (2010) reports, among other things which occurred in this event, that:
Legras§ said that what he reads on the blogosphere makes him concerned about a growth of science illiteracy.
“Science is used for a pretext for issues that are mostly ideological and political. It is very easy to use climate
science as a punching ball, because it is a complex problem,” he said. However, he added it is a good thing for
science to get mixed in with politics. “The social contract with science has changed” and scientists are not
sitting in ivory towers, he noted. “It’s wonderful to take part in a social debate which matters to people. Science
should be mixed with politics and society.
The second reason for my surprise is that ZWK, as Editor of Hydrological Sciences Journal for 18 years, has
rich experience about “constructing reviews without prejudices”. For example, in his Farewell Editorial, Kundzewicz
(2015) has stated:
On one occasion, I was threatened with resignation by an excellent scientist on the Board of Associate Editors if I
accepted a paper deemed hopeless by this Associate Editor, while I regarded it as catchy, thought-provoking and
controversial, hence worthy of publication.
* https://meetingorganizer.copernicus.org/EGU2020/orals/34693; also featured in EGU Today, https://www.egu.eu/egutoday/2020/
friday/.
† I regret that, even though I was in the audience, I did not react; therefore, I avail myself the opportunity of this rebuttal to declare
that I am not an activist.
‡ https://meetingorganizer.copernicus.org/EGU2010/session/4024.
§ I have the impression that here the name is misreported. Based on the video of the event which is available online
(https://www.youtube.com/watch?v=sqzfCRZLCZU), it looks to me that the speaker who said those, is not Bernard Legras but Frans
Berkhout who claimed to “represent IPCC orthodoxy” (time 12:47). In reply to my comment/question (44:40) that consequences are
overstated and science has been mixed with politics, he replied “I say thank God” (57:52) and continued as reported, concluding that
“science should be mixed with politics” (57:48).
4The case he describes is for the study by Anagnostopoulos et al. (2010), in which I was a co-author*. Huard (2011)
called it A black eye for the Hydrological Sciences Journal†, but it was never challenged for its correctness.
All in all, I think ZWK is right in characterizing me defensive and I hope the above remarks justify my stance. It is
also encouraging that ZWK does not find me offensive and polemic. Consistent to my defensive attitude, I wish to
remind that ancient Greek philosophers distinguished science from religion as well as from sophistry, i.e., knowledge
serving other interests or abusing reasoning making trade of unreal wisdom (cf. Taylor, 1919; Horrigan, 2007;
Papastephanou, 2015).
3 On frightening
It was disappointing to read the review comments shown in Figure 4, characterizing some of my formulations
“pathetic” or “hav[ing] no place in a scientific paper”, the latter one followed by an exclamation mark.
Figure 4. Review comments related to my style of writing and the way of expressing myself.
While I am reluctant to expand this brief formulation in the paper, in this rebuttal I have to defend the statements
that the reviewers disliked, as well as to defend my right of freedom of expression and of resisting to censoring.
First, the statement about frightening, whose context, as clearly stated in the paper, is sociological, is true and
scientific. I am giving a few examples to prove that frightening has indeed been a common means in the climate agenda.
Stephen H. Schneider, founder and past editor of the journal Climatic Change and Coordinating Lead Author of
Impacts Assessment Working Group II (WG2) of the Intergovernmental Panel on Climate Change’s (IPCC) Third
Assessment Report, has stated:
So we have to offer up scary scenarios, make simplified, dramatic statements, and make little mention of any
doubts we might have. This 'double ethical bind' we frequently find ourselves in cannot be solved by any
formula. Each of us has to decide what the right balance is between being effective and being honest. (Schneider,
1996).
John Houghton, co-chair of IPCC’s Scientific Assessment Working Group (WG1) and lead editor of the first
three IPCC reports, in an article with title “Global warming is now a weapon of mass destruction” and subtitle “It kills
more people than terrorism, yet Blair and Bush do nothing” had written:
* I appreciate the fact that, a year later, this Associate Editor approached me to let me know that he changed his mind thereafter.
† In our reply (Koutsoyiannis et al., 2011) to the Discussion by Huard (2011) we have published, as Supplementary Information, the
entire review file of Anagnostopoulos et al. (2010) and thus ZWK can recall, rereading his own assessment, whether “assuming an
objective, open, and constructive reviewer, without prejudices” is justified if the paper under review is related to climate. May I also
remind ZWK that several Climategate emails have revealed “secrets” about an activist approach to peer review (cf. the infamous
quotation: “I can’t see either of these papers being in the next IPCC report. Kevin and I will keep them out somehow – even if we
have to redefine what the peer-review literature is!)”.
5As a climate scientist who has worked on this issue for several decades, first as head of the Met Office, and then
as co-chair of scientific assessment for the UN intergovernmental panel on climate change, the impacts of global
warming are such that I have no hesitation in describing it as a "weapon of mass destruction" (Houghton, 2003).
Other IPCC lead authors have agreed that overstatement of consequences is useful. Thus, in the Great Debate
mentioned above, Berkhout said “overclaiming is part of a social process”. *
While I agree with ZWK that the other threats he mentions are also enrolled in the agenda, I believe the urgency
of the hydrological threats is unique. For, the urgency element of sea rise is doubtful (cf. current real estate investments
at beachfront), while the heat waves do not expand to the entire planet.† But, in any case, I do not wish to expand the
paper’s scope to examine those additional threats; rather I am inviting ZWK to a future joint study on those, based on
real world data. For the current paper and for the reason I explained, I continue to believe that without involving
hydrology, the future climate threats are not frightening enough and that my statement in the paper is relevant and
scientific.
Coming to my statement “Arguably, climate has been changing for the entire 4.5 billion-year earth’s history”,
which is also criticized by ZWK as being obvious and unnecessary, again I wish to keep it. It may be obvious to ZWK
but not obvious to everybody. Actually, this was the very title of my blocked talk in Bologna, which is mentioned in the
Acknowledgments. One of the arguments used to block my talk was that there was no climate for that long, so is the
statement trivial?
Finally, the statements that ZWK finds “pathetic” I believe condense the main message of my paper and that is
why they are the concluding statements in the paper. There is support about them, in Section 6 of the paper and its
figures—most importantly, Figure 21 (which ZWK recommends deleting).
4 On focus
Both reviewers found the paper difficult to review and unfocused as seen in their comments reproduced in Figure 5. I
have no doubt that it is difficult to review. That is because it was difficult to make and write up. The paper is based on
very rich information and reflects a great deal of data processing, results and presentations thereof in graphs and tables.
However, I do not agree that the paper is not focused. It is focused on the subject described in its very title: “Revisiting
global hydrological cycle: Is it intensifying?”.
ZWK opines that “the principal take-home message (main highlight) is as follows - Intensification of
hydrological cycles is problematic”. This is his opinion, which noticeably neglects the first part of the title, and it does
not coincide with mine. In my opinion (as I also stated in the submission highlights and in the plain summary), the main
points of the paper are the following:
1. Retrieving a great amount of global hydroclimatic datasets.
2. Revisiting the global hydrological cycle for better quantification.
3. Testing established climatological hypotheses, according to which the hydrological cycle should be
intensifying because of global warming.
4. Outlining a stochastic view of hydroclimate which provides more reliable means to deal with its variability.
As the submission highlights and the plain summary seem to be kept for internal use of the journal and for the review
phase, and are not published with the paper, I plan to include them in the body of a revised version of the paper.
I do not think that it would be problematic that the analyses in my paper be reviewed by “a single referee who is
unlikely to be very competent in all the aspects tackled in the paper.” After all, I too am a single author. What is more,
* In the video mentioned in a previous footnote, Berkhout (time 56:14), found it useful “to create this sense of urgency” (56:03) in a
context of overclaiming for building an agenda.
† Cf. Andrei Illarionov’s (economic adviser to the Russian president Vladimir Putin) quote: “Anyone who is frightened about the
prospect of global warming is welcome to come and live in Siberia”; https://www.theguardian.com/environment/2005/feb/03/
environment.research.
6the journal HESSD enables open review by anyone interested and the paper is available for review for two months.
Thus, a multidisciplinary evaluation is in principle possible.
Figure 5. Review comments referring to the (non-)focus of my paper.
Coming to AK’s comment that “it is unclear what the actual goal of the manuscript is, which could be stated
quite clearly at the beginning as a hypothesis that is to be tested”, I regret that I do not know how to address it, because I
believe that I already state clearly and concisely, in the three paragraphs of the Introduction, both the goals and the way
7to achieve them. It is also interesting that while ZWK finds that I repeat three times the hypotheses I am testing *, one of
which is in the Introduction, AK questions if such hypotheses exist. Also, I do not understand how the author found my
analyses superficial. I believe it is obvious that I have done a “massive, independent, work” (quoting ZWK, Figure 1) in
analyses, in breadth and in depth, so how can this work be superficial? While AK urges to substantiate my claims, his
suggestion is of generic type and I cannot discern anything specific for my paper. The other “general comments” by
AK, I reply in subsequent sections of this rebuttal.
I am pleased by ZWK’s positive reception of my point about the overexploitation of groundwater and its
relationship to sea level rise (Figure 5, ZWK4). I appreciate his assertion that this is overlooked by the disciplinary
experts and his suggestion that this deserves a separate paper, as also does my analysis of the water balance. However, I
have already explained in section 2 of the rebuttal why I decided to make a single global paper on the global
hydrological cycle.
I also appreciate ZWK’s suggestion to move some parts and figures in Appendices, and I am prepared to follow
it in a revised version, after restructuring the paper’s material.
5 On IPCC
AK opines that IPCC’s most recent report (I guess he means AR5 rather than AR4) does a comprehensive work.
Furthermore he finds that the data I use are all associated with large uncertainties and it is thus uncertain if I can
challenge the IPCC claims (Figure 6). If I want to challenge them, he says, I must set my results in the context of the
studies that are synthesized by IPCC.
Figure 6. Review comments referring to the IPCC report.
The fact that my study is independent of IPCC (and not funded) I thought was clear in the paper. ZWK
recognized that it is independent (Figure 1). I feel that any scientist has the right to make an independent study in a
context that this scientist defines, provided that the context is scientific. I think that independent studies are important
for the scientific progress.
I will not follow AK’s suggestion shown in Figure 6. I will not expand the scope of the paper to other subjects
examined by IPCC because I wish to keep the paper focused. My paper is not about IPCC claims in general. It is about
the hydrological cycle. As regards the IPCC claims, my paper discusses just one of them, which is reflected in the title:
“Is it [the hydrological cycle] intensifying?” Just this and nothing else. The intensification claim does not appear merely
in Chapter 2 or Section 2.5 of the WG1 report. It traverses the entire report. I have prepared a (more than 10 pages long)
Appendix attached to this rebuttal, which includes some extracts from several chapters of IPCC AR5 WG1 report,
referring to the intensification of the hydrological cycle. (Notably, I found no appearance of the term deintensification,
which, as shown in my paper, would be justified for the most recent period).
IPCC’s intensification claim is mainly based in the Clausius-Clapeyron relationship. While the validity of this
relationship cannot be questioned, I have shown in the paper that it does not suffice alone for an intensification claim. It
also needs the hypothesis of a constant relative humidity in the atmosphere. Only with this hypothesis, one can make a
*I am curious if ZWK, as IPCC AR5 Review Editor, has noticed how many times this particular 6-7% increase is mentioned in the
IPCC reports. For the WG1 Report see the Appendix to this Rebuttal Report.
8derivation that the global atmospheric water vapour should increase by about 6%–7% per °C of warming (even though
IPCC has preferred to fix this to 7%). The IPCC has asserted that this hypothesis is valid (see Appendix of the rebuttal),
but in the paper I am questioning it.
Furthermore, IPCC claims an intensification of precipitation rate by 1 to 3% °C –1 (which becomes 2 to 3% °C–1
according to AK, also being characterized as a lower expected increase; see Figure 7) and of precipitation extremes with
a higher intensification rate, with model simulated values in the range of 4 to 10% °C –1 (see Appendix, extract from
section 10.6.1 of IPCC AR5 WG1). While IPCC’s results are mostly based on models, my results are based on data and
do not support these IPCC claims.
6 On understanding
The AK’s comment in Figure 7 is a major one and needs an extended discussion. Initially, I did not make any statement
whether or not “our understanding of the hydrological cycle is wrong”. But given AK’s comment, I feel it necessary to
stress my conviction that understanding is a subjective cognitive procedure rather than anything objective. Perhaps a
more relevant term is interpretation, which is also subjective, but more honest in admitting the subjectivity
(Koutsoyiannis, 2014a). In any case, there is no unique type of understanding, nor a single interpretation of a
phenomenon or process. In this respect, my understanding of the hydrological cycle is not necessarily identical to AK’s.
Figure 7. Review comments referring to understanding.
First, in my own current understanding, contrary to AK’s (and contrary to IPCC’s, as seen in some of the
quotations given in the Appendix, e.g. FAQ 3.2: “the atmosphere can hold about 7% more water vapour for each degree
Celsius of warming”), the atmosphere does not hold moisture.* The presence of water in the atmosphere is a matter of
thermodynamic equilibrium of water per se, in its liquid and gaseous phases. The other constituents of the air do not
play a “holding” role. Even without air, the amount of water in gaseous phase would be the same (assuming the same
temperature). The atmosphere, as a whole, determines the temperature profile—but again the moisture plays an
important role (that is why the standard lapse rate is far from the dry adiabatic rate of 9.8 K/km). Hopefully, I explain
this in the paper: In equations (1)-(4) I do not involve the atmosphere and just below equation (4) I state:
It is important to note that all above quantities and derivations do not depend on the presence or not of other
atmospheric gases and hence on the air pressure p.
Second, contrary to what AK implies, I do not think that my calculations are related to the “fast response”.
According to Bala et al. (2010) the fast response refers to a state before any temperature change occurs:
*I too used to use the expression hold (Koutsoyiannis, 2012) which indicates my own earlier misconception. I am thankful to Teresa
López-Arias (2012) for correcting me.
9The fast response or rapid adjustment refers to the adjustment of the stratosphere, troposphere and the land
surface before any change in global- and annual-mean surface temperature (ΔT) occurs. Fast adjustment in
radiative fluxes is also referred to as the adjusted radiative forcing. The response that depends on ΔT is called
the slow response or feedback and is usually represented as change in the specific variable per unit ΔT. For
equilibrium climate change experiments using slab-ocean models forced by instantaneous radiative forcings, the
simulated climate change actually represents the total climate change which is the sum of both fast and slow
responses.
Clearly, these notions imply that there would be changes in the hydrological regime even if ΔT = 0. But I examine the
rainfall changes with respect to the temperature change, i.e. after this has happened. As I understand it, this compares to
IPCC’s expected range of changes from 1 to 3% C–1. Apparently, this cannot be the fast response as it reflects change of
precipitation per unit temperature change. In addition, my paper includes the statement:
Furthermore, Kleidon and Renner (2013), based on analytical calculations and thermodynamics, have estimated
a hydrological sensitivity of 2.2% C–1, within the IPCC “very likely” range.
In my reading, the suggested reference to Kleidon et al. (2015), as far as my approach and my paper are concerned,
confirms the value 2.2% C–1 given in Kleidon and Renner (2013; already cited in my paper).
Last, in my understanding these notions are tightly connected to climate models formalizations, whose details are
out of the scope of my paper. (I have discussed climate models in other papers.) In the paper in review, I mostly use
data—big amounts thereof. I also make comparisons with broad expectations based on climate models, but it is not my
intention to go further into climate model details, as I wish to avoid making an even longer paper with a broader scope.
Therefore, with due respect, I am not planning to include this discussion in a revised version. I think what is already
written is enough.
However, I plan to include in a revised version a reference to another study, Wu et al. (2013) *, which provides a
different interpretation, again based on climate models. Here I am quoting the following statement from its abstract:
Observed land precipitation and global river discharges do not show an increasing trend as might be expected in
a warming world. Here we show that this apparent discrepancy can be resolved when the effects of tropospheric
aerosols are considered. Analysing state-of-the-art climate model simulations, we find for the first time that there
was a detectable weakening of the hydrological cycle between the 1950s and the 1980s, attributable to increased
anthropogenic aerosols, after which the hydrological cycle recovered as a result of increasing greenhouse gas
concentrations.
What I find useful in this latter study is the fact that it involves another factor, different from the greenhouse effect, in
the explanation of what has been observed: tropospheric aerosols.
Furthermore, to indicate the relativity of understanding, I plan to refer to a brand-new study by Seidel and Yang
(2020), who suggest that that the lightness of water vapor helps to stabilize tropical climate by increasing the outgoing
longwave radiation, thus leading to a negative climate feedback. About understanding, Seidel and Yang (2020) point
out that:
The vapor buoyancy feedback represents a substantial departure from the current understanding of the tropical
lapse rate feedback, in which latent heating causes the moist adiabatic lapse rate to decline with climate
warming.
This idea looks consistent with my Figure 3, which depicts the zonal distribution of the difference of the earth
temperature and dew point and, in the tropical zone, indicates smaller increase of the temperature and practically zero
increase of the dew point.
The ideas in the last two studies are quite interesting and worth mentioning as they suggest that just focusing in
one factor affecting climate (such as the greenhouse effect) is not enough. Even including a second factor is not enough
* I am thankful to Peili Wu for drawing my attention to this paper.
10too. I believe that the climate system is complex and resists a deterministic description. That is my understanding and
the reason why I prefer to focus on data and on stochastic descriptions.
7 On water balance
I am pleased that ZWK found my water resources assessment interesting (Figure 8). On the other hand, with reference
to his comment, I feel it necessary to clarify two things which for me are important:
• The analysis of the water balance is not an excursion, as ZWK thinks. It is the central theme of the paper, as
reflected in the first part of the title: “Revisiting global hydrological cycle”.
• I am not criticising the early works on water balance and their pioneering authors. Rather I am an admirer of
them. What I am trying to highlight is the fact that, while these authors had been transparent and also included
notes of caution for their works, later authors overlooked these notes and treated the guesses as true values. I
agree that the big data available now allow estimations and, actually, that was my intention and my humble
contribution in the paper.
Figure 8. Review comments referring to water balance.
8 On data and uncertainties
I generally agree with the overview of uncertainty in data and its consequences, as expressed by ZWK (Figure 9). One
minor but necessary clarification is that in the paper I do not use raw data. All data I use are gridded and come from
reanalyses and satellites. Thus, they are processed data. Yet they are indeed affected by uncertainty.
Figure 9. Review comments referring to data and their uncertainties.
I think I have already incorporated in the original version of the paper this spirit about uncertainty, which is put
forward by ZWK. Thus, in my quantification of groundwater flow I state “Perhaps a statement […] which hides big
disagreements among estimates, hinders the discussion of an important issue. Without an extensive discussion the issue
remains open; hopefully the discussion here has shed some light but it is not the scope of this article to resolve this open
problem.” More generally, in the Conclusions section of the paper I state “The uncertainty in figuring out the global
water balance is still high, despite the recent big data amounts. The sources of uncertainty are many and, as analysed in
the study, need substantial additional efforts to quantify.”
11I am the last one who would hide uncertainty. I have consistently fought, including in this paper, the (false)
certainties and the deterministic paradigm in science, as well as the Markovian stochastic approaches which, in my
opinion, are just one step away from the hell of determinism.
9 On literature review
I am particularly thankful to ZWK for the suggestions of additional references relating to my paper (Figure 10). I will
read all suggested material and cite it in my paper if appropriate. ZWK does not suggest that any of them clashes with
my paper, but I am prepared to modify it if this turns out to be the case.
Figure 10. Review comments referring to additional references.
Coming again to ZWK’s comment in Figure 1 that my substantial literature review is selective, I have already
said in the Introduction of the rebuttal that I have a question mark. If by selective he means that I did not include all
papers that have studied the subject, then he is right. But I think this applies to any paper as nowadays the papers are too
many to be included as references in any other paper. If he means that I was biased in my selection, he is perhaps unfair
with the work I have done and the effort I have put to discover overlooked but significant details, even in very old
papers, and even to digitize several figures from other papers in order to compare their results with mine.
10 On figures
As seen in Figure 11, ZWK has several remarks on the figures of my paper. First, he finds the seasonal oscillations hard
to follow. AK goes a step further (Figure 5, AK2) to write that they “include irrelevant material (like the seasonal
cycle)”. I appreciate that the reviewers find the variability hard to follow or irrelevant. I am aware that it has not been
common in other publications to show the variability. On the other hand, I have the strong conviction that variability
(seasonal or otherwise) is very important and should never be hidden. That is the reason why in my paper I have done
three things that are counter to the current.
1. I show, rather than hide, the seasonal variability.
2. I criticize the popular notion of “anomaly” (meaning abnormality), whose logical background is as poor as if it
was normal for natural processes to follow a straight (e.g. horizontal or sloped) line or a smooth curve.
3. I convert data given as “anomalies” to actual values.
12Figure 11. Review comments referring to the Figures in the paper.
Since these differences with respect to what is regarded “normal” reflect my strong conviction about how to
present natural processes, I am reluctant to remove the variability from my graphs. But I use lighter lines for the
seasonal variation and I always depict the annual averages with thicker lines, so that annual trends be highlighted but
without hiding the variability. The difference in the visual impression of my approach with the standard one is
substantial, as can be seen, e.g., by comparing the graph in the right panel of Figure 1 of my paper with the standard
UAH graph of the temporal evolution of the temperature in the lower troposphere.*
Next, I am discussing ZWK’s specific comments for the particular figures he criticizes, which I have reproduced
here for the reader’s convenience.
Figure 13 of the paper (Figure 12 of the Rebuttal)
Figure 12 (Figure 13 in the paper): Typical depiction of water on Earth (source: USGS; https://www.usgs.gov/special-
topic/water-science-school/science/oceans-and-seas-and-water-cycle and Wikipedia: https://en.wikipedia.org/wiki/
Water_distribution_on_Earth#/media/File:Earth's_water_distribution.svg) with caution stamp added to discourage
considering freshwater as non-renewable reserve.
The reason I am including this graph is extensively explained in the paper: “… water resources are renewable, not
reserves. In this respect, hydrology should fight the common misrepresentation (or even misconception in reports from
media and information provided to the wider public and decision makers), implied by the popular use of graphs like that
in Figure 13…” (followed by several lines). If one makes a google search on images for “water resources”†, one will see
that this graph is among the top highlights and perhaps the only graph for water resources quantification. Schoolkids are
also taught about water resources based on this graph. But the graph is misleading and gives wrong information to
people, with adverse consequences, some of which I discuss in the paper.
For these reasons, I thought it appropriate to include it (along with the “stamps”) in a paper revisiting the
hydrological cycle. But if ZWK is not convinced that, when we wish to depict what water resources are and how they
are related to the hydrological cycle, this popular graph is misleading, then I will (unwillingly) remove it.
* http://www.drroyspencer.com/2020/05/uah-global-temperature-update-for-april-2020-0-38-deg-c/.
† https://www.google.com/search?q=%22water+resources%22&tbm=isch.
13Figure 14 of the paper (Figure 13 of the Rebuttal)
The rationale of Figure 14 is this. Initially, I thought to present my numerical results in a table. Then I thought it makes
more sense to put them in a figure, which would be easier to conceive and understand, even though (for a non-artist) a
table takes much less effort to construct. I have no doubt that ZWK has seen many figures like that, but what I want to
present is not the schematic of the water cycle, but its numerical quantification I have made. Combining the schematic
with the numbers is optimal in my opinion. Therefore, this figure is novel and essential for the paper.
Condensation
Advection (net), A
31 900 km3/year
399 400 km3/year
(1094 mm/year)
123 300 km3/year
Precipitation, PS
(+ transpiration) , EL
Precipitation, PL
(850 mm/year)
431 300 km3/year
(1182 mm/year)
91 400 km3/year
(630 mm/year)
Evaporation, ES
Evaporation
Surface runoff, R
32 000 km3/year
(219 mm/year) Climatic variability
(30-year scale, 95% confidence)
Precipitation and evaporation: ±7%
Runoff and advection: ±23%
depletion, dSG/dt
(2.1 mm/year)
300 km3/year
Groundwater
Groundwater discharge, G
500 km3/year
(3.4 mm/year)
Figure 13 (Figure 14 in the paper): Hydrological cycle and proposed quantification of water balance.
Figure 21 of the paper (Figure 14 of the Rebuttal)
Again, I believe that Figure 21 is essential, as I already mentioned in discussing my optimistic (or, according to ZWK,
pathetic) Conclusions of the paper. I do not agree with ZWK that it is “out of scope, as it refers to several types of non-
water catastrophes”. If one wishes to put the water catastrophes in some context, one should use for comparison some
other, “non-water”, catastrophes, i.e. natural disasters. In turn, if one wishes to see the relative risk from natural
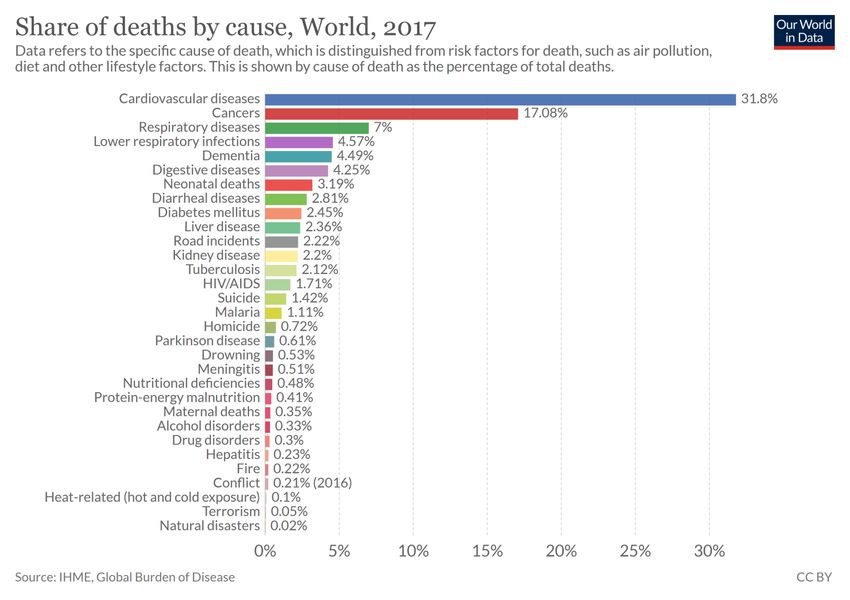
disasters in the context of all risks, one will compare with other causes of death, economic disaster, etc. An example is
given in Figure 15 (not included in the paper and not to be included in the revised version).
In a climate of fear, which has been augmented in the current juncture for several reasons including the Covid
pandemic, I think it is appropriate to see the risk in a cool manner and help the community to expel fear. The best way
to do this is by using science, which according to Epicurus is the enemy of fear and superstition. In this respect,
presentation of scientific data, even affected by some uncertainty, provides good service to the society, I think.
Definitely, my view contrasts the opinion of many who, as discussed in section 3 of the rebuttal, prefer to overstate risks
and offer scary scenarios. But we have seen lately that offering scary scenarios, particularly to the youngsters, has been
damaging.
What is more, Figure 21 of the paper (in contrast to Figure 15 of the rebuttal) shows the temporal evolution of
the related risks. In this respect, it rebuts the lately popular, yet untrue, message that we the people of older generations
have destroyed the lives of the new generations. Also, it shows that we the professional water engineers can be proud
that we have remedied important problems related to people’s lives.
143000
Number of deaths per million of population
Drought
Flood
2500
Extreme weather
Earthquake
2000
Other
1500
1000
500
0
1900s
1910s
1920s
1930s
1940s
1950s
1960s
1970s
1980s
1990s
2000s
2010s
Figure 14 (modification of Figure 21 in the paper, also with modified caption): Evolution of the frequency of deaths from
floods and droughts per decade of the 20th and 21st century. For comparison the deaths other categories of from natural
catastrophes are also plotted: “Extreme weather” includes storm, extreme temperature (cold or heat wave, severe winter
conditions) and fog; “Earthquake” also includes tsunami; “Other” comprises landslides (wet or dry), rock fall, volcanic
activity (ash fall, lahar, pyroclastic flow, lava flow) and wildfire. For the sources of data see Table 1, entry 23.
Figure 15 (Not included in the paper and not to be included in the revised version): Share of deaths by cause worldwide in the
most recent year with available data (2017). Source of graph: https://ourworldindata.org/grapher/share-of-deaths-by-
cause?time=latest.
This discussion is placed merely in the rebuttal and I am not willing to include it in the paper. After ZWK’s
comment, I modified the Figure 21, giving more emphasis to water-related catastrophes, and also changed its caption. I
hope that ZWK would approve this modified version to be included in the revised version.
15Figure 22 of the paper (Figure 16 of the Rebuttal)
As I have already explained (section 8 of the rebuttal) it is my purpose to show, rather than to hide, the uncertainty. In
addition to uncertainty, Figure 22 of the paper shows the huge discrepancy between climate models and reality. As
those IPCC claims that I am trying to challenge have largely been based on models, Figure 22 helps to substantiate my
own claims. It illustrates the fact that the real-world precipitation has not been intensified according to the IPCC
expectations. I hope this replies ZWK’s question about the purpose of including this particular figure.
3.2 2.8
GPCP Multimodel Single model
3.1 2.6
3 2.4
Precipitation (mm/d)
Precipitation (mm/d)
2.9 2.2
2.8 2
2.7 1.8
2.6 1.6
2.5 1.4
Earth Land
2.4 1.2
1940 1960 1980 2000 2020 1940 1960 1980 2000 2020
Figure 16 (Figure 22 in the paper): Comparison of climate model outputs (for specification of which see text) with reality, as
quantified by GPCP satellite observations. “Multimodel” refers to CMIP5 scenario runs, entries: CMIP5 mean – rcp85.
“Single model” refers to CCSM4 – rcp85, ensemble member 0, where CCSM4 stands for Community Climate System Model
version 4, released by NCAR.
11 Other
I am grateful to ZWK for his attentive reading of my paper which made it possible even to spot my typing errors
(Figure 17).
Figure 17. Review comments referring to typing errors in the paper
12 Conclusions
I am very pleased that the reviewers did not find errors in the paper. I have provided rebuttals to most of the review
comments. In the fortunate event that the Editor approves a resubmission of an improved version, I am prepared to
clarify some things which probably misled the reviewers, to restructure the paper moving some parts and some figures
in Appendices, so as to make it easier to read, and to extend the literature review as per ZWK’s suggestions.
References
Anagnostopoulos, G.G., Koutsoyiannis, D., Christofides, A., Efstratiadis, A., and Mamassis, N.: A comparison of local and
aggregated climate model outputs with observed data, Hydrological Sciences Journal, 55 (7), 1094–1110, doi:
10.1080/02626667.2010.513518, 2010.
Archfield, S.A. et al.: Accelerating advances in continental domain hydrologic modelling, Water Resour. Res. 51 (12), 10078-10091,
2015.
16Bala, G., Caldeira, K., and Nemani, R.: Fast versus slow response in climate change: implications for the global hydrological cycle.
Clim Dyn 35, 423–434, doi: 10.1007/s00382-009-0583-y, 2010.
Creed I. F. et al.: Climate warming causes intensification of the hydrological cycle, resulting in changes to the vernal and autumnal
windows in a northern temperate forest. Hydrol. Process. DOI: 10.1002/hyp.10450, 2015.
Déry, S. J. et al.: Observational evidence of an intensifying hydrological cycle in northern Canada. Geophysical Research Letters 36,
L13402, doi: 10.1029/2009GL038852, 2009.
Gloor, M. et al.: Intensification of the Amazon hydrological cycle over the last two decades. Geophysical Research Letters 40, 1729–
1733, doi:10.1002/grl.503774, 2013.
Herschel, J.: A Preliminary Discourse on the Study of Natural Philosophy. London: Longman, Rees, Orme, Brown & Green. 1880.
Horrigan, P.G. (2007), Epistemology: An Introduction to the Philosophy of Knowledge, iUniverse, New Yorlk, USA,
http://books.google.gr/books?id=ZcF76pdhha8C.
Houghton, J.: Global warming is now a weapon of mass destruction. The Guardian, 28 July, p.14, 2003.
Huard D.: Discussion of “A comparison of local and aggregated climate model outputs with observed data”, A black eye for the
Hydrological Sciences Journal, Hydrological Sciences Journal, 56 (7), 1330-1333, DOI: 10.1080/02626667.2011.610758, 2011.
Huntington, T.G.: Evidence for intensification of the global water cycle: Review and synthesis, Journal of Hydrology 319(1–4), 83-
95 doi: 10.1016/j.jhydrol.2005.07.003, 2006.
IMBIE team: Mass balance of the Antarctic Ice Sheet from 1992 to 2017, Nature, 558 (7709), 219–222, doi: 10.1038/s41586-018-
0179-y, 2018.
IMBIE team: Mass balance of the Greenland Ice Sheet from 1992 to 2018, Nature, 579(7798): 233–239. doi:10.1038/s41586-019-
1855-2. 2020.
Kleidon, A.: Interactive comment on “Revisiting global hydrological cycle: Is it intensifying?” by Demetris Koutsoyiannis, Hydrol.
Earth Syst. Sci. Discuss., doi: 10.5194/hess-2020-120-RC2, 2020.
Kleidon, A., Kravitz, B., and M. Renner, M.: The hydrological sensitivity to global warming and solar geoengineering derived from
thermodynamic constraints, Geophys. Res. Lett., 42, 138–144, doi: 10.1002/2014GL062589, 2015.
Kleidon, A. and Renner, M.: A simple explanation for the sensitivity of the hydrologic cycle to surface temperature and solar
radiation and its implications for global climate change, Earth Syst. Dynam., 4, 455–465, doi: 10.5194/esd-4-455-2013, 2013.
Koutsoyiannis, D.: Clausius-Clapeyron equation and saturation vapour pressure: simple theory reconciled with practice, European
Journal of Physics, 33 (2), 295–305, doi: 10.1088/0143-0807/33/2/295, 2012.
Koutsoyiannis, D.: Reconciling hydrology with engineering, Hydrology Research, 45 (1), 2–22, doi: 10.2166/nh.2013.092, 2014a.
Koutsoyiannis, D.: International Hydrology Prize – Dooge Medal 2014: Response, doi: 10.13140/RG.2.2.18103.52646, Dublin, 24
April 2014b.
Koutsoyiannis, D.: Revisiting global hydrological cycle: Is it intensifying?, Hydrol. Earth Syst. Sci. Discuss., doi: 10.5194/hess-
2020-120, in review, 2020.
Koutsoyiannis, D., Blöschl, G., Bárdossy, A., Cudennec, C., Hughes, D., Montanari, A., Neuweiler, I., and Savenije, H.: Joint
Editorial: Fostering innovation and improving impact assessment for journal publications in hydrology, Hydrol. Earth Syst. Sci., 20,
1081–1084, doi: hess-20-1081-2016, 2016.
Koutsoyiannis, D., Christofides, A., Efstratiadis, A., Anagnostopoulos, G.G., and Mamassis, N.: Scientific dialogue on climate: is it
giving black eyes or opening closed eyes? Reply to “A black eye for the Hydrological Sciences Journal” by D. Huard, Hydrological
Sciences Journal, 56 (7), 1334–1339, doi: 10.1080/02626667.2011.610759, 2011.
Kundzewicz, Z.W.: Farewell, HSJ!—address from the retiring editor, Hydrological Sciences Journal, 60 (9), 1463-1472, DOI:
10.1080/02626667.2015.1058627, 2015.
Kundzewicz Z.W.: Interactive comment on “Revisiting global hydrological cycle: Is it intensifying?” by Demetris Koutsoyiannis,
Hydrol. Earth Syst. Sci. Discuss., doi: 10.5194/hess-2020-120-RC1, 2020.
17Kundzewicz, Z.W., and Koutsoyiannis, D.: Editorial - The peer-review system: prospects and challenges, Hydrological Sciences
Journal, 50 (4), 577–590, doi: 10.1623/hysj.2005.50.4.577, 2005.
Lopez-Arias, T.: Comment on ‘Clausius–Clapeyron equation and saturation vapour pressure: simple theory reconciled with practice’
Eur. J. Phys., 33 L11, doi: 10.1088/0143-0807/33/3/L11, 2012.
Losee, J.: A Historical Introduction to The Philosophy of Science, Oxford, 2001.
Madakumbura, G. D. et al.: Event-to-event intensification of the hydrologic cycle from 1.5 °C to a 2 °C warmer world, Scientific
Reports 9, Article number: 3483, 2019.
Mengel, M., Levermann, A., Frieler, K., Robinson, A., Marzeion, B., and Winkelmann, R.: Future sea level rise constrained by
observations and long-term commitment, Proceedings of the National Academy of Sciences, 113 (10), 2597–2602, doi:
10.1073/pnas.1500515113, 2016.
Papastephanou, M.: The ‘lifeblood’of science and its politics: Interrogating epistemic curiosity as an educational aim, Education
Sciences, 6 (1), 1-16, doi: 10.3390/educsci6010001, 2015.
Popper, K.: The Myth of the Framework: In Defence of Science and Rationality, 1994
Popper, K.: Conjectures and Refutations: The Growth of Scientific Knowledge, 2nd Ed., Routledge, 2002.
Quinn, N., Blöschl, G., Bárdossy, A., Castellarin, A., Clark, M., Cudennec, C., Koutsoyiannis, D., Lall, U., Lichner, L., Parajka, J.,
Peters-Lidard, C. D., Sander, G., Savenije, H., Smettem, K., Vereecken, H., Viglione, A., Willems, P., Wood, A., Woods, R., Xu, C.-
Y., and Zehe, E.: Joint editorial: Invigorating hydrological research through journal publications, Hydrol. Earth Syst. Sci., 22, 5735–
5739, https://doi.org/10.5194/hess-22-5735-2018, 2018.
Schneider, S.H.: Don't bet all environmental changes will be beneficial, APS News, 5 (8), August/September 1996.
Seidel, S.D., and Yang, D.: The lightness of water vapor helps to stabilize tropical climate, Science Advances, 6 (19), doi:
10.1126/sciadv.aba1951, 2020.
Showstack, R.: Great Debate on Climate Change Featured at EGU Meeting, Eos, Transactions American Geophysical Union, 91
(23), 207-207, doi: 10.1029/2010EO230003, 2010
Taylor, A.E.: Aristotle, T. C. & E. C. Jack, London, http://www.gutenberg.org/files/48002/48002-h/48002-h.html 1919. (Reprint,
Dover Publications, 1955, http://books.google.gr/books?id=v6pxshF5yrkC).
Wild, M. et al.: Combined surface solar brightening and increasing greenhouse effect support recent intensification of the global
land-based hydrological cycle, Geophysical Research Letters 35, L17706, doi: 10.1029/2008GL034842, 2008.
WCRP (World Climate Research Programme) Global Sea Level Budget Group, Global sea-level budget 1993–present, Earth System
Science Data 10 (3), 1551–1590, doi: 10.5194/essd-10-1551-2018, 2018.
Wu, P., Christidis, N., and Stott, P.: Anthropogenic impact on Earth’s hydrological cycle, Nature Clim Change, 3, 807–810, doi:
10.1038/nclimate1932, 2013.
Ziegler, A. D. et al.: Detection of intensification in global- and continental-scale hydrological cycles: Temporal scale of evaluation, J
Clim, 16, 535-547, 2003.
18You can also read