Wairarapa Corridor Plan Review - Background and Issues Paper October 2009
←
→
Page content transcription
If your browser does not render page correctly, please read the page content below
Page 1 of 55

Wairarapa Corridor Plan Review
Background and Issues Paper

October 2009

WGN DOCS #721653
Page 2 of 55

Contents

Contents........................................................................................................................ 2

Introduction................................................................................................................... 4

Policy context for the corridor plan review................................................................. 6
1.    National context .................................................................................................................. 6
          1.1 New Zealand Transport Strategy 2008                                                                                         6
          1.2 Government Policy Statement (GPS) on Land Transport Funding                                                                 6
          1.3 Safer Journeys 2020                                                                                                         7
          1.4 NZ Energy Strategy and NZ Energy Efficiency and Conservation Strategy                                                       8
2.    Regional context.................................................................................................................. 8
          2.1 Wellington Regional Land Transport Strategy (RLTS) 2007 – 2016                                                             8
          2.2 Proposed Regional Policy Statement (RPS)                                                                                   9
          2.3 Wellington Regional Strategy (WRS)                                                                                         9

Links with other transport and land use studies and plans .................................... 10
3.    State Highway strategies and plans .................................................................................... 10
           3.1 SH2 Upper Hutt to Featherston - short term safety upgrades                                                     10
           3.2 SH2 Muldoons Corner Easing                                                                                     10
           3.3 SH2 Upper Hutt to Featherston Study                                                                            10
           3.4 SH2 Mt Bruce to Featherston Strategy Study                                                                     11
           3.5 Crash Reduction Study - SH2 between Carterton and Masterton                                                    12
           3.6 State highway projects scheduled in the NLTP                                                                   12
4.    Public Transport Plans and Reviews .................................................................................. 13
          4.1 Regional Rail Plan                                                                                            13
          4.2 Wairarapa Bus Service Review                                                                                  13
5.    Land use plans................................................................................................................... 14
          5.1 Proposed Wairarapa Combined District Plan                                                                                 14
          5.2 Waingawa Structure Plan                                                                                                   14
          5.3 Carterton South Structure Plan                                                                                            15
          5.4 Maymorn Structure Plan                                                                                                    15

Transport system pressures and issues................................................................... 16
6.    Land use characteristics..................................................................................................... 16
          6.1 Water shortages and irrigation                                                                                        16
7.    Population ......................................................................................................................... 17
          7.1 Population and household trend between 1996 and 2006                                                                         17
          7.2 Population forecasts                                                                                                         18
8.    Economic, social and lifestyle trends ................................................................................. 19
          8.1 Report on economic profile and projections for Wairarapa Region                                                 19
          8.2 Employment trends                                                                                               21
          8.3 Gross Domestic Product (GDP) trends                                                                             22
          8.4 Income levels                                                                                                   23
          8.5 Household numbers and sizes                                                                                     23
          8.6 Fuel price trends - nationwide                                                                                  24

WGN DOCS #721653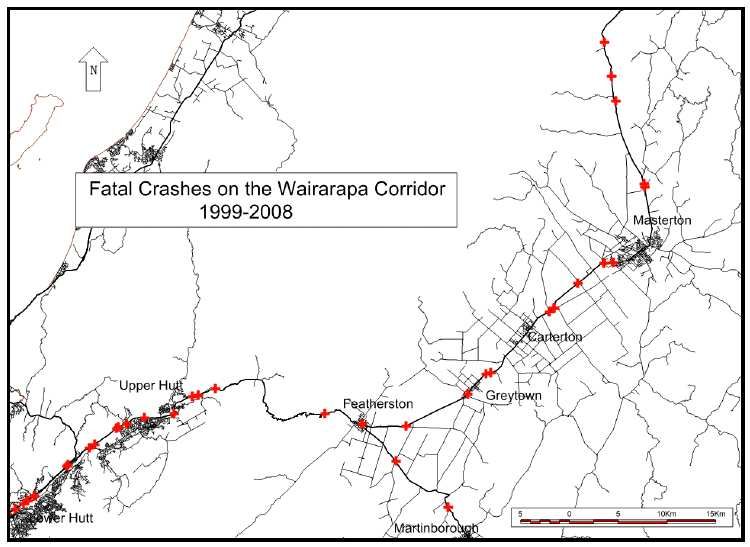
Page 3 of 55
8.7 Car Ownership - Wairarapa 24
8.8 Working from home 26
8.9 Broadband access 26
9. Travel demand and trip patterns......................................................................................... 28
9.1 Road traffic volumes on SH2 from north of Upper Hutt to north of Masterton 28
9.2 Road traffic volumes on SH53 between Featherston and Martinborough 30
10. Public Transport Trends .................................................................................................... 31
10.1 Wairarapa railway line (WRL) Patronage 31
10.2 WRL Capacity 32
10.3 WRL Reliability 33
10.4 WRL Park and Ride capacity 33
11. Span of public transport services........................................................................................ 33
12. Journey to work patterns.................................................................................................... 34
12.1 Trip numbers 34
12.2 Journey to work mode split in 2006 35
12.3 Destination of JTW trips 35
13. Walking and cycling trends ............................................................................................... 36
14. Freight............................................................................................................................... 37
14.1 National freight demands study – September 2008 37
14.2 Key national freight and tourism routes identification 38
14.3 Road freight issues – Wairarapa corridor 38
14.4 Log freight in Wairarapa 39
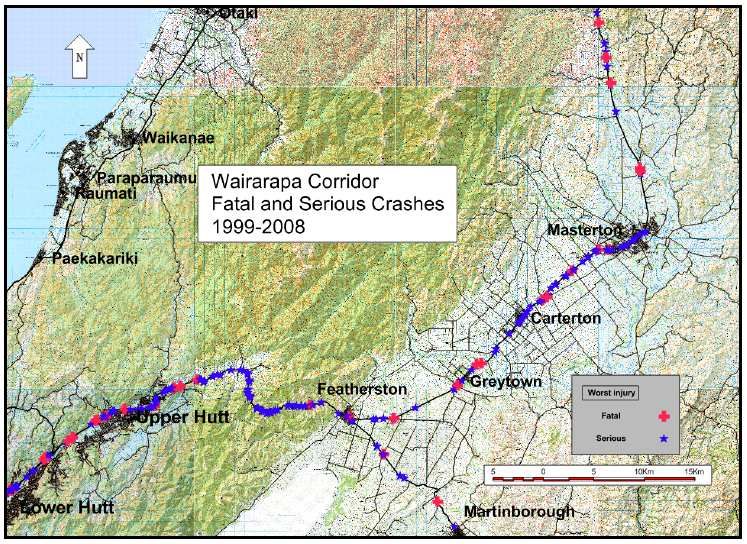
15. Road safety ....................................................................................................................... 41
15.1 Total road crash statistics - Wairarapa 43
15.2 Crash trends by road type 44
15.3 Vulnerable road users 45
16. Inter-regional issues .......................................................................................................... 47
Summary of key pressures ........................................................................................ 48
Summary of key transport trends.............................................................................. 48
Key issues to be considered...................................................................................... 48
List of figures.............................................................................................................. 50
List of tables ............................................................................................................... 51
Appendix A: Review of projects in existing corridor plan .................................. 52
Appendix B: Key Information sources ................................................................. 55
WGN DOCS #721653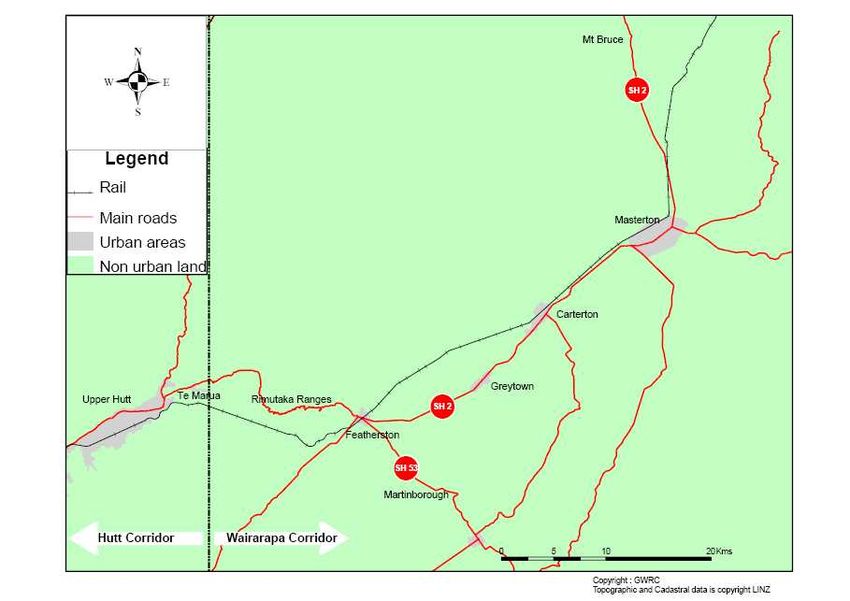
Page 4 of 55

Introduction
The Wairarapa Corridor, for the purpose of regional transport planning, is defined as:

State Highway 2 from north of Te Marua, Upper Hutt, over the Rimutaka Hill through
to Mount Bruce north of Masterton; and the Wairarapa railway line from north of
Maymorn, Upper Hutt, through to Masterton; State Highway 53 between Featherston
and Martinborough.

Figure 1: Extent of the Wairarapa Corridor for the purpose of this plan.

Key outcome
The key outcome for the corridor is - A safer, more reliable road and rail corridor.

WGN DOCS #721653
Page 5 of 55

Current Plan
The current Wairarapa Corridor Plan was adopted in December 2003. It is one of four
corridor plans that sets out the issues and needs in each corridor, and identified transport
projects to address those needs. The Wairarapa Corridor Plan was the first plan, alongside
the Hutt Corridor Plan, to be adopted. It is now due to be reviewed to reflect changes that
have occurred in the past 6 years.

Review process
The review of the existing Wairarapa Corridor Plan will:
•      Ensure alignment of the plan with the strategic direction provided by the Regional
       Land Transport Strategy 2007 – 2016.

•      Update the plan to take account of any new trends, information, transport studies and
       land use policies relevant to this corridor.

This corridor forms an important component of our regional transport network, providing
access both within Wairarapa and between Wairarapa and our other regional centres,
including the Wellington City CBD. The Wairarapa corridor accommodates lesser traffic
volumes and trip making, and is less complex than the other transport corridors in the region.
The scope of the review is expected to reflect this.

The existing corridor plan identifies a number of planned improvements for the first ten
years and the following ten years. Many of the projects identified to progress in the first ten
years have now been partially or fully implemented. The focus of the review will be to
determine whether those projects identified as beyond ten years in the existing plan are still
relevant, whether they should be brought forward, and whether any other projects or
initiatives are required to address emerging issues.

Background work
This paper outlines the current policy framework, links to other transport and land use plans
and policies, the current trends and issues, and a review of projects in the existing corridor
plan. The paper will assist the technical working group to identify any new issues and
therefore gaps that may require additional projects or activities to address them.

WGN DOCS #721653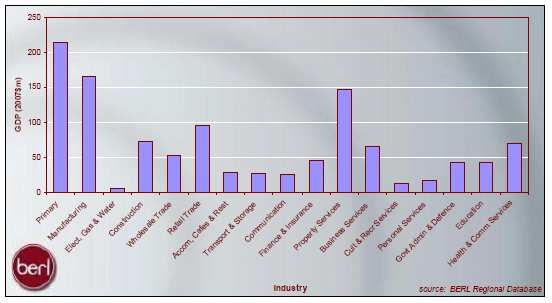
Page 6 of 55

Policy context for the corridor plan review
1.        National context
1.1       New Zealand Transport Strategy 2008

The New Zealand Transport Strategy (NZTS) 2008 provides an update to the previous 2002
strategy. The strategy seeks to provide direction to the transport sector about its role in
supporting the government’s overall vision for sustainability.

The government’s vision for transport in 2040 is that: ‘People and freight in New Zealand
have access to an affordable, integrated, safe, responsive and sustainable transport system.’

The NZTS identifies a number of key challenges for the transport sector if the vision is to be
achieved including responding to climate change, energy security and cost, funding transport
investment while keeping transport affordable, environmental and social impacts of
transport, changing demands from an aging population, land use development and impact on
demand.

The five government objectives for transport are:

•     Ensuring environmental sustainability;
•     Assisting economic development;
•     Assisting safety and personal security;
•     Improving access and mobility; and
•     Protecting and promoting public health.

The strategy establishes targets across the range of objectives, many with long term (2040)
timeframes. This includes the target from the National Energy Strategy to: ‘Halve per capita
greenhouse gas emissions from domestic transport by 2040’.

1.2       Government Policy Statement (GPS) on Land Transport Funding

While the NZTS 2008 has a long-term outlook, the GPS provides for shorter-term ‘impacts’.

The GPS details the government’s desired outcomes and funding priorities for the use of the
National Land Transport Fund to support activities in the land transport sector. The GPS will
be in effect from July 2009 to July 2012.

WGN DOCS #721653
Page 7 of 55

The GPS sets out the ‘impacts’ that the government wishes to achieve through investment in
land transport. These are:

Impacts that contribute to economic growth and productivity
•      Improvements in the provision of infrastructure and services that enhance transport
       efficiency and lower the cost of transportation through:

     improvements in journey time reliability

     easing of severe congestion

     more efficient freight supply chains

     better use of existing transport capacity.

•      Better access to markets, employment and areas that contribute to economic growth.
•      A secure and resilient transport network.

Other impacts
•      Reductions in deaths and serious injuries as a result of road crashes.

•      More transport choices, particularly for those with limited access to a car where
       appropriate.

•      Reductions in adverse environmental effects from land transport.

•      Contributions to positive health outcomes.

The GPS identifies State Highway 1 between Levin and Wellington as a Road of National
Significance (RoNS) for the Wellington Region. This means that the NZ Transport Agency
is likely to give higher priority to funding projects along this route ahead of other projects in
the region.

1.3        Safer Journeys 2020

The government’s Road Safety 2010 strategy is currently being reviewed through
development of a new strategy called Safer Journeys 2020. The strategy is based around a
‘safer systems’ approach which includes safer vehicles, safer roads and roadsides, safer
drivers and safer travel speeds.

In addition to identifying changes to legislation and systems at the national level, the strategy
will signal priorities that local road safety programmes will need to be well aligned with.

WGN DOCS #721653
Page 8 of 55
1.4 NZ Energy Strategy and NZ Energy Efficiency and Conservation
Strategy
The New Zealand Energy Strategy (NZES) to 2050 and its statutory sub-set the New
Zealand Energy Efficiency and Conservation Strategy (NZEECS) were published in October
2007.
The NZES sets the strategic direction for the energy sector, including clear priorities for
investment in renewable energy generation, efficient transmission, efficient energy use and
new technologies. Included in this direction is the need for ‘resilient, low carbon transport’
and the development of policies to encourage greater provision for public transport, walking
and cycling.
The NZEECS sits under the NZES and sets out actions to promote more efficient use of
energy. It focuses on implementation by sector, identifying the main measures, policy
instruments and those responsible for them. For the transport sector, the objective is ‘To
reduce the overall energy use and greenhouse gas emissions from New Zealand’s transport
system’.
NZEECS includes a number of targets against which to assess progress. These include the
following:
• To reduce per capita greenhouse gas emissions from the transport sector by 50 percent
from those in 2007 by 2040; and
• To reduce the kilometres travelled by single occupancy vehicles, in major urban areas
on weekdays, by 10 percent per capita by 2015 (compared to 2007).
2. Regional context
2.1 Wellington Regional Land Transport Strategy (RLTS) 2007 – 2016
The current Wellington RLTS was adopted by Greater Wellington in July 2007 following a
comprehensive review. The strategy identifies a number of objectives, policies, outcomes
and 2016 targets for the region’s transport network.
We note that the strategy is currently being reviewed to update it in accordance with the
amended legislation provided by the Land Transport Management Amendment Act 2008.
The review is expected to result in a ‘refresh’ of the current RLTS rather than a full re-write
as the strategy is fairly robust and is well aligned with current central government direction.
The final Wairarapa Corridor Plan will need to take account of any revised policies coming
out of the RLTS review as these are developed and confirmed.
WGN DOCS #721653Page 9 of 55
RLTS Vision
‘To deliver, through significant achievements in each period1, an integrated land transport
system that supports the region’s people and prosperity in a way that is economically,
environmentally and socially sustainable.’
The following commentary supports the strategy vision and relates to the Wairarapa
corridor:
The local road network will provide local access to the State Highways and the rail network,
which in turn will connect these areas with the Wellington City CBD and other regional
centres. Basic, but reliable, local passenger transport (and Total Mobility) services will be
easily accessible.
The RLTS also contains the following region wide strategic outcomes:
• Increased peak period passenger transport mode share.
• Increased mode share for pedestrians and cyclists.
• Reduced greenhouse gas emissions.
• Reduced severe road congestion.
• Improved regional road safety.
• Improved land use and transport integration.
• Improved regional freight efficiency.
2.2 Proposed Regional Policy Statement (RPS)
The RPS provides the policy framework for resource management issues and land use
planning for the region and is a particularly important document as District Plans are
required to give effect to it.
The proposed RPS includes objectives, policies and methods relevant to travel demand
management. Appropriate provisions in the RPS and District Plans are vital to encouraging
future land use development which supports an efficient and sustainable transport system.
2.3 Wellington Regional Strategy (WRS)
The WRS is a sustainable growth strategy for our region. It was developed by the nine local
authorities in the region, working in tandem with central government and business,
education, research and voluntary sector interests.
Broadband is identified as a key enabler of economic growth, particularly around innovation
and productivity benefits. The potential for broadband to provide access for rural areas and
to reduce travel demand is also recognised. A Regional Broadband Plan to establish a fibre
broadband network for the region has been developed under the WRS. This is currently
being reviewed to align with the government’s broadband investment approach.
1
Short term 0 - 3 years; medium term 4 - 10 years; long term beyond 10 years.
WGN DOCS #721653Page 10 of 55 Links with other transport and land use studies and plans 3. State Highway strategies and plans 3.1 SH2 Upper Hutt to Featherston - short term safety upgrades The NZTA undertook a number of studies for SH2 between Upper Hutt and Featherston to identify what could be done to improve the route. The final crash reduction study report (November 2008) recommended a number of safety improvements that are now being implemented. These include new curve advisory signs, wider edgelines, new no-passing lines, new edge marker posts, extra guardrail, and removal of two short passing lanes. This work is now underway. Further guardrail improvements and road marking trials are scheduled for the 2009/10 year, as funding permits. Electronic curve warning signs (triggered by excessive speed) at ‘Beehive corner’ on the Featherston side of the Rimutaka Hill are also to be investigated. 3.2 SH2 Muldoons Corner Easing On 11 February 2009 the Minister of Transport announced that the Muldoons Corner Easing project would proceed later in 2009. The financial injection provided by the government’s Jobs and Growth plan means that the preliminary work on the project is underway, 30 months ahead of schedule, with earthworks expected to start in September 2009. The $16.5 million upgrade will improve safety by easing a number of tight curves, including Muldoons Corner, will improve visibility, and provide better northbound edge protection from the valley. The Muldoons Corner Easing project was excluded from the study to develop a long term plan for Featherston and Upper Hutt (section 3.1.3) as it had already been subject to comprehensive investigations and economic analysis. The project is expected to take up to three years to complete and has a target completion timeframe of mid 2012. 3.3 SH2 Upper Hutt to Featherston Study A State Highway Plan from Featherston to Upper Hutt was completed in October 2008, by Duffill Watts&Tse Ltd on behalf of the NZTA. The plan identifies issues along this stretch of SH2 and covers growth, security and alignment. The plan notes that the route is considered to reach capacity on special events such as the Martinborough Fair where Average Annual Daily Traffic (AADT) is found to exceed 10,000 Annual Daily Traffic (ADT). The route is forecast to meet/exceed 10,000 ADT around 2046 depending on factors such as demographics, fuel prices and growth rate. It also notes that the perception of acceptable congestion or when a route reaches capacity may change considerably between 2008 and 2046. The study to develop the plan included looking at two tunnel options – one long tunnel covering the whole Rimutaka Hill route, and one short ‘summit tunnel’. The very low WGN DOCS #721653
Page 11 of 55

benefit cost ratios (BCRs) for the tunnels (0.2 and 0.3) meant that they were not included as
viable options in the final plan.

The plan proposes a number of policies, action plans and improvements that combined will
provide for a minimum travel speed of 55km/h, as well as a safe environment for all road
users. The improvement projects include a number of re-alignment schemes, intersection
improvements at Featherston and Upper Hutt, and several passing lanes at a total cost of
around $45m. Many of the improvement projects are grouped on the assumption they would
need to be done together.

The benefit cost ratios of all the proposed combined schemes are marginal at 1.0 or slightly
above. As individual projects the results are very similar, but with three projects falling
below a BCR of 1.0. The only exception is Scheme 2 (bend realignment at Bridge No5 SH2
RP921/4.10-4.40) which has a reasonably high BCR of 3.8, and it is recommended that this
be investigated further.

The Plan states that most schemes are not fundable due to their marginal BCR and therefore
completing the route with a minimum alignment speed of 55km/h should be a long term
planning aim. The timing of the improvements will be dependent on traffic growth and
funding source. In the interim, short term improvements should be gained by ongoing
maintenance and safety improvements.

3.4        SH2 Mt Bruce to Featherston Strategy Study

This strategic highways study was carried out between 1998 and 2000, with the final report
published in September 2000. It covered the section of SH2 from Mt Bruce through to the
intersection of SH2 and SH53 near the northern end of Featherston.

The study looked at SH2 as it runs through both the rural and urban parts of Wairarapa,
including the existing highway and traffic characteristics, capacity, realignments,
intersections, seal widths, passing opportunities, bridges and tunnels, road safety, limited
access, signage, rest areas, effluent disposal sites, pedestrian and cycle facilities, and many
other aspects.

The study concluded by identifying the following needs and issues for the state highway
corridor:
      •   limited opportunity for new passing lanes (other than the newly constructed
          north/south lanes between Masterton and Carterton)
      •   the investigation of Waiohine Bridge for replacement
      •   a new railway overbridge at Opaki
      •   a number of realignment works
      •   the need for additional stock effluent sites at Featherston and Woodville
      •   the need to look at bridges on a case by case basis as to need for additional width to
          accommodate cyclists
      •   several intersection improvements and seal widening

WGN DOCS #721653
Page 12 of 55
• potential future bypasses at Clareville and Masterton (Eastern)
• short-term congestion improvements and long term bypass potential for Carterton
and Greytown.
Some of these things have now been addressed (eg. Waiohine Bridge replacement) and
others remain outstanding.
NZTA reviewed this Study in 2008 with a view to updating it, but decided upon review that
the report was still relevant.
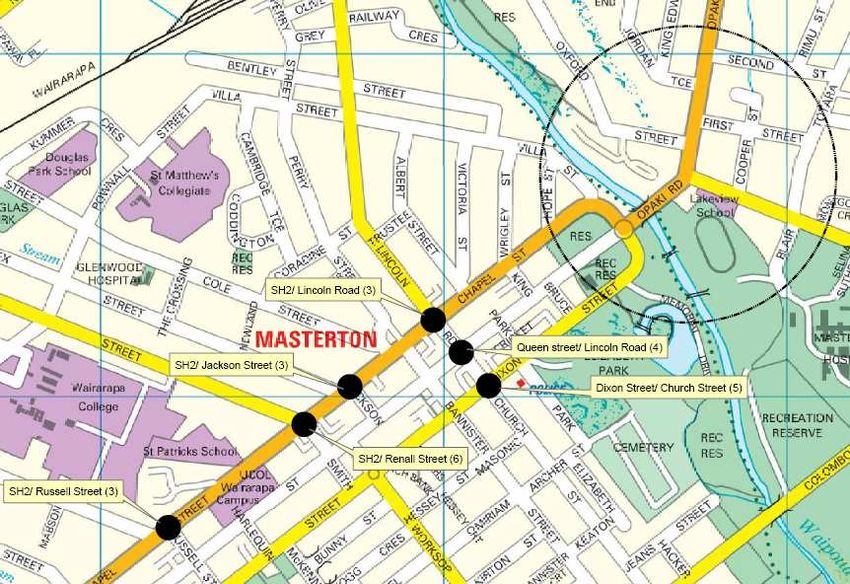
3.5 Crash Reduction Study - SH2 between Carterton and Masterton
MWH is currently finalising a Crash Reduction Study report which covers the section of
SH2 between Carterton and Masterton. This section represents the sixth Network Safety
Corridor that has been identified within the Wellington region. The study aims to identify
potential safety improvements, primarily focusing on the worst intersections.
At this stage there is no specific funding programme for recommended treatments arising
from the study although there are a number of intersections being treated this year from the
safety programme that will be included in the report.
3.6 State highway projects scheduled in the NLTP
There are two capital projects scheduled in current NLTP:
• SH 2 Buchanans Rd intersection (approach to Masterton) – Investigation & Design in
2009-12 NLTP (probable)
• SH 2 Norfolk Rd intersection (linked to Wine Growers Industrial Estate
Development – potential for roundabout on SH2) – Investigation & Design in 2009-
12 NLTP (probable).
Significant maintenance activities scheduled over next three years are:
• Waihenga Bridge Replacement ( Investigation & Design); and
• Upgrading of side protection on Opaki Rail Overbridge (SH 2) scheduled in next 3
years as part of structural renewals programme. Bridge renewal tentatively scheduled
for 20-25 years.
NZTA advise that the balance of the programme is business as usual.
WGN DOCS #721653Page 13 of 55 4. Public Transport Plans and Reviews 4.1 Regional Rail Plan The Wellington Regional Rail Plan, endorsed by Greater Wellington’s Transport and Access Committee on 26 November 2008, provides for the long term development of our region's rail network. It sits alongside the Regional Land Transport Strategy. Implementation of the plan is a condition of ongoing rail funding from various Crown sources. The purpose of the plan is to maintain and grow rail's position as the key transport mode for long to medium distance and high volume transport services over the next 25 years. While projects are already underway for a number of improvements, such as the order for new rolling stock, the plan provides for the longer term improvement of the rail network once current developments are complete. The preferred pathway in the plan includes the base case of committed improvements (many of which are underway or in place already), followed by a number of different scenarios to address reliability, frequency, capacity, journey time and reach (coverage). Rail Scenario One, was given a ‘high’ priority (priority three) amongst the major transport projects for the region in the Wellington Regional Land Transport Programme, adopted in June 2009. In relation to the Wairarapa corridor, the base case included 24 cars for the Wairarapa rail services (18 SW cars that are now in service, plus 6 additional SE cars that currently operate an express service on the Hutt line once all the new Matangi units are in service). In addition, network wide track and signal upgrades that are currently underway will have a positive impact on the reliability of the Wairarapa rail services. No further significant improvement projects, other than station upgrades and park and ride improvements, are planned for rail services north of Upper Hutt are proposed in the first ten years covered by the corridor plan. Under the Rail Scenario B of the preferred pathway that ‘shuttle’ services are proposed between Masterton/Maymorn and Upper Hutt as a way of doubling the current number of Wairarapa line services. This scenario is currently signalled for 2020 and beyond, although this type of initiative could be brought forward depending on progress in developing the rail network, demand, and the availability of suitable rolling stock (eg. the Auckland ‘push-pull’ trains). It is not expected that any future rail shuttle services between Upper Hutt and Masterton would necessitate double tracking of the rail line north of Upper Hutt given the likely frequency of these. Even if future demand required a shuttle service running in both directions at the same time, a passing loop on one section of the track is the most likely solution. 4.2 Wairarapa Bus Service Review A comprehensive review of Wairarapa bus services was undertaken in 2006. As a result, a number of improvements were recommended including additional bus connections to train services, additional inter-peak bus services, some Sunday bus services, 5 day/week Masterton town bus services, initial Wairarapa integrated ticketing products and new Metlink signage. These have since been implemented (see Appendix A for more detail). Another bus service review is expected within the next ten years and it is appropriate that this be signalled in the corridor plan. There is strong integration between bus and rail services in Wairarapa and any future review would need to take account of any plans for rail improvements. WGN DOCS #721653
Page 14 of 55

5.        Land use plans
5.1       Proposed Wairarapa Combined District Plan

The South Wairarapa, Carterton and Masterton District Councils have chosen to prepare a
combined District Plan so that consistent policies and methods will be used to address
Wairarapa’s significant resource management and cross boundary issues.

The Proposed Wairarapa Combined District Plan was publicly notified on 26 August 2006.
The proposed plan is expected to become fully operative in the near future following the
resolution of a few outstanding appeals.

The ‘Significant Resource Management Issues’ identified under the transportation heading
in the plan include:
1. The safe and efficient operation of Wairarapa’s road and rail network can be adversely
   affected by land uses and development, such as through additional traffic volumes on
   busy roads, unsafe access and intersection arrangements, and over use of roads for
   parking.
2. The sustainable growth and development of Wairarapa depends on the capacity and
   efficiency of the transportation network to meet current and future demands.
3. The benefits of maintaining an efficient transport network need to be balanced with the
   adverse effects on the environment that can result from the use and development of the
   network.
4. The safe and efficient functioning of the Hood Aerodrome and its future development
   could potentially be jeopardised by development in close proximity.

The plan recognises that the transportation network is critical to ensuring Wairarapa grows
and develops, and to enable the social and economic wellbeing of the community to prosper.
It states that the transportation network should continue to be developed to support the
strategic and sustainable growth of Wairarapa, and that the transport network and urban
growth need to be managed in an integrated way.

While the rate of urban growth in Wairarapa is not large, there is still a steady and ongoing
demand for urban development, particularly in Masterton and in the larger coastal
settlements. The plan identifies several ‘growth areas’ to accommodate future growth
pressures and ensure that they are planned in an integrated way using structure plans.

5.2       Waingawa Structure Plan

At Waingawa, the industrial zoning has been expanded to provide additional opportunities
for industrial development to occur. A structure plan for the overall development of the
Waingawa industrial site, including potential for an inland log transfer site, has been
included in the Combined District Plan in Appendix 12. This is consistent with the Regional
Freight Plan (2007) and existing Wairarapa Corridor Plan.

WGN DOCS #721653
Page 15 of 55

5.3        Carterton South Structure Plan

A Structure Plan for the South Carterton area has been developed in response to the
submissions from members of the community on the Proposed Wairarapa Combined District
Plan who sought retention of the low density character area and better long term planning for
the area.

The three draft options developed for consultation included identification of some new local
road linkages, pedestrian and cycleways, locations for pedestrian overbridges across railway,
and potential sites for a new shopping centre and school.

The final draft Structure Plan has now been adopted by Carterton District Council. It plan
identifies parts of the study area that would be appropriate for ‘medium density’ residential
development – ie. a minimum lot size of 1000m2, instead of the current 2000m2 under
current provisions. Following the consideration of public feedback, the Council plans to
develop a formal Plan Change to the Combined District Plan.

5.4        Maymorn Structure Plan

Upper Hutt City Council is currently preparing a structure plan to accommodate around 2000
new lots in Maymorn over a 20 year period. This would have implications for both State
Highway intersections and the rail network in terms of accommodating the additional
demand.

Under the Regional Rail Plan, Rail Scenario B sets out a number of passenger transport
options which would support future growth in the Maymorn area.
      •   Additional rolling stock on the Wairarapa Line may mean increased capacity on
          existing services or increased frequency of services between Masterton and
          Wellington.
      •   Rail or bus ‘shuttle’ services are proposed (nominally around 3 trains per hour) that
          will link passengers with peak period services on the electrified network.
Rail Scenario B is scheduled for the year 2020 under the preferred pathway – but could be
brought forward based on need or demand. This scenario does not include extension of the
electrification network through to Maymorn as it is not considered to be viable due to the
expected cost. Other public transport options could include new bus services linking
passengers with Upper Hutt Station or extending park and ride facilities at Upper Hutt
Station

The technical working group decided that issues relating to State Highway 2 intersection
safety and capacity, and future public transport improvements associated with future
development at Maymorn are best considered through review of the Hutt Corridor Plan in
2010.

WGN DOCS #721653
Page 16 of 55
Transport system pressures and issues
6. Land use characteristics
Wairarapa is predominantly rural in character, but has a range of rural, residential,
commercial and industrial land uses. Productive uses in the rural environment range from
intensive horticulture and viticulture through to extensive forestry and pastoral grazing.
Rural land uses are constantly changing and the ongoing prosperity of Wairarapa is largely
dependent upon its continued and evolving primary production sector.
Residential areas include those within the main urban communities of Masterton, Carterton,
Featherston, Martinborough and Greytown, along with smaller coastal and rural settlements.
There are five town centres, as well as a number of smaller neighbourhood shopping centres.
Masterton, as the largest urban area in Wairarapa, has several small suburban shopping
centres in addition to the large central commercial zone. The town centre, centred on Queen
Street, is largely contained within two major arterial streets (Chapel and Dixon), and most
recent retail development has been well accommodated within this area, with adequate
capacity for further development.
Most of the industrial land use is contained within the urban environment, with many
industrial areas forming an integral part of Wairarapa’s towns. However, there are a few
large sites located in the rural environment. In particular, the industrial area at Waingawa,
west of the State Highway 2 Bridge over the Waingawa River, is Wairarapa's principal
heavy industrial area, where large industrial activities have been co-located to concentrate
the adverse effects and to take advantage of excellent road and rail accessibility, and labour
market and services provided by the nearby towns. This area is a logical centre for further
growth in large-scale industrial development.
6.1 Water shortages and irrigation
Like many Eastern areas of NZ, Wairarapa faces summer water
shortages that place limits on the production and therefore
profitability of the various land use types present in the region.
Lack of reliable water is also limiting the ability for the future
productive potential to be achieved. However, the Tararua
ranges receive some of the highest annual rainfall in the North
Island and it is this water that will be captured, stored and released via a water distribution
system2.
The Wairarapa Regional Irrigation Trust is facilitating the development of a storage-based,
region-wide irrigation scheme that will allow the utilisation of the high volume of water
available from the Tararua Ranges in the times when the Wairarapa Valley is facing water
shortages.
The project, which is supported by a grant from the MAF Community Irrigation Fund,
started in July 2008 and is expected to be completed mid 2012.
2
Ministry of Agriculture and Fisheries website - Community Irrigation Fund Project Summary
WGN DOCS #721653Page 17 of 55
7. Population
7.1 Population and household trend between 1996 and 2006
Wairarapa Total
50,000
Household Population
40,000
30,000
20,000 38,505 38,208 38,610
10,000
14,289 14,628 15,273
-
1996 2001 2006
Figure 2: Wairarapa census night population and household growth 1996 - 2006 (Source: Census data,
NZ Statistics)
2000 2001 2002 2003 2004 2005 2006 2007 2008
Masterton 23,200 23,200 23,300 23,300 23,300 23,300 23,200 23,100 23,200
Carterton 6,840 7,000 7,050 7,120 7,170 7,200 7,260 7,300 7,360
South Wairarapa 9,000 8,940 8,990 8,990 9,020 9,050 9,120 9,140 9,190
Total 39,040 39,140 39,340 39,410 39,490 39,550 39,580 39,540 39,750
Table 1: Estimated population in Wairarapa between 2000 and 2008 (Source: NZ Statistics)
The total population of Wairarapa is about 40,000 and has been relatively static over the last
decade. Masterton district has around 23,000 residents, the highest population among the
three Wairarapa districts. South Wairarapa district has about 9,000 and Carterton district has
about 7,400.
The number of households has shown a small increase of around 1000 new households over
the 10 year period.
According to the 2006 Census, about 16.4% of the population in Wairarapa are aged 65 and
above compared to 12.3% for the whole of New Zealand.
WGN DOCS #721653Page 18 of 55
Population Trend Index
115.0 Masterton District Carterton District South Wairarapa District Wellington Region
110.0
105.0
Index
100.0
95.0
90.0
1996 1997 1998 1999 2000 2001 2002 2003 2004 2005 2006 2007 2008
Figure 3: Population trend in Wairarapa between 1996 and 2008
7.2 Population forecasts
According to Statistics NZ’s projection the estimated population growth in Wairarapa will
remain more or less the same between 2006 and 2031. The projections for 2031 for the
whole of Wairarapa range from an additional 3,200 people in the high scenario, to a decline
in population of 4,500 in the low scenario. The medium scenario sees no significant change
in population.
Population change
Population at 30 June
2006–2031
Average
Growth
2006 2011 2016 2021 2026 2031 Number annual
Rate
District (percent)
High 23,700 24,200 24,400 24,600 24,500 1,300 0.2
Masterton Medium 23,200 23,300 23,300 23,200 22,900 22,400 -700 -0.1
Low 22,900 22,500 22,000 21,300 20,400 -2,700 -0.5
High 7,600 7,800 8,100 8,200 8,400 1,100 0.6
Carterton Medium 7,260 7,400 7,500 7,500 7,500 7,400 200 0.1
Low 7,200 7,100 7,000 6,800 6,500 -700 -0.4
High 9,500 9,700 9,800 9,900 9,900 800 0.3
South Wairarapa Medium 9,120 9,300 9,300 9,300 9,200 9,000 -200 -0.1
Low 9,100 8,900 8,700 8,400 8,000 -1,100 -0.5
High 493,100 517,900 541,200 562,900 582,700 116,400 0.9
Wellington Region Medium 466,300 482,800 497,100 509,700 520,500 529,000 62,700 0.5
Low 472,400 476,300 478,500 478,900 476,600 10,300 0.1
Table 2: Projected population between 2006 and 2031 (2006 base). Source: Statistics NZ
WGN DOCS #721653Page 19 of 55
Population projection
30,000
25,000
Masterton
20,000
15,000
South Wairarapa
10,000
Carterton
5,000
0
2006 2011 2016 2021 2026 2031
High Medium Low High Medium Low High Medium Low
Figure 4: Projected population in Wairarapa with different growth rates between 2006 and 2031
8. Economic, social and lifestyle trends
8.1 Report on economic profile and projections for Wairarapa Region
The Wairarapa Chamber of Commerce, in partnership with the Department of Labour,
contracted Business and Economic Research Ltd (BERL) to complete a 20 year report titled
‘Economic profile and projections for the Wairarapa Region – November 2008’.
This report provides an economic profile of the Wairarapa Region in 2007 and its
performance over the last 10 years. It also provides a detailed analysis of key industries, and
projections of employment and GDP to 2026. The report concludes that the key driver
industries are based around primary production and processing. However, retail and tourism
industries are becoming more important.
Key points from the executive summary are provided below:
• In 2007, the Wairarapa Region employed 14,600 Full-Time-Equivalents (FTEs) in
5,670 businesses and generated $1.13 billion in GDP.
• Agriculture-based industries drive the Wairarapa Region economy. These industries
mainly consist of sheep, beef and dairy cattle farming, grape growing in the South
Wairarapa district, and forestry.
WGN DOCS #721653Page 20 of 55
• The primary sector accounts for 20.6 percent of employment and 18.9 percent of
GDP in the Wairarapa Region. Manufacturing, largely food and wood processing,
accounts for 14.6 percent of GDP in the Wairarapa Region. These industries are the
key drivers in the region and could be considered the backbone of the Wairarapa
economy.
• Economic growth in the Wairarapa Region has been mainly positive. Over the last 10
years employment and GDP have grown, but at lower rates than the national average.
In the latest period there has been a noticeable increase in both employment and
business units.
• There has been a decline over the last decade in both the primary and manufacturing
sectors. The impact of this decline has been arrested by growth in other areas such as
accommodation, cafes & restaurants, construction, and business services.
The report provides two scenario projections. The first is a neutral scenario, where industries
in the region grow at the same rate as nationally. The second is a historical scenario, where
industries in the region grow relative to how they have grown over the last 10 years. The
first scenario provides a possible future; the second provides a likely future.
Under a neutral scenario, the Wairarapa Region can expect FTEs to increase by 4,257
between 2007 and 2026. This is a growth rate of 1.3 percent per annum over the 19 year
period. The scenario suggests that employment growth can be spread across all industries,
with the majority of this growth occurring in the manufacturing, retail trade, health &
community services, property & business services, and accommodation, cafes & restaurants
industries.
Under a historical scenario, the Wairarapa Region can expect FTEs to increase by 2,519
between 2007 and 2026. This is a growth rate of 0.8 percent per annum over the 19 year
period. However, employment growth will not be spread across all industries. The vast
majority of this growth is projected to be in the accommodation, cafes & restaurants,
property & business services, health & community services, and construction sectors. Under
this scenario there will be declines in employment in the two main industries – primary and
manufacturing.
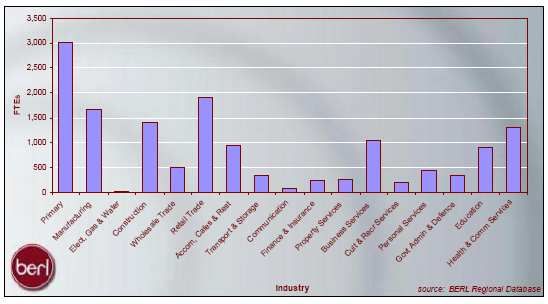
WGN DOCS #721653Page 21 of 55 8.2 Employment trends The graph below illustrates the dominance of the primary, manufacturing and retail trade industries in employment in the Wairarapa region in 2007. Figure 5 Employment (FTEs), Wairarapa Region, 2007 (Source: BERL, 2008) The primary industry in the Wairarapa region was the largest employer in 2007. This industry can be further broken down into the sectors of agriculture, forestry, fishing, and mining. Interestingly, retail is the second largest employer in the Wairarapa region. Nationally, retail trade is the third largest area of employment. It is unusual for a rural primary sector based economy to have a retail sector larger than the national average. This suggests that there is additional retail spending in the region, and it is likely to be due to visitor expenditure. The manufacturing industry is the third largest area of employment in the Wairarapa region. Manufacturing in the Wairarapa region is concentrated in food & beverage manufacturing, solid wood processing (particularly log sawmilling), plywood & veneer manufacturing, and clothing manufacturing. Other important industries in terms of employment include construction, accommodation, cafes & restaurants, health & community services, and business services (BERL 2008). WGN DOCS #721653
Attachment 2 to Report 09.722
                                                                                               Page 22 of 55

Between 1997 and 2007 employment growth in the Wairarapa region was 1.1 percent per annum,
below employment growth of 2.4 percent per annum for New Zealand as a whole.

Those industries that experienced a marked increase in employment numbers during this period
include accommodation, cafes & restaurants with 8.0 percent growth per annum, business services
with 6.7 percent growth per annum, construction with 6.4 percent per annum, and property services
with 5.1 percent growth per annum.

In contrast, manufacturing has experienced a 2.1 percent per annum decrease in employment, while
a 1.2 percent per annum decrease in employment has occurred in the primary industry (BERL,
2008).

8.3       Gross Domestic Product (GDP) trends

In 2007, the largest contributors to Wairarapa GDP were the primary, manufacturing and property
services industries. However, retail trade, construction and business services were also major
contributors.

Figure 6: Gross Domestic Product (GDP), Wairarapa Region, 2007 (Source: BERL, 2008)
Between 1997 and 2007, the accommodation, cafes & restaurants industry increased its contribution
to regional GDP by 6.8 percent per annum; the construction industry increased its share by 5.4
percent per annum; while business services grew 4.7 percent per annum.

The primary and manufacturing industries had negative GDP growth between 1997 and 2007, which
is in contrast to the 1.0 percent per annum (primary) and the 1.4 percent per annum (manufacturing)
achieved nationally (BERL, 2008).

WGN DOCS #671588
Page 23 of 55
8.4 Income levels
Annual income
Below $25,000 $25,001 to $50,000 Over $50,000
Masterton 56% 31% 12%
Carterton 55% 32% 13%
South Wairarapa 51% 32% 17%
Wellington region 46% 31% 24%
Table 3: Income distribution for Wairarapa districts and Wellington region (source: 2006 Census)
The above table shows the percentage of people within three income bands from 2006 census data.
It shows that, overall, Wairarapa residents have lower annual income levels than the region as a
whole.
8.5 Household numbers and sizes
8.5.1 Household numbers 1996 - 2006
While the population in Wairarapa remained stable, the number of households in Wairarapa showed
a small but steady increase between 1996 and 2006.
Household number
10,000 1996 2001 2006
7,500
5,000
2,500
-
Masterton Carterton South Wairarapa
Figure 7: Household numbers in Wairarapa by district (source: NZ Statistics, Census data)
WGN DOCS #671588Page 24 of 55
8.5.2 Household sizes
According to Statistics New Zealand’s prediction, the household size in Wairarapa will decrease
from 2.5 persons per household (population/household) in 2006 to 2.2 in 2031.
So, despite the fact that the population in Wairarapa is expected to be static between 2006 and
2031, decreasing household sizes and increasing numbers of households is likely to result in
some increase in the total number of trips.
8.6 Fuel price trends - nationwide
Taking March 2000 as the base for the petrol price index (i.e. 100), between March 2007 and
September 2008, the petrol price index has increased from 146 to 208, but has recently fallen
again.
Petrol price index
250
200
Index
150
100
50
0
1
2
3
4
5
6
7
8
9
00
00
00
00
00
00
00
00
00
00
.2
.2
.2
.2
.2
.2
.2
.2
.2
.2
ar
ar
ar
ar
ar
ar
ar
ar
ar
ar
M
M
M
M
M
M
M
M
M
M
Figure 8: Fuel price index (with March 2000=100)
Fossil based energy resources are finite, non-renewable and in high demand. While the timing of a
‘peak oil’ scenario is still widely debated, we do know that fuel prices are likely to increase and
become more volatile over time.
8.7 Car Ownership - Wairarapa
Car ownership in Wairarapa showed a steady increase between 1996 and 2006. Overall, Wairarapa
showed a higher growth rate in “Car Ownership per household” and “Car Ownership per person”
compared with Wellington region as a whole.
WGN DOCS #671588Page 25 of 55
Car ownership per household
2.00 1996 2001 2006
1.60
1.20
0.80
0.40
0.00
Wellington Region Masterton District Carterton District South Wairarapa District
Figure 9: Car Ownership per household between 1996 and 2006
Car ownership per person
0.80 1996 2001 2006
0.60
0.40
0.20
0.00
Wellington Region Masterton District Carterton District South Wairarapa District
Figure 10: Car Ownership per person between 1996 and 2006
WGN DOCS #671588Page 26 of 55
8.8 Working from home
18
1996 2001 2006
16
14
12
10
8
6
4
2
0
Wellington City Hutt City Porirua Upper Hutt Kapiti Wairarapa Region
Figure 11: Percentage of people working who work from home, by district. (Source: Statistics New Zealand)
According to Statistics NZ’s census data, Wairarapa has the highest proportion of people who work
from home compared with other parts of the Wellington region. This may be due to the dominance
of farming (agriculture, horticulture and viticulture) and café/accommodation type industries.
However, whilst all other areas saw an increase between 1996 and 2001, and a small decrease by the
following census year (2006), the Wairarapa saw a decrease across both periods, with a significant
drop between 2001 and 2006. Access to high speed broadband, decline in farming, and increasing
employment opportunities in other parts of the region (particularly Wellington City) over this time
period could be key factors affecting further growth in work from home trends in Wairarapa.
8.9 Broadband access
Large parts of Wairarapa, like other rural areas in New Zealand, still have very slow and inefficient
internet connections due to their distance from telephone exchanges. The Wellington Regional
Strategy identifies broadband as a key enabler of economic growth. In addition to innovation and
productivity benefits, high quality broadband infrastructure has social benefits and environmental
benefits, including reducing the need to travel.
In September Minister Steven Joyce released the following statement about the government’s targets
for rural broadband:
WGN DOCS #671588Page 27 of 55
Govt announces targets for rural broadband
Communications and IT Minister Steven Joyce has today announced coverage targets for the roll out of broadband to
rural communities.
He says getting fast broadband to the 25% of New Zealanders living outside the footprint of the government's urban
initiative is a priority.
"Around half of rural households are coping with dial up speeds currently and that's not good enough in the 21st
century."
Mr Joyce says he expects the following to happen within six years:
- 93% of rural schools will receive fibre, enabling speeds of at least 100Mbps, with the remaining 7% to achieve
speeds of at least 10Mbps.
- Over 80% of rural households will have access to broadband with speeds of at least 5Mbps, with the remainder to
achieve speeds of at least 1Mbps.
"Providing fibre to the vast majority of rural schools will effectively deliver the capacity to provide faster broadband to
the communities they serve. Fibre backhaul is currently the primary limiting factor in the delivery of rural broadband
and getting fibre to schools will address that."
Mr Joyce said that the initial focus will be on those areas that will not benefit from Telecom's fibre-to-the-node upgrade
programme.
Mr Joyce says he expects the rural policy to cost around $300 million.
"It is my expectation that this policy will be delivered through a mix of public and private funding.
"We are working with urgency to deliver higher speeds to rural areas. The last thing we want is to see a rural / urban
digital divide develop in this country.
"Rural communities are an integral part of our economy and we cannot afford to let them fall behind. By putting a target
of six years on this part of the roll out, we will in fact achieve fast broadband in rural areas ahead of achieving ultra fast
broadband for most homes in urban areas, and that's appropriate."
On 16 September Minister Steven Joyce confirmed the final details of what is now known as the
Ultra-Fast Broadband Initiative and on 29 September a draft of the Rural Broadband Initiative.
The Rural Broadband Initiative concept is for broadband in rural areas to be significantly upgraded
by pushing out fibre-optic connectivity to rural schools. In our region there are approximately 20
schools that would meet the definition of rural, with around a dozen in the Wairarapa. The proposal
is therefore to focus on the Wairarapa area.
The Wairarapa schools are “strategically” located to serve their rural communities, several of which
are very remote. A network that connected all these schools (and potentially, extensions to
communities like Riversadale Beach) would indeed provide a skeleton network and a first stage of
connectivity for significant portions of the Wairarapa rural community (approx 5,000 people in
total).
Through the WRS Broadband Project, councils throughout the Wellington region have agreed the
following priority work-streams to support delivery of both the Ultra- Fast Broadband and Rural
Broadband Initiatives:
• Establish a stock-take of council policies on access to council assets (eg ducts, pipes, buildings),
including charging regimes and legal agreements with a view to developing a region-wide policy
• To have an agreed position on region-wide rules for aerial deployment
• Develop region-wide rules for new trenching technologies
• Develop an online tool for businesses in the region to access up-to-date information on broadband
speeds and costs.
WGN DOCS #671588Page 28 of 55
9. Travel demand and trip patterns
9.1 Road traffic volumes on SH2 from north of Upper Hutt to north of Masterton
16,000
2000 2001 2002 2003 2004 2005 2006 2007 2008 Average
14,000
Number of Vehicles (AADT)
12,000
10,000
8,000
6,000
4,000
2,000
0
Birchville West of Featherston Greytown Carterton Clareville Masterton North of
Rimutaka Masterton
Hill
Figure 12: AADT from Upper Hutt to North of Masterton (All vehicles)
The above graph is based on the information from NZTA showing the Average Annual Daily
Traffic (AADT) (two way total) between Upper Hutt and North of Masterton in the years between
2000 and 2008 was generally on the increase. Clareville had the highest percentage increase in
AADT. Masterton had the highest number of AADT (14,000) in the region.
On a daily average, around 5,000 vehicles travel over Rimutaka Hill and about 3,000 vehicles
travel “North of Masterton”.
9.1.1 Capacity of SH2 from north of Upper Hutt to north of Masterton
AADT figures suggest that the traffic on State Highway 2 between Masterton and Clareville is well
within the capacity that the road can handle. For reference, in GW’s transport model (WTSM),
State Highway 2 between Masterton and Clareville is assigned to handle 1,400 vehicles per hour
per lane.
In terms of State Highway 2 Rimutaka Hill Road, a recent NZTA study3 noted that the route is
forecast to meet/exceed 10,000 AADT around 2046 depending on factors such as demographics,
fuel prices and growth rate. It also notes that the perception of acceptable congestion or when a
route reaches capacity may change considerably between 2008 and 2046.
3
SH Plan from Featherston to Upper Hutt, October 2008. Prepared by Duffill Watts & Tse Ltd for the NZ Transport Agency.
WGN DOCS #671588Page 29 of 55
1,200
1,000
Number of Vehicles (AADT)
800
600
400
200
2000 2001 2002 2003 2004 2005 2006 2007 2008 2000 2001 2002 2003 2004 2005 2006 2007 2008
0
West of Rimutaka Hill Clareville (North of Carterton)
Figure 13: AADT of Heavy Commercial Vehicles at two locations – near Featherston and Carterton
The traffic volumes of Heavy Commercial Vehicles (HCV) forms part of AADT data for State
Highway 2. The above figure shows the trend of AADT of HCV passing through two locations
at SH2 between years 2000 and 2008.
Generally, the number of HCV across these two locations is generally on the increase. We
believe that the data of 2003 is potentially inaccurate and should probably be disregarded as a
result. Of note is a significant drop in HCV volumes at Clareville between 2007 and 2008,
possibly related to the current economic recession.
WGN DOCS #671588Page 30 of 55
9.2 Road traffic volumes on SH53 between Featherston and Martinborough
3,000
2,500
Number of Vehicles (AADT)
2,000
1,500
1,000
500
2000 2001 2002 2003 2004 2005 2006 2007 2008 2000 2001 2002 2003 2004 2005 2006 2007 2008
0
West of Donalds Bridge (Featherston) West of Princess St (Martinborough)
Figure 14: AADT (all traffic) at two locations on SH53
Based on information from NZTA, the AADT along SH53 between 2000 and 2008 was quite stable
overall, showing a slightly increasing trend. When comparing the figures between 2000 and 2008,
Featherston showed a 15% increase; and Martinborough has a 17% increase.
WGN DOCS #671588You can also read