The Economic Burden of Tuberculosis in Indonesia - December 2013 Management Sciences for Health 784 Memorial Drive Cambridge, MA 02139, USA ...
←
→
Page content transcription
If your browser does not render page correctly, please read the page content below
The Economic Burden of Tuberculosis in Indonesia

                                 December 2013

Management Sciences for Health
784 Memorial Drive
Cambridge, MA 02139, USA
www.msh.org
The Economic Burden of Tuberculosis in Indonesia
This study was made possible through the support for the TB CARE I provided by the U.S.
Agency for International Development (USAID), under the terms of cooperative agreement
number AID-OAA-A-10-00020.
Abstract
Understanding the economic burden to society from a disease like TB is important as it can be
used as evidence when advocating for greater investment. This report describes the development
of a tool to estimate the economic burden of TB in Indonesia and the results stemming from its
use. The development and use of the tool was requested by the Director of the National TB
Control Program to assist with advocacy for greater resources.
In Indonesia in 2011 there were an estimated 441,940 new active TB cases of which 321,411
were treated for first-line TB and 4,267 new MDR-TB cases of which 286 started treatment. It is
estimated that 286,560 of these cases would have been treated and cured, 59,662 would have
self-cured and 95,718 would eventually die.
Based on this 2011 cohort the total number of years of life lost would be about 1.9 million and
the total number of years of productive life lost would be about 1.5 million. The total economic
burden would be roughly US$ 2.1 billion1. Loss of productivity due to premature death would be
by far the largest element, comprising 63% of the total cost. Loss of productivity due to
disability, medical costs and direct non-medical costs incurred by patients and their households
are likely to be 31%, 3.6% and 0.4% respectively of the total economic burden. Note that this is
the economic burden that will be borne over a number of years related to the number of new
infections in 2011.
The model shows that increasing the number of cases treated has a major impact on the
economic burden. If, for example in 2011, the 2016 treatment targets could have been met, the
TB treatment rate would have been 92.7% instead of 72.7% and the MDR-TB treatment rate
would have been 31.4% instead of 6.7%. The resulting economic burden would have been only
US$ 1.3 billion instead of US$ 2.1 billion. An investment of an additional US$ 35 million in
medical costs (US$ 0.14 per capita) would have resulted in an overall saving of US$ 800 million
(US$ 3.36 per capita). The number of TB-related deaths would have been reduced by 37% - from
95,718 to 59,876. This shows clearly value of investing in scaling up TB services.
Recommended Citation
This report may be reproduced if credit is given to TB CARE I. Please use the following citation:
Collins, D., F. Hafidz and C. Suraratdecha. December, 2013. The Economic Burden of
Tuberculosis in Indonesia. TB CARE I - Management Sciences for Health. Submitted to USAID
by the TB CARE I Program: Management Sciences for Health. Information shown in the
Annexes may not, however, be quoted or reproduced separate from the rest of the document
without the written permission of Management Sciences for Health.
1
All monetary figures in this report are in 2011 US$.
TB CARE I / MSH Page ii December 2013The Economic Burden of Tuberculosis in Indonesia
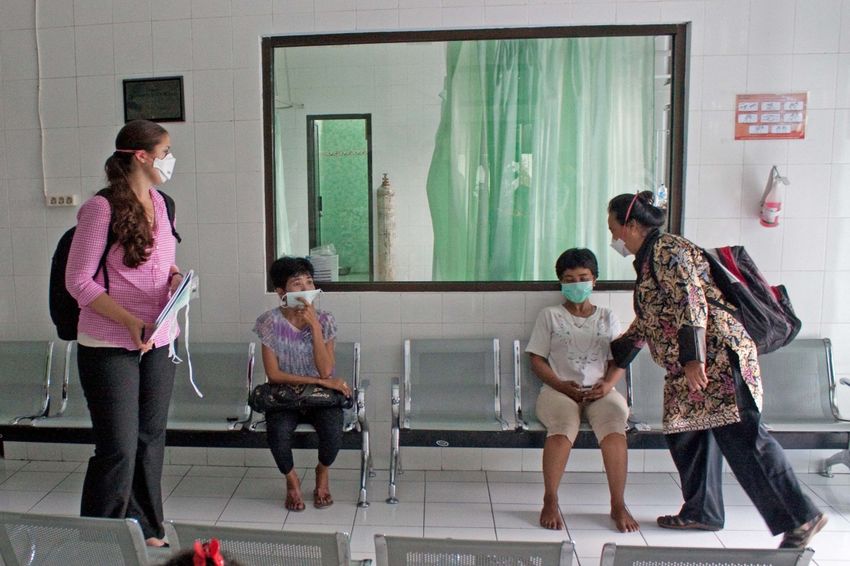
Photo by David Collins. MDR-TB patients being interviewed in an Indonesian public hospital.
Key Words
TB, Indonesia, Economic Burden, Sustainability, Advocacy, Planning, Budgeting, Cost, Exit
Strategy
Disclaimer
The authors’ views expressed in this publication do not necessarily reflect the views of the
United States Agency for International Development, the United States Government or the
Government of Indonesia.
Management Sciences for Health (MSH)
784 Memorial Drive
Cambridge, MA 02139
Tel: +1(617) 250.9500
Fax: +1(617) 250.9090
www.msh.org
Management Sciences for Health
c/o KNCV Tuberculosis Foundation Indonesia
Gedung Menara Bidakara 2, Lt.18
Jl. Jend. Gatot Subroto Kav. 71-73
Pancoran – Jakarta Selatan 12870
TB CARE I / MSH Page iii December 2013CONTENTS
Contents
ACRONYMS....................................................................................................................................v
ACKNOWLEDGEMENTS ............................................................................................................ 6
EXECUTIVE SUMMARY............................................................................................................. 7
1. THE ECONOMIC BURDEN OF TB AROUND THE WORLD......................................... 9
2. TB IN INDONESIA ............................................................................................................... 9
3. METHODOLOGY ............................................................................................................... 10
4. TREATMENTS AND OUTCOMES ................................................................................... 11
5. COSTS .................................................................................................................................. 16
Medical services costs ........................................................................................................................... 16
Patient costs ........................................................................................................................................... 16
Productivity losses due to temporary disability ................................................................................. 17
Productivity losses due to premature death ....................................................................................... 18
Summary of costs .................................................................................................................................. 19
6. SCENARIOS ........................................................................................................................ 23
7. COMPARISONS .................................................................................................................. 24
8. CONCLUSIONS .................................................................................................................. 25
9. LIMITATIONS .................................................................................................................... 25
10. RECOMMENDATIONS ................................................................................................. 26
ANNEXES .................................................................................................................................... 27
Annex 1. Demographic and disease data sources .............................................................................. 28
Annex 2. Cost data sources .................................................................................................................. 29
Annex 3. References ............................................................................................................................. 30
TB CARE I / MSH Page iv December 2013ACRONYMS
AIDS Acquired Immune Deficiency Syndrome
ATM HIV/AIDS, Tuberculosis, and Malaria
DOTS Directly Observed Therapy, Short-course (the Internationally
Recommended Standard for Tuberculosis Control)
GF Global Fund
HIV Human Immunodeficiency Virus
KNCV Koninklijke Nederlandse Centrale Vereniging tot bestrijding der
Tuberculosis
MDR-TB Multi-Drug Resistant Tuberculosis
MOH Ministry of Health
MSH Management Sciences for Health
NTP National Tuberculosis Control Program
TB Tuberculosis
TB CARE I Tuberculosis CARE I Program
USAID United States Agency for International Development
WHO World Health Organization
XDR-TB Extremely Drug-Resistant Tuberculosis
TB CARE I / MSH Page v December 2013ACKNOWLEDGEMENTS The authors wish to thank Dr. Dyah Mustikawati, Director of the National Tuberculosis Program (NTP), and her staff as well as and other senior officials of the Ministry of Health. The authors also wish to thank the members of the USAID team who support the TB control program and the Global Fund against AIDS, Tuberculosis, and Malaria (GFATM) program team, as well as his MSH colleagues Julie Rostina, Zina Jarrah and Andy Marsden and consultants Laura Mayanda and Laxmi Zahara. In addition thanks are due to Jan Voskens, Jhon Sugiharto and other staff from TB CARE I Indonesia. We would also like to thank the following people for providing advice on TB and Multi-Drug Resistant Tuberculosis (MDR-TB) treatment: Yodi Mahendradata and Riris Andono Ahmad, both lecturers and researchers at Universitas Gadjah Mada; Bambang Sigit, lecturer and lung specialist at Sardjito Hospital; and Ratna Ekasari, TB CARE I Coordinator in Central Java. The authors’ affiliations are as follows: David Collins, Senior Principal Technical Advisor in Health Financing for Management Sciences for Health (MSH) in Cambridge, MA, USA; Firdaus Hafidz, Pusat KPMAK (Centre for Health Finance Policy and Insurance Management, School of Public Health) at Universitas Gadjah Mada in Indonesia; and Chutima Suraratdecha, Senior Principal Technical Officer for MSH in Arlington, VA, USA (at the time of this study). TB CARE I / MSH Page 6 December 2013
EXECUTIVE SUMMARY

Tuberculosis (TB) is a major cause of death and places a huge social and financial burden on the
people who have the disease, as well as on their families and communities. Most of the infections
occur in people between the ages of 15 and 54, when people are at their most productive. People
who are infected are often unable to work and the productivity of other family members who
look after them is also affected. Children also suffer by having to drop out of school to help
support their families. In addition to the loss of productivity, the cost of treating TB can also be
significant. TB treatment requires significant amounts of scarce resources from families,
government and insurance.

Indonesia has made great strides in expanding TB control over the last few years, with
significant assistance from donors, such as the Global Fund against AIDS, TB and Malaria
(GFATM). Despite the advances made, Indonesia remains one of the countries with the highest
number of TB deaths due partly to its large population of over 230 million and major challenges
remain. One of these challenges relates to Multi-Drug Resistant TB (MDR-TB), where a high
defaulter rate and the irrational use of second-line drugs by some public and private providers is
contributing to the increase of cases which is expected to reach over 5,000 by 2014. Another
challenge is that of availability of, and access to, diagnosis and treatment, especially for MDR-
TB. Out of the existing 482 districts in Indonesia, 138 are officially recognized by the
government as under-served districts, mostly in remote areas. Other challenges that exist include
access to services among the urban poor.

While there are presently substantial external funds for the TB program these are likely to
diminish greatly over the next few years, such as GFATM grants, due mainly to improvements in
the status of the Indonesian economy. The government is developing an exit strategy which aims
to eliminate dependency on these grants and which focuses on increasing government budget
allocations, generating revenue from insurance and corporate social responsibility financing and
improving the cost-effectiveness and efficiency of services.

A major challenge in increasing government budget allocations is the lack of understanding of
the economic burden caused by TB and the savings that can be achieved with a successful and
well-resourced TB program. Being able to provide estimates of the economic burden will
provide evidence that can strengthen the ability of the National TB Control Program (NTP) and
the Ministry of Health (MOH) to advocate for the funding needed.

In order to quantify the economic burden, a spreadsheet-based tool 2 was developed and an
Indonesia model was produced. The development of the tool was requested by the NTP and is
intended to be used by NTP and MOH staff at national, provincial and district levels so they can
estimate the burden at their own levels and advocate accordingly.

Using national data for 2011, the model estimated that there were 441,940 new active TB cases
of which 321,411 were treated for first-line TB. There would have been a further 4,267 new

2
    The TB Economic Burden Analysis Tool

TB CARE I / MSH                                Page 7                           December 2013
MDR-TB cases of which 286 started treatment. An estimated 286,560 people would have been treated and cured, 59,662 would have self-cured and 95,718 would eventually die. Based on these figures the total number of years of life lost is likely to be about 1.9 million and the total number of productive years of life lost would be about 1.5 million. The total economic burden will be roughly US$ 2.1 billion. Loss of productivity due to premature death will be by far the largest element, comprising 63% of the total economic burden.Loss of productivity due to disability, medical costs and patient non-medical costs are likely to be 31%, 3.6% and 0.4%, respectively. Note that this is the economic burden that will be borne over a number of years related to the number of new infections in 2011. The size of the economic burden depends highly on the wage rate used to calculate the productivity losses. The national average minimum wage rate of US$ 3.93 is a key factor – a 10% increase would result in a 9.6% increase in the total economic burden. The minimum wage is set by each province and varies considerably across the country. The total economic burden could, therefore, vary considerably from one province to another. Increasing the number of cases treated has a major impact on the economic burden. If, for example in 2011, the TB treatment rate was 92.7% instead of 72.7% and the MDR-TB treatment rate was 31.4% instead of 6.7%, the economic burden would have been only US$ 1.3 billion instead of US$ 2.1 billion. 3 An investment of an additional US$ 35 million in medical costs (US$ 0.14 per capita) to scale up the TB program would have resulted in an overall saving of US$ 800 million (US$ 3.36 per capita)and the number of TB-related deaths would have been reduced by 37% - from 95,718 to 59,876. The tool was made to be user-friendly so that it can be used by provincial and local managers. As a result the model is somewhat simplistic and there are some limitations. For example, it does not take into account the relationship between TB and HIV/AIDS or TB and diabetes and it does not include the extra costs of retreatment. It is a single year model 4 and does not, therefore, take into account future changes in lifestyles, such as smoking habits, and life expectancy. It also does not take into account the transmission of TB from the 2011 new cases to others. One difficulty experienced during the course of this study was that of comparing economic burden estimates within and across different countries, which indicates that it would be beneficial to have a standard methodology and tool. The TB Economic Burden Analysis Tool will, therefore, be made available by TB CARE I for use by country managers. 3 The figures of 92.7% and 31.4% are the NTP targets for 2016. 4 The model is based on the estimated incidence of TB in a single year although some aspects of the related burden (such as the cost of treating MDR-TB and productivity losses due to premature death) extend beyond the year. TB CARE I / MSH Page 8 December 2013
1. THE ECONOMIC BURDEN OF TB AROUND THE WORLD

Although significant progress has been made in reversing the TB epidemic, the global burden of
TB remains large – in 2011 there were an estimated 8.7 million new cases and 1.4 million deaths
associated with TB. And worryingly, the response to the growing problem of multi-drug resistant
TB (MDR-TB) has been slow, despite the estimated number of cases having increased to almost
60,000 cases worldwide in 2011 and the belief that that may only represent about 19% of the
actual number of MDR-TB cases (World Health Organization, 2012).

Particularly troubling for the prospects of global prosperity, 75% of TB cases arise during
people's most productive years, between the ages of 15 and 54 (TB Alliance, 2013). People who
are infected are often unable to work and the productivity of other family members who look
after them is also affected. Women are infected at least as much as men (Holmes, Hausler, &
Nunn, 1998; Hudelson, 1996; Murray, 1991). Children are also affected – almost 10 million
were orphaned in 2009 as a result of parental TB deaths and many have to drop out of school to
help support their families. In addition to the loss of productivity, the cost to patients and health
care providers of treating TB can also be significant. TB treatment requires significant amounts
of scarce resources from families, government and insurance schemes.

Country studies document between three and four months work time lost annually to the disease,
and lost earnings of 20 to 30% of household income. Families of persons who die from the
disease lose about 15 years of income (Kim et al., 2003). Based on a 30% decline in average
productivity due to illness from TB, the global economic loss from disability amounts to
approximately US$1 billion per year. An estimated two million deaths per year, with an average
loss of 15 year’s income, creates an additional loss of US$11 billion per year, making an annual
total loss to the world’s economy of $12 billion (Kim, Shakow, Castro, Vande, & Farmer, 2003)
(Kim et al., 2003). In some countries this loss of productivity attributable to TB can represent as
much as 4 to 7% of GDP (TB Alliance, 2013).

Businesses are also concerned about the impact of TB - one-third of over 11,000 respondents to a
2007 survey expected the disease to affect their business in the following 5 years. This reflects a
growing recognition that workers with TB can miss several months of work and are likely to
infect colleagues (World Economic Forum, 2008).

    2. TB IN INDONESIA

Indonesia is one of the countries with the highest TB disease burden in the world, due to a
combination of a large population and a high prevalence rate. The country has, however, made
great strides in expanding TB control over the last few years, with significant assistance from
donors, such as the Global Fund.

The incidence rate of TB in Indonesia has been falling slowly but has been almost completely
offset by the increase in population. The case detection rate has, on the other hand, increased
significantly from 56% in 2005 to 66% in 2010 and 70% in 2011. The treatment success rate for

TB CARE I / MSH                                Page 9                           December 2013
new smear-positive cases has remained fairly stable at 91% since 2005 with a slight fall to 90%
in 2010.
However, major challenges remain. One of these relates to Multi-Drug Resistant TB (MDR-TB),
where a high defaulter rate and the irrational use of second-line drugs by some public and private
providers are contributing to the increase of cases which is expected to reach over 5,000 in 2014.
Only a small number of cases were detected and treated in 2011 and major efforts are under way
to scale up.
Another challenge is that of availability and access, especially for MDR-TB services. Out of the
existing 482 districts in Indonesia, 138 are officially recognized by the government as under-
served districts, mostly in remote areas. MDR-TB prevalence varies significantly within
Indonesia with the lowest rate in Jakarta Province (29) and the highest in Papua (2,738) (Riono
& Farid, 2012). Other challenges around access exist, for example, among the urban poor.
While there are presently substantial external funds for the AIDS, TB and Malaria health
programs, these are likely to diminish over the next few years as Indonesia’s economy continues
to improve. The government is developing an exit strategy which aims to eliminate dependency
on these grants and which focuses on increasing government budget allocations, generating
revenue from insurance and corporate social responsibility financing, and improving cost-
effectiveness and efficiency. The TB program relies on Government allocations at the central,
provincial and district levels but budgets, particularly at the local level, have been insufficient,
partly because the importance of TB control is not always appreciated. There is a need for better
advocacy materials to persuade national, provincial and local governments of the need to
prioritze investment in TB control.
3. METHODOLOGY
To estimate the economic burden of TB in Indonesia MSH developed and used a spreadsheet-
based tool 5 called the TB Economic Burden Analysis Tool. The calculations were made for the
country as a whole but the tool can also be used at provincial and district levels by changing a
few key variables, such as the population, incidence rate and minimum wage. The tool is for a
single year but could be expanded to a multi-year version in the future.
The tool is intended to assist with advocacy – to show the economic impact of TB and to allow
for comparisons to be made with the cost of preventing and treating TB. The tool is intended to
be used by TB and CDC programme managers and the audience is expected to be primarily
health directors, Ministry of Finance and Planning officials and politicians as well as donor
agencies.
5
Microsoft Excel Version 2013 has been used.
TB CARE I / MSH Page 10 December 2013The tool estimates the economic burden of TB and MDR-TB on society over a period of years
based on the estimated number of infections of a cohort of new cases in one year. The costs are
based on medical costs, non-medical costs and productivity losses incurred by persons treated
and untreated for TB and MDR-TB. It does not take into account costs associated with
HIV/AIDS, diabetes or other diseases and issues such as smoking. It also does not take into
account future cases caused by the transmission of TB from the 2011 new TB cases and does not
attempt to separate the economic impact between males and females. 6
The tool separates the costs into four groups:
• The cost to the health services of providing prevention, detection, diagnosis and
treatment services
• Non-medical patient costs such as transport and food while getting treatment,
relocation, and nutrition supplements
• Lost productivity due to disability while ill
• Lost productivity due to premature death
The tool uses a decision tree but the algorithms have been kept fairly simple since the results are
intended for advocacy and so the tool can be easily downloaded, understood, used, and modified
by the Ministry of Health or a partner at any level. It has a menu and a short user guide.
4. TREATMENTS AND OUTCOMES
The model was run with 2011 data, since that was the most complete data available at the time.
The incidence and treatment rates used to calculate the numbers of treatments, cures, relapses etc
are derived from different scources which are shown in Annex 1. The numbers of TB and MDR-
TB cases and treatments are the same as those used in the national TB services costing model
(Jarrah et al).
The total estimated number of new TB cases, treatments and treatment outcomes are shown in
Table 1. For the population of 236,331,300 in 2011, the total estimated number of new cases was
441,940 and the total number of new cases notified was 321,411. Of this total, an estimated
313,184 would have been new TB cases and 3,960 would have been retreated relapse cases. It
was assumed that 90.3% of new TB cases and 90.3% of relapsed TB cases were successfully
treated and the remainder of the patients (30,763) died.
6
There were 50% more men than women among notified cases in 2011 (World Health Organization, 2012).
TB CARE I / MSH Page 11 December 2013Table 1. Numbers of new infections, cases treated and treatment outcomes for TB in 2011
Rate/% Number
Incidence of active TB per 100,000 population 187 441,940
Total TB new cases notified & treated (%) 72.7% 321,411
New smear-positive cases 61.0% 196,155
New smear-positive cases identified and treated as TB 98.1% 192,428
New smear-positive cases identified as MDR-TB 1.9% 3,727
New smear-negative cases treated 33.1% 106,293
New extra pulmonary cases treated 3.8% 12,214
Relapse cases 1.4% 4,500
Relapse TB cases retreated 88.0% 3,960
Relapse TB cases become MDR-TB 12.0% 540
Other cases treated 0.7% 2,250
Total new TB cases treated as TB 313,184
Total relapse cases retreated 3,960
Total expected MDR-TB cases 4,267
New TB cases successfully treated 90.3% 282,806
Relapse TB cases successfully retreated 90.3% 3,576
New TB cases assumed died 9.7% 30,379
Relapse TB cases assumed died 9.7% 384
Total TB cases assumed died 30,763
The number of untreated new cases would have been 120,528 (Table 2), calculated by deducting
the number of cases notified (321,411) from the total number of new cases (441,940) shown in
Table 1. 7 Of these a total of 60,867 cases would have been expected to die and the remainder
(59,662) would have been expected to self-cure. 8
Table 2. Numbers of untreated cases and related outcomes for TB for 2011
% Number
Total TB cases untreated (%) 27.3% 120,528
1. Smear-positive 61.0% 73,522
1.1 Died 70.0% 51,466
1.2 Self-cured 30.0% 22,057
2. Smear-negative and others 39.0% 47,006
2.1 Died 20.0% 9,401
2.2 Self-cured 80.0% 37,605
Total died --- 60,867
Total self-cured --- 59,662
7
Small differences are due to rounding.
8
The estimated death rates are from Tiemersma et al. The persons who do not die are considered to self-cure.
TB CARE I / MSH Page 12 December 2013The model estimated that there would have been 4,267 new MDR-TB cases, comprising 1.9% of new cases (3,727) and 12% of retreated relapse cases (540) (Table 3). We assumed that the actual 286 MDR-TB cases treated were equally proportioned between the new and retreated cases with an average treatment rate of 6.7%. We assumed that the untreated and unsuccessfully treated cases all died. Table 3. Numbers of cases, treatments and outcomes for MDR-TB, 2011 MDR TB cases New smear-positive cases identified as MDR-TB 1.9% 3,727 MDR-TB cases among relapse cases 12.0% 540 Total MDR cases 4,267 MDR-TB cases treated 6.7% 286 MDR-TB cases untreated 93.3% 3,981 MDR-TB cases successfully treated 62.4% 178 MDR-TB cases unsuccessfully treated assumed died 37.6% 107 MDR-TB cases untreated assumed died 100.0% 3,981 TB CARE I / MSH Page 13 December 2013
The numbers of treatments and outcomes are also shown in a decision tree below (Figure 1).

            Figure 1. Decision tree of TB and MDR-TB outcomes (numbers of cases)

                                                                                                      Cured
                                  = cured                                                                        156
                                  = died                                         Treated
                                                                                           250        Died
                                                                  MDR-TB                                          94
                                                                       3,727     Untreated (died)
                                               Smear positive                           3,477         Cured
             Notified (treated)                   196,155         TB                                          173,763
                       321,411                                         192,428
                                                                                                      Died
                                                                                                               18,666

        Active TB                                                                                     Cured
        441,940                                                                                                   23
                                                                                 Treated
                                                                                            36        Died
                                                                  MDR-TB                                          14
                                                                           540   Untreated (died)
                                               Relapse                                   504          Cured
                                                     4,500        TB                                            3,576
                                                                         3,960
                                                                                                      Died
                                                                                                                 384

                                                                                                      Cured
                                             Smear negative                                                    95,982
                                                  106,293
                                                                                                      Died
                                                                                                               10,310

                                                                                                      Cured
                                            Extra pulmonary                                                    11,029
                                                     12,214
                                                                                                      Died
                                                                                                                1,185

                                                                                                      Cured
                                                      Other                                                     2,032
                                                     2,250
                                                                                                      Died
                                                                                                                 218

                                                                                                      Self Cured
                                              Smear postive                                                    22,057
        Unnotified (Untreated)                     73,522
                      120,528                                                                         Died
                                                                                                               51,466

                                                                                                      Self Cured
                                             Smear negative                                                    37,605
                                                    47,006
                                                                                                      Died
                                                                                                                9,401

TB CARE I / MSH                                                 Page 14                             December 2013
A summary of the treatment rates and outcomes is shown in Table 4. Of the total of 441,940 new
cases in 2011, we assumed 286,560 cases were successfully treated, 59,662 would have been
untreated persons who would have self-cured and 95,718 of treated and untreated patients would
die at some stage. 9 It should be reemphasized that these outcomes happen over a period of years
based on the persons infected in 2011.
Table 4. Summary of treatment rates and outcomes (2011)
Percentages/numbers
TB cases treated % 72.7%
MDR-TB cases treated % 6.7%
Total number of cases treated and cured 286,560
Total number of cases self-cured 59,662
Total number of cases died 95,718
Total cases 441,940
The majority of the deaths (64%) would have resulted from untreated TB cases with 32%
resulting from unsuccessful TB treatments (Table 5). The proportion of deaths from untreated
and treated MDR-TB is small because the number of MDR-TB cases was much lower than the
number of TB cases.
Table 5. Breakdown of deaths (2011)
Number of deaths
Death of Treated TB 30,763 32%
Death of Treated MDR-TB 107 0%
Death of Untreated TB 60,867 64%
Death of Untreated MDR-TB 3,981 4%
Total deaths 95,718 100%
9
This is higher than estimated number of deaths in 2011 per the WHO Global TB Report for 2012 which was
65,000 but the stated range was 29,000 to 120,000, indicating a high level of uncertainty. Also the WHO figure
excludes HIV+TB deaths, which are included in our figure. Finally, the WHO figure is an estimate of the number of
deaths in 2011 whereas the figure in this report is an estimate of the deaths in and beyond 2011 resulting from new
TB and MDR-TB cases in 2011.
TB CARE I / MSH Page 15 December 20135. COSTS Costs are broken out into the four groups: medical services, non-medical patient costs, productivity losses due to disability and productivity losses due to premature death. Medical services costs The total cost of medical services is estimated at US$ 76.8 million (Table 6). This is calculated by multiplying the numbers of TB and MDR-TB cases treated by the unit cost for each service based on a national TB services costing study (Jarrah, et. al). 10 We did not have an estimate of costs for retreated cases and so assumed they are the same as the costs of regular TB treatment. This means that the total costs are slightly underestimated. The cost of medical services covers prevention, detection, diagnosis and treatment services and includes staffing and indirect facility costs. Table 6. Medical service costs (US$) Direct medical costs Numbers and US$ Number of TB cases treated 313,184 Number of treated relapsed cases 3,960 Number of MDR-TB cases treated 286 Average cost per TB case treated $ 233 Average cost per MDR-TB case treated $ 10,289 Cost of treated TB cases $ 73,894,601 Cost of treated MDR-TB cases $ 2,941,458 Total direct medical cost = $ 76,836,059 Patient costs Patients incur considerable out-of-pocket costs when seeking diagnosis and treatment, especially in the case of MDR-TB treatment which lasts for at least 24 months in Indonesia. These costs include food, travel and accomodation while seeking diagnosis and undergoing treatment. They sometimes also include the costs of relocation and nutrition supplements. The model estimated that total costs would have been approximately US$ 7.9 million (Table 7). The largest element is US$4.4 million for TB cases since there are many more TB cases than MDR-TB cases even though the unit cost of an MDR-TB case is much higher. We did not have a separate unit cost for a retreatment case and so we assumed it was the same as for a regular TB case. It was also assumed that untreated persons would incur the same cost as persons receiving approved treatments as they would be likely to seek care from unapproved providers. 10 Note that the total costs here are slightly different due to the rounding of the unit costs in the Economic Burden model. TB CARE I / MSH Page 16 December 2013
Table 7. Patient costs (US$) 11
Patient costs                                                                       Numbers and US$
Number of treated TB cases                                                                  313,184
Number of treated relapsed cases                                                              3,960
Number of treated MDR-TB cases                                                                  286
Number of untreated TB cases                                                                120,528
Number of untreated MDR-TB cases                                                              3,981
Unit cost per TB case                                                           $             14.08
Unit cost per retreated TB case                                                 $             14.08
Unit cost per MDR-TB case                                                       $            413.56
Unit cost for an untreated TB case                                              $             14.08
Unit cost for an untreated MDR-TB case                                          $            413.56
Total cost for TB cases and relapsed cases                                      $          4,463,939
Total cost for MDR-TB cases                                                     $           118,230
Total cost for untreated TB cases                                               $          1,696,488
Total cost for untreated MDR-TB cases                                           $          1,646,399
Total direct household cost                                                     $          7,925,056

Productivity losses due to temporary disability

TB and MDR-TB generally result in significant productivity losses due to the inability of an
infected person to be economically productive, including the time spent seeking and receiving
diagnosis and treatment. The total cost for temporary disability related to the new cases in 2011
is estimated at around US$ 481.5 million (Table 8) with the biggest element being US$ 369
million for untreated TB patients. In the calculations we assumed that treated TB and MDR-TB
patients are unable to work for 81 days and 180 days, respectively, after starting treatment due to
illness and time spent obtaining care, and untreated patients would be unable to work until they
die or self-cure, which is assumed to be 3 years, on average, after infection. The cost is based on
an average minimum wage for the country of US$ 3.93 per day. It should be noted that the
minimum wage is set by each province and there is significant variation across the provinces. In
this model we have not taken into account productivity losses related to caregivers.

11
  The unit costs are the results of an MDR-TB patient cost study carried out in Indonesia by TB CARE I based on a
research carried out in 2013. For simplicity we assumed that these costs had not changed a great deal since 2011.

TB CARE I / MSH                                     Page 17                               December 2013
Table 8. Productivity losses due to temporary disability (US$)

Loss of productivity due to temporary disability
Number of treated TB cases                                                                313,184
Number of treated relapsed cases                                                            3,960
Number of treated MDR-TB cases                                                                286
Number of untreated TB cases                                                              120,528
Number of untreated MDR-TB cases                                                            3,981
Number of days a treated TB patient cannot work                                                81
Number of days a treated MDR-TB patient cannot work                                           180
Number of days an untreated TB patient cannot work                                            780
Number of days an untreated MDR-TB patient cannot work                                        780
Average minimum wage rate per day                                             $              3.93
Indirect cost due to disability - TB cases treated                            $         99,695,998
Indirect cost due to disability - MDR-TB treated                              $           202,234
Indirect cost due to disability - TB cases untreated                          $        369,467,759
Indirect cost due to disability - MDR-TB cases untreated                      $         12,203,474
Total indirect cost due to disability                                         $        481,569,465

Productivity losses due to premature death

The largest component of the economic burden relates to loss of productivity due to premature
death, which is estimated at around US$ 1.5 billion (Table 9). To calculate this we used the age
breakdown of notified smear-positive cases per the NTP calculate the average number of patients
of each age and we assumed that a person who was infected in one year and who was not cured
would die 3 years later (Tiemersma, et. al). We assumed that people stop being productive when
they reach 60 years old. 12 The total number of productive life years lost from the age of 0 to 60
came to 1.9 million years and the total number of productive life years lost from the age of 18 to
60 came to 1.5 million years. We used an average number of 260 working days per year and the
national average minimum daily wage of US$ 3.93 13, which came to US$ 1,022 per year. The
group with the largest loss of productivity is untreated TB cases with an estimated total of US$
996 million.

12
   This is the retirement age for a civil servant in Indonesia but this may be an underestimate for the general
population who often remain productive longer.
13
   This may be an underestimation since a significant proportion of TB patients are not poor. Also the minimum
wage varies across the provinces and may be higher in some.

TB CARE I / MSH                                            Page 18                      December 2013
Table 9. Productivity losses due to premature death (US$)

Loss of productivity due to premature death
Death of Treated TB                                                               30,763
Death of Treated MDR-TB                                                              107
Death of Untreated TB                                                             60,867
Death of Untreated MDR-TB                                                          3,981
Total deaths                                                                      95,718
Deaths of adults of productive age (15-60 years old)                              75,431
Number of productive days per year                                                   260
Number of productive years lost                                                1,534,301
Average minimum wage rate per day                                     $              3.93
Average minimum wage per year                                         $            1,022
Productivity loss from premature death-TB cases treated               $      503,855,719
Productivity loss from premature death-MDR-TB cases treated           $        1,760,577
Productivity loss from premature death-TB cases untreated             $      996,915,720
Productivity loss from premature death-MDR-TB cases untreated         $       65,203,965
Total cost of productivity losses due to premature death              $     1,567,735,980

Summary of costs

The total economic burden from the four components comes to around US$ 2.1 billion (Table 9).
The biggest components by far are the productivity losses of US$ 1.5 billion due to premature
death (73%) and those due to temporary disability of US$ 481 million (22%). It is important to
emphasize again that these are the costs borne over a period of years relating to persons infected
with TB in 2011. The medical, household and disability costs would have been borne in the same
year that the people were infected in the case of TB, and over 2 to 3 years for MDR-TB. The
productivity losses due to premature death would be borne over the productive years lost, which
would be a maximum of 42 years. The total economic burden comes to US$ 9.03 per capita
(total population).

The total economic burden is very sensitive to changes in the figure for the minimum wage. A
10% increase in that figure will result in a 9.6% increase in the total economic burden.

We prepared an additional estimate of a discounted total cost to take into account the economic
theory that the value of production in the distant future is less than the value of the same
production in the near future. To do this we applied a discount rate of 3% per year to the years of
productive life lost. Using this method would reduce the cost of premature death from US$ 1,567
million to US$ 708 million, and would reduce the total economic burden from US$ 2.1 billion to
US$ 1.2 billion.

TB CARE I / MSH                                             Page 19            December 2013
Table 10: Summary of cost components (US$)

Component                                                                        Percentage                      Cost
Medical costs                                                                           3.6%              76,836,059
Household costs                                                                         0.4%                7,925,056
Loss of productivity due to disability                                                 22.6%             481,569,465
Loss of productivity due to premature death                                            73.5%           1,567,735,980
TOTAL                                                                                  100%            2,134,066,559

Productivity losses due to premature death are the highest cost element for each case type except
for treated MDR-TB where the medical services cost of US$ 2.9 million are higher than US$ 1.7
million (Table 10). This is because the treatment costs of an MDR-TB case are very high. The
largest single cost element is US$ 996 million for productivity losses from premature death for
untreated TB patients. The distribution of costs for TB and MDR-TB (treated and untreated in
both cases) are different, mainly due to higher treatment costs for MDR-TB offset by lower
treatment rates.

Table 11. Total cost by type of treated and untreated TB and by component (US$)

TOTAL COST                               Total                 Treated TB         Treated         Untreated TB          Untreated MDR-
                                                                                  MDR-TB                                TB
Medical services cost                    $        76,836,059   $    73,894,601     $ 2,941,458    $               -      $            -
Household cost                           $         7,925,056   $     4,463,939     $    118,230   $       1,696,488     $     1,646,399
Productivity loss from disability        $       481,569,465   $    99,695,998     $    202,234   $     369,467,759     $    12,203,474
Productivity loss from premature death   $ 1,567,735,980       $ 503,855,719       $ 1,760,577    $     996,915,720     $    65,203,965
Total cost                               $ 2,134,066,559       $ 681,910,256       $ 5,022,499    $   1,368,079,967     $    79,053,837

Combining the costs for treated and untreated cases for TB and for MDR-TB emphasizes that the
major burden is due to productivity losses (Figures 2 and 3). The breakdown of costs is similar
for TB and MDR-TB although it can be seen that non-medical patient costs are higher for MDR-
TB.

TB CARE I / MSH                                                 Page 20                                     December 2013
Figure 2: Distribution of economic burden by type of cost –TB only
Figure 3: Distribution of economic burden by type of cost – MDR-TB only
The distribution of costs by case type is shown in Table 11 and Figure 4. Most of the burden
relates to untreated TB followed by treated TB because the numbers of cases were much higher.
The cost per case is highest for untreated MDR-TB at US$ 19,858 per case (Table 11) with
treated MDR-TB close behind at US$ 17,568.
TB CARE I / MSH Page 21 December 2013Table 12. Summary of cost by case (US$)
SUMMARY OF COSTS Total cost Number of cases Cost per case
Treated TB $ 681,910,256 317,144 $ 2,150
Treated MDR-TB $ 5,022,499 286 $ 17,568
Untreated TB $ 1,368,079,967 120,528 $ 11,351
Untreated MDR-TB $ 79,053,837 3,981 $ 19,858
TOTAL $ 2,134,066,559 441,940
Figure 4: Distribution of economic burden by cases treated and untreated
The cost of treated MDR-TB is not much less than the cost of untreated MDR-TB because the
productivity losses due to premature death are offset by the absence of treatment cost (Table
12). 14
Table 13. Cost per case by type of treated and untreated TB and by component (US$)
AVERAGE COST PER PATIENT Treated TB Treated MDR-TB Untreated TB Untreated MDR-TB
Medical services cost $ 233 $ 10,289 $ - $ -
Household cost $ 14 $ 414 $ 14 $ 414
Productivity loss from disability $ 314 $ 707 $ 3,065 $ 3,065
Productivity loss from premature death $ 1,589 $ 6,158 $ 8,271 $ 16,379
Total average cost per patient $ 2,150 $ 17,568 $ 11,351 $ 19,858
14
The assumption that there is no medical services cost for untreated TB and MDR-TB is only valid from the public
health sector perspective. It is likely that most untreated patients actually get some form of diagnosis and treatment
from private providers (traditional and other).
TB CARE I / MSH Page 22 December 20136. SCENARIOS
The impact on the economic burden of increasing detection and treatment rates can be seen in
Tables 13 and 14. If the program could have achieved higher treatment targets of 92.7% for TB
and 31.4% for MDR-TB in 2011 15 without changing any other assumptions, the total number of
cases treated would have been 366,094 instead of 286,560 and the total number of persons who
self-cure and who die would have reduced accordingly (Table 13). The result would be a total
economic burden of US$ 1.3 billion, instead of US$ 2.1 billion (Table 14). An investment of an
additional US$ 35 million in medical costs (US$ 0.14 per capita) would result in an overall
saving of roughly US$ 800 million (US$ 3.36 per capita). This shows clearly value of investing
in scaling up TB services.
Table 14. Impact of increases in number of treatments on outcomes
2011
Scenario Total Total
Actual Scenario 1
CASES
TB cases treated % 72.7% 92.7%
MDR-TB cases treated % 6.7% 31.4%
Total number of cases treated and cured 286,560 366,094
Total number of cases self-cured 59,662 15,969
Total number of deaths 95,718 59,876
Total cases 441,940 441,940
Table 15. Impact of increasing number of treatments on economic burden (US$)
2011 2011
Scenario Total Per capita Total Per capita
Actual Actual Scenario 1 Scenario 1
TOTAL COSTS
Medical costs $ 76,836,059 $ 0.33 $ 111,758,850 $ 0.47
Household costs $ 7,925,056 $ 0.03 $ 8,393,170 $ 0.04
Loss of productivity due to disability $ 481,569,465 $ 2.04 $ 238,614,402 $ 1.01
Loss of productivity due to premature $ 1,567,735,980 $ 6.63 $ 980,693,327 $ 4.15
death
TOTAL $ 2,134,066,559 $ 9.03 $ 1,339,459,749 $ 5.67
15
The NTPs targets for 2016.
TB CARE I / MSH Page 23 December 20137. COMPARISONS
Several studies have been conducted of the economic burden of TB. Some comparisons can be
made although this is hampered by the use of different methodologies.
The tool used for this study was requested by the NTP to provide an update of costing estimates
provided by Ascobat Gani in 2005 (Gani, 2005). He estimated that the patients paid a total of
IDR 253 billion (US$ 26.6 million) for medication, and lost IDR 324 billion (US$34 million)
due to disability and IDR 5.7 trillion (US$ 605 million) due to premature death. The total came
to IDR 6.3 trillion (US$ 665 million). The current estimate for economic burden of US$ 2.1
billion is considerably higher than Gani’s figure of US$ 605 million, which is understandable
since, although the 2011 estimate of 78,377 deaths is less than the 2004 estimate of 140,000, the
2011 cost is based on a higher estimate of years lost to premature death, the minimum wage in
2011 was US$ 3.93 compared with US$ 1.58 used by Gani, and the 2004 estimate does not
include additional costs related to MDR-TB. Also this 2011 study included estimates for all
direct provider and patient costs.
Some studies have ignored the morbidity effects of TB because premature death, rather than
morbidity, was deemed responsible for more than 80% of the disability-adjusted life years lost to
TB (Dye, 2006). Therefore, morbidity-related productivity losses are likely to be small relative
to the economic burden of deaths caused by TB. In this study, however, we assumed for
simplicity that all the cases would otherwise be productive and earning the equivalent of the
minimum wage in cash or in kind. On that basis 22% of the total economic burden costs was
related to morbidity, and when the losses due to premature death are discounted that percentage
is even greater.
A study on the economic benefit of TB control (Laxminaryan et al, 2007) estimated that the
baseline economic burden of TB in Indonesia with pre-DOTS 16 treatment levels and no DOTS
would be US$ 329 billion US$ over a 10 year period from 2006-2015 for productivity losses due
to premature death. The figure assumed a total of 1,894,000 deaths over the ten years, with
119,376 in 2004. HIV co-infections were included and a 3% discount rate was used to arrive at
Net Present Value. The study ignored the morbidity effects of TB because premature death,
rather than morbidity, was believed to be responsible for more than 80 percent of the disability-
adjusted life years lost to TB (Dye, 2006) 17. Without details of the method of calculating the
figure of US$ 329 billion for 10 years it is hard to compare it with the estimated loss US$ 1.3
billion due to premature death in this study. The Laxminaryan figure appears to be higher despite
having been discounted and one factor may be that it is based on a higher estimated number of
deaths.
16
Directly Observed Therapy, Short-course
17
One argument for excluding the cost of morbidity is that a significant proportion of the TB-afflicted population may be
unemployed prior to developing the disease and labor supply may be fairly elastic. This would seem to assume that people cannot
be productive without being formally employed.
TB CARE I / MSH Page 24 December 20138. CONCLUSIONS
Using the new model with data for 2011, we estimated that there were 441,940 new active TB
cases of which 321,411 were treated for first-line TB, and 4,267 new MDR-TB cases of which
286 started treatment. An estimated 286,560 people would have been treated and cured, 59,662
would have self-cured and 95,718 would eventually die.
Based on these figures the total number of years of life lost related to the 2011 new cases are
likely to be 1.9 million and the total number of productive years of life lost to be 1.5 million. The
total economic burden will be roughly US$ 2.1 billion. Loss of productivity due to premature
death will be by far the largest element, comprising 73% of the total cost. Loss of productivity
due to disability, medical costs and household costs are likely to be 22%, 3.6% and 0.4%
respectively of the total economic burden. Note that this is the economic burden that will be
borne over a number of years related to the number of new infections in 2011.
An alternate way of calculating the cost is to apply a discount rate on the grounds that the value
of production in the distant future is less that the value of the same production in the near future.
To do this we applied a discount rate of 3% per year to the productive years lost and this would
reduce the cost of premature death from USD 1,567 million to USD 708 million, and would
reduce the total economic burden from USD 2.1 billion to USD 1.2 billion.
The size of the economic burden depends highly on the wage rate used for to calculate the
productivity losses. The national average minimum wage rate of US$ 3.93 is a key factor – a
10% increase in that figure would result in a 9.6% increase in the total economic burden. The
minimum wage is set by each province and varies considerably across the country. The total
economic burden could, therefore, vary considerably from one province to another.
Increasing the number of cases treated has a major impact on the economic burden. If, for
example in 2011, the TB treatment rate was 92.7% instead of 72.7% and the MDR-TB treatment
rate was 31.4% instead of 6.7%, the economic burden would have been only US$ 1.3 billion
instead of US$ 2.1 billion. An investment of an additional US$ 35 million in medical costs (US$
0.14 per capita) would have resulted in an overall saving of US$ 800 million (US$ 3.36 per
capita. And the number of TB-related deaths would have been reduced by 37% - from 95,718 to
59,876. This shows clearly value of investing in scaling up TB services.
9. LIMITATIONS
The tool was made to be user-friendly so that it can be used by provincial and local managers. As
a result the approach used is somewhat simplistic. There are, therefore, some limitations. The
major ones are as follows.
TB CARE I / MSH Page 25 December 2013The tool estimates the economic costs of TB and MDR-TB. It does not take into account the
relationship between TB and HIV/AIDS or TB and diabetes. It is a single year model 18 and does
not, therefore, take into account future changes in lifestyles, such as smoking habits, and life
expectancy.
It also does not take into account the transmission of TB from the 2011 new cases to other
people. These are active cases that are untreated, unsuccessfully treated, or treated but still
infectious, some of whom would infect others. If the tool is changed from a single year to a
multi-year model then these transmitted cases will be included in the new cases in each
following year. In this single year model the cost of these transmitted cases is not included. We
are also not including the extra costs of retreatment.
There are also some limitations with the data. Some of the major ones are uncertainty over
incidence rates for both TB and MDR-TB and on how long people live after becoming infected
after they are treated.
10. RECOMMENDATIONS
To maximize the effective use of the economic burden information for advocacy it is
recommended that the model be used to estimate the costs at the level of each province and, if
possible, each district. The model has been kept simple so that it can be used at those levels –
with just a few essential changes, such as the population and treatment rates. It is recommended
that the national minimum wage rate be used in places where a very low or no provincial
minimum wage has been set.
Some additional research would be valuable to improve the quality of some of the variables used
in the model.
To roll out the tool cost-effectively we recommend that donor support be provided to train a team
from universities who can translate the tool and then provide training to managers at the
provincial and local levels.
One difficulty experienced during the course of this study was that of comparing economic
burden estimates across different countries. This indicates that it would be beneficial to have a
standard methodology and tool. The tool developed for this study19 will, therefore, be made
available by MSH and through TB CARE I for use by country managers.
18
The model is based on the estimated incidence of TB in a single year although some aspects of the related burden
(such as the cost of treating MDR-TB and productivity losses due to premature death) extend beyond the year.
19
The TB Economic Burden Analysis Tool
TB CARE I / MSH Page 26 December 2013ANNEXES TB CARE I / MSH Page 27 December 2013
Annex 1. Demographic and disease data sources

No.                 Variable                                            Sources
1.    Total population                       http://www.datastatistik-
                                             indonesia.com/proyeksi/index.php?option=com_proyeksi&task=sh
                                             ow&Itemid=941

2.    Age Specific: 15-64 age group          http://www.datastatistik-
                                             indonesia.com/proyeksi/index.php?option=com_proyeksi&task=sh
                                             ow&Itemid=941
3.    TB new cases treated (%)               NTP Target
4.    Treatment completed (%)                World Health Organization (WHO) TB Report 2012
5.    Treatment completed: Cure (%)          TB Control update presentation (2011 data)
6.    Relapse, Drug sensitive death (%)      WHO TB Report 2012

7.    Relapse, MDR (%)                       MDR and XDR WHO report 2010
8.    Relapse, MDR death (%)                 Stop TB Working Group on DOTS-Plus for MDR-TB
9.    TB cases treated, Default (%)          WHO TB Report 2012 (default 4% + failed 1%+% of Unknown)
10.   TB cases treated, Default, Cure (%)    Cost-effectiveness of novel vaccines for tuberculosis control: a
                                             decision analysis study
11.   TB cases treated, Default, Death (%)   Treatment outcome and two & half years follow-up status of
                                             smear-positive patients treated under RNTCP
12.   TB cases treated, Default, Relapse,    WHO TB Report 2012
      Drug-sensitive death (%)
13.   TB cases treated, Default, Relapse,    MDR and XDR WHO report 2010
      MDR (%)
14.   TB cases treated, Default, Relapse,    Stop TB Working Group on DOTS-Plus for MDR-TB
      MDR death (%)
15.   TB cases untreated: Death (%)          Natural history of tuberculosis
16.   TB cases untreated: MDR (%)            WHO TB Report 2012
17.   MDR death (%)                          Stop TB Working Group on DOTS-Plus for MDR-TB
18.   Drug-sensitive death (%)               WHO TB Report 2012
Annex 2. Cost data sources
No. Variable Sources
1. TB cases admitted (%) Direct and indirect costs of tuberculosis among immigrant patients
2. Average cost of medical treatment Jarrah, Z., Collins, D. and Hafidz, F. July, 2013. The Cost of Scaling
for full course of outpatient Up TB Services in Indonesia. TB CARE I – Management Sciences for
treatment after admission Health.
3. Average cost of medical treatment Stop TB Working Group on DOTS-Plus for MDR-TB
for MDR-TB case
4. Average cost of medical treatment The Incremental Cost-Effectiveness of Engaging Private
for drug-sensitive case Practitioners to Refer
Tuberculosis Suspects to DOTS Services in Jogjakarta, Indonesia (in
health centre) + TB II drugs
5. Average cost of transport per TB Costing study in Health facilities - transport to Puskesmas-
case
6. Average cost of transport per MDR- Costing study in Health facilities - transport to Hospital-
TB case
7. Average cost of transport per drug- Costing study in Health facilities - transport to Puskesmas-
sensitive case
8. Average cost of caregiving per TB The Incremental Cost-Effectiveness of Engaging Private
case Practitioners to Refer
Tuberculosis Suspects to DOTS Services in Jogjakarta, Indonesia (in
health centre)
9. Average cost of caregiving per Assumption :proportional to the cost of transport
MDR-TB case
10. Average cost of caregiving per drug- Assumption :proportional to the cost of transport
sensitive case
11. Deaths of adults of productive age Using 365 assumes average wage is for 7 days per week
12. Average age at death from TB Expert Judgment
13. Average retirement age civil servant retirement age
14. Average number of days a TB Expert Judgment
patient (untreated) is unable to
resume his/her activities
15. Average number of days a TB Direct and indirect costs of tuberculosis among immigrant patients
patient (under treatment) is unable in the Netherlands
to resume his/her activities
16. Average number of days a MDR-TB proportionate to TB cases
patient (untreated) is unable to
resume his/her activities
17. Average number of days a MDR-TB Expert Judgment
patient (under treatment) is unable
to resume his/her activities
18. Average number of days a drug- Direct and indirect costs of tuberculosis among immigrant patients
sensitive patient (under treatment) in the Netherlands
is unable to resume his/her
activities
19. Average wage rate per day Direktorat Jendral Pembinaan Hubungan Industrial dan Jaminan
Sosial Tenaga Kerja
(http://www.wageindicator.org/main/minimum-wages/indonesia)
TB CARE I / MSH Page 29 December 2013Annex 3. References
Ahlburg, D. A. (2000). The Economic Impacts of Tuberculosis. In The STOP TB Initiative 2000
Series. Amsterdam: Word Health Organization.
Boucekkine, R., de la Croix, D., and Licandro,O. Early Mortality Declines at the Dawn of
Modern Growth. Scand. J. of Economics 105(3), 401-418, 2003.
Dye, C. (2006). Global epidemiology of TB. Lancet, 367, 938–40.
Gani, A. TB Program and Poverty Alleviation: Parliamentary Forum Meeting, Jakarta, August
26th, 2005. Power Point. FKMUI.
Holmes, C., Hausler, A., & Nunn, P. (1998). A review of sex differences in the epidemiology of
tuberculosis. International Journal of Tuberculosis and Lung Disease, 2, 96–104.
Hudelson, P. (1996). Gender differentials in tuberculosis: The role of socioeconomic and cultural
factors. Tubercle and Lung Disease, 77, 391–400.
Jarrah, Z., Collins, D. and Hafidz, F. July, 2013. The Cost of Scaling Up TB Services in Indonesia.
TB CARE I – Management Sciences for Health.
Kim, J. Y., Shakow, A., Castro, A., Vande, C., & Farmer, P. (2003). Tuberculosis Control. In
Richard Smith, R. Beaglehole, D. Woodward, & N. Drager (Eds.), Global Public Goods for
Health (GPGH). Oxford: Oxford University Press. Retrieved from
http://www.who.int/trade/distance_learning/gpgh/gpgh3/en/index7.html
Laxminarayan, R., Klein, E., Dye, C., Floyd, K., Darley, S., & Adeyi, O. (2007). Economic
Benefit of Tuberculosis Control. Washington.
Murray, C. (1991). Social, economic and operational research on tuberculosis: recent studies and
some priority questions. Bulletin of the International Union on Tuberculosis and Lung
Disease, 66, 149–156. Retrieved from http://www.ncbi.nlm.nih.gov/pubmed/1687507
Murray CJL and Lopez A. The Global Burden of Disease. Cambridge, MA: Harvard School of
Public Health,1996.
Riono, P., & Farid, M. N. (2012). Estimasi Jumlah Orang dengan TB di Indonesia , 2009-2010.
Jakarta.
Sawert, H. (1997). The economic cost of tuberculosis in Indonesia: With an assessment of costs
and benefits of an improved control strategy. Geneva.
Sawert, H., Kongsin, S., Payanandana, V., Akarasewi, P., Nunn, P. P., & Raviglione, M. C.
(1997). Costs and benefits of improving tuberculosis control: the case of Thailand. Social
TB CARE I / MSH Page 30 December 2013You can also read


