2019 Schedule of Contributions - Report on the consultation process with companies and organizations - Éco Entreprises Québec
←
→
Page content transcription
If your browser does not render page correctly, please read the page content below
2019 Schedule of Contributions: Consultation report

2019 Schedule of
Contributions

Report on the consultation
process with companies and
organizations
                                                            1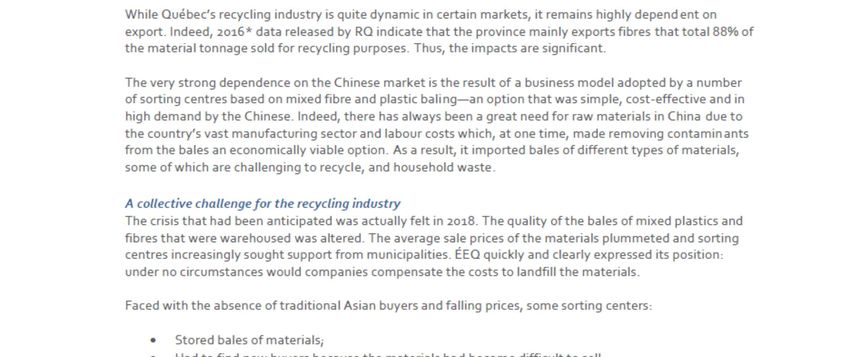
2019 Schedule of Contributions: Consultation report

2019 Schedule of Contributions ................................................. 1

Report on the special consultation with companies and
organizations .............................................................................. 1

Rapport sur la consultation particulière des entreprises et des
organisations .............................................................................. 1

1.       Context .............................................................................. 4

Québec’s curbside recycling system at risk with the closure of the Chinese markets 4

2. Mechanism to develop the 2019 Schedule of Contributions in
a global recycling crisis ............................................................... 5
2.1 Working group on the materials generated by B2B .................................................. 5
2.2 Study updates .............................................................................................. 5
2.3 Broadening of the rates to CP&PM products in review ............................................. 6

3.       Development of the draft 2019 Schedule of Contributions6
3.1 Changes to the application rules ....................................................................... 6
3.2 Changes to the contribution table...................................................................... 7
3.3 2018 system costs ......................................................................................... 7
3.3.1       Municipal net costs and performance and efficiency (P&E) factor .................... 7
3.3.2       Deduction for non-designated materials ..................................................... 8
3.3.3       Municipal costs eligible for compensation ................................................... 9
3.3.4       Cost allocation per material class ............................................................. 9
3.4 Other costs considered ................................................................................... 9
3.5 Cost overview ............................................................................................ 10
3.6 Expected quantities of materials ..................................................................... 10
3.7 Impact on materials rates.............................................................................. 12
3.7.1       Average rate per class ......................................................................... 12
3.7.2       Contribution table for the 2019 Schedule of Contributions ........................... 13
3.7.3       Flat fees ........................................................................................... 14
3.7.4       Analysis of impacts on contributing companies .......................................... 14
3.8 Validation of the 2019 Schedule of Contributions ................................................. 15

                                                                                                                       2
2019 Schedule of Contributions: Consultation report

4.        Consultation with companies and organizations ........... 15
4.1 Dissemination of the consultations ................................................................... 15
4.2 Participation in the consultation meetings ......................................................... 15
4.3 Questions and comments on the Schedule of Contributions ..................................... 16
4.3.1       Questions raised by targeted companies at the consultation meetings ............ 16
4.3.2       Questionnaire sur le Tarif 2019 ............................................................. 17
4.3.3       Correspondence and comments ............................................................. 17
4.3.3.1     In connection with the 2019 Schedule of Contributions ............................... 18
4.3.3.2     Additional comments on future directions ................................................ 18

5.        Changes to the 2019 Schedule of Contributions ............. 19
5.1 Updated inputs ........................................................................................... 19
5.1.1       Updated municipal net costs ................................................................. 19
5.1.2       Other costs ...................................................................................... 19
5.1.3       Total costs to consider in the funding formula ........................................... 20
5.2 New table of contributions ............................................................................ 20

6. Position of the board of directors on the 2019 Schedule of
Contributions ........................................................................... 20

In the context of the recycling crisis .................................................................. 21
In the context of the integration of CP&PM products into the 2018 Schedule of
Contributions and eventual broadening of the rates to B2B ................................. 21
Funding of the Innovative Glass Works plan ....................................................... 21
Fee structure for small businesses .................................................................... 22
6.1 New table of contributions ............................................................................ 22
Annex 1 — 2015–2017 residential characterization .............................................. 24
Annex 2 — 2016 activity-based costing .............................................................. 26
Annex 3 — Letter of validation: contribution table.............................................. 28
Annex 4 — Executive summary: draft 2019 Schedule of Contributions .................. 31
Annex 5 — Questionnaire on the 2019 Schedule of Contributions ......................... 46
Annex 6 — Correspondence received as part of the special consultation on the 2019
Schedule of Contributions ............................................................................... 50

                                                                                                                    3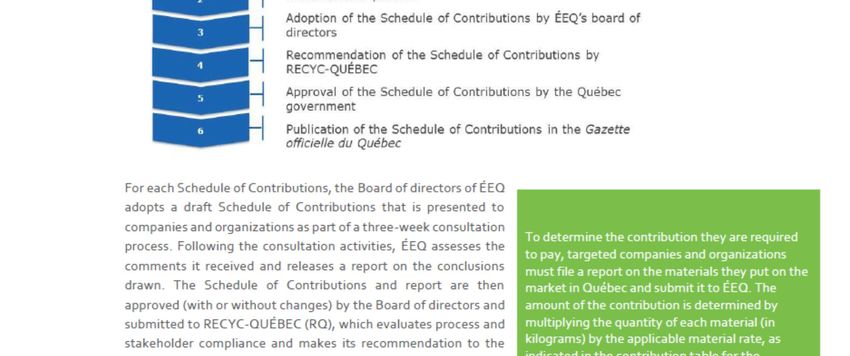
2019 Schedule of Contributions: Consultation report

1. Context
The Environment Quality Act (the Act) and the Regulation respecting compensation for municipal services
provided to recover and reclaim residual materials (the Regulation) stipulate rules for applying the
compensation plan and create a legal obligation for targeted companies and organizations to financially
compensate Québec municipalities for their net, efficient and effective curbside recycling costs.

Éco Enterprises Québec (ÉEQ) is the certified organization that represents those subject to an obligation to
compensate the containers and packaging and printed matter classes and comply with the Act.

ÉEQ is responsible for the development of a Schedule of Contributions to determine the contributions of
companies and organizations for the classes it represents. The process for the 2019 Schedule of Contributions
is the 11th undertaken by ÉEQ.

The Schedule of Contributions is subject to a special consultation with targeted companies and organizations.
ÉEQ’s consultation is focused on the application rules of the Schedule of Contributions, as well as the
contribution table for each materials class. The official process aims to inform and consult with as many targeted
companies and organizations as possible in the steps leading to the adoption and coming into effect of the
Schedule of Contributions for an obligation year.

The 2019 Schedule of Contributions aims to compensate the net, efficient and effective costs of municipal
curbside recycling costs for the year 2018. Before presenting the Schedule of Contributions, ÉEQ considered it
important to detail the context in which it was developed.

Québec’s curbside recycling system at risk with the closure of the Chinese markets
In July 2017, China addressed the World Trade Organization to announce it would be tightening its quality
criteria for recyclable material imports—restrictions that have the effect of a virtual ban. Shockwaves quickly
spread around the world, and Canada and Québec certainly felt the effects of the decision, particularly in 2018.
The crisis that had been anticipated was essentially felt in 2018. The quality of the bales of mixed plastics and
fibres that were warehoused was altered. The average sale prices of the materials plummeted, and sorting
centres increasingly sought support from municipalities.

While Québec’s recycling industry is dynamic in a number of markets, it remains highly dependent on exports
(88% of tonnage according to 2016 RECYC-QUÉBEC (RQ) data). The impact on the province’s curbside
recycling system is therefore significant and was felt acutely with respect to the municipal net costs to be

                                                                                                                4
2019 Schedule of Contributions: Consultation report
compensated. In 2018, RQ announced a series of programs totaling over $10M to support initiatives to
improve the quality of the materials that are recovered and foster better alignment with recyclers. The
financial support program for Québec sorting centres helped reduce the municipal net costs eligible for
compensation by $5M.
In sorting centres and municipalities, 2018 proved challenging. The crisis had repercussions on Québec’s
recycling system and, by the same token, on municipal curbside collection programs. The 2019 Schedule of
Contributions was therefore developed against the backdrop of a global recycling crisis and the
unpredictability of markets and municipal net costs.
2. Mechanism to develop the 2019 Schedule of
Contributions in a global recycling crisis
The development of the 2019 Schedule of Contributions is part of the continuity of past decisions and actions.
It is in line with the organization’s strategic plan and overseen by ÉEQ’s board of directors.
With regard to the estimation of municipal net costs, the compensation plan team worked in collaboration
with the municipal services group to closely monitor the contract renegotiation and reopening processes and
consider all the changes that affect the amounts allocated to municipalities.
2.1 Working group on the materials generated by B2B
After setting rates for short-life containers and packaging sold as products and printed matter sold as products
(CP&PM products) in the 2018 Schedule of Contributions, ÉEQ is currently assessing the options to broaden
the rates table to materials generated by B2B. Just over a year ago, the process was set in motion by a steering
committee including representatives from sector-based employer associations.
Unique in Québec, this initiative should ultimately provide for greater fairness between companies and
materials by ensuring that the materials already included in the compensated municipal net costs are
appropriately reported by the companies that generate them:
New companies whose business models are chiefly based on B2B and which currently contribute little
or nothing to the compensation plan
Companies that currently deduct these materials under the Schedule of Contributions
In 2018, ÉEQ worked to determine the share of establishments that rely on municipal curbside collection
services and the materials they generate according to key main activity sectors and subsectors in order to
develop simple deduction mechanisms accessible to all companies that engage in B2B.
In addition, at the request of the board of directors, we assembled a B2B working group made up of
representatives from companies in a range of sectors to discuss the simplification options that are presented
and assess the potential impacts on reporting companies. Seven companies took part in two group meetings
held this past summer, as well as one-on-one discussions. Following these meetings, the board chose not to
broaden the 2019 fees to B2B and rather asked ÉEQ to pursue its work on the subject.
2.2 Study updates
As part of a long-standing collaboration to develop curbside recycling business intelligence, ÉEQ and RQ
concluded a three-year municipal waste characterization study. The sections completed in 2018 focus on the
5
2019 Schedule of Contributions: Consultation report

residential sector and sorting centres. The province-wide initiative reflects the generation of waste recovered
through municipal curbside collection programs.

The activity-based costing model was not updated this year since it was only adopted by the Québec
government in May. The model is used to calculate the collection, transport and sorting costs, as well as the
revenue generated by the materials. Each model update changes the cost allocation between the three
classes of designated materials, as well as the net material cost used in the formula to develop the Schedule
of Contributions. Relying on last year’s allocation and net costs therefore proved beneficial in this volatile
period.

2.3 Broadening of the rates to CP&PM products in review
The 2018 Schedule of Contributions presented last year introduced a process to broaden the rates to CP&PM
products. The update was in response to a request by the board of directors to broaden the rates to a higher
number of materials designated under the Regulation to ensure fairness and coherence and thus stabilize the
rates considering the decrease in the average quantities of materials placed on the Québec market in recent
years.

Announced since the consultation on the 2017 Schedule of Contributions and generally well received at the
consultation on the 2018 Schedule of Contributions, the broadening led to impacts for some contributing
companies this fall in terms of their data collection methodology and finances.

Considering the impacts of the updates on companies and in an effort to ensure better predictability, ÉEQ will
develop personalized approaches for respondents and strategic contacts in the contributing companies that
are most affected by rate changes to help them anticipate upcoming variations and provide them with
support, should they require it, as they adjust their in-house processes. Approaches for executives are also
being developed to inform them directly and discuss the organization’s future directions. These
communication approaches will avoid confusion over the dates on which upcoming rate changes will be
introduced.

3. Development of the draft 2019 Schedule of
   Contributions
A Schedule of Contributions is made up of application rules and a table of contributions. Both were updated
ahead of the development of the draft 2019 Schedule of Contributions. To foster a certain level of stability for
contributing companies, particularly considering the current global recycling crisis, only minor changes were
made to the application rules. In addition, only the necessary updates to the inputs used in the fee formula
were made.

3.1 Changes to the application rules
In addition to updating the reference years, ÉEQ adjusted the deadlines to submit a report and pay the
contributions owed.

Indeed, in light of the fact that the vast majority of companies wait until the deadlines to file their reports and
pay their contributions, it was decided that the deadlines would be tightened to mitigate the organizational
risks related to the development of the Schedule of Contributions and payment of the compensation to RQ.

                                                                                                                 6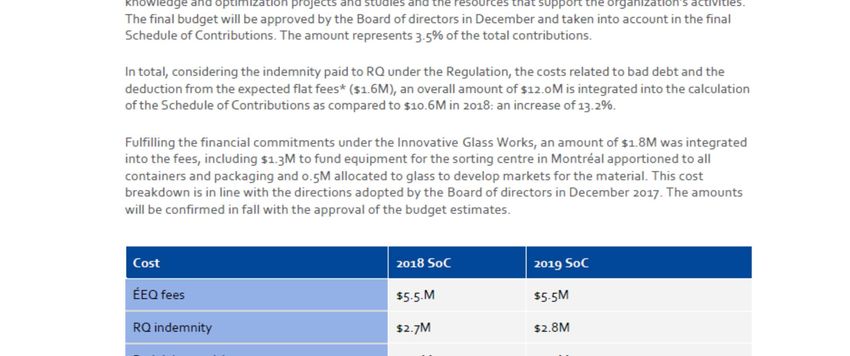
2019 Schedule of Contributions: Consultation report
It was proposed that companies now be given 60 days to file their reports and 90 days to make the first
instalment of their contribution (80% for detailed reports) or the totality of their contribution (flat fee).
Previously, these deadlines were 90 and 120 days, respectively. The second instalment (detailed reports) is
due 150 days following the publication of the Schedule of Contributions, as opposed to 180 days under
previous schedules. It should be noted that providing access to the portal on March 1 of each year gives
companies six months to enter their reporting data.
Another change enables voluntary contributors to report the quantities they place on the market in Québec,
up to the quantities generated. Under previous Schedules of Contributions, companies outside Québec did
not make voluntary contributions if they satisfied the payment exemption criteria. This change will make it
simpler to attain voluntary contributor status for companies outside Québec that want to make voluntary
contributions on behalf of their customers in Québec.
Should the 2019 Schedule of Contributions be published prior to May 31, 2019, the first payment will be due
in summer 2019. The second will be payable in the fall. Note that the option to make instalment payments is
still under review.
3.2 Changes to the contribution table
Besides the costs per material class and net costs for each material, which were updated last year, all the other
inputs were brought up to date. The results are detailed in the following sections.
3.3 2018 system costs
3.3.1 Municipal net costs and performance and efficiency (P&E) factor
To develop the Schedule of Contributions, ÉEQ must first estimate the municipal curbside recycling system
costs. The current global recycling crisis triggers variability in the net costs of municipal programs that is
difficult to monitor and anticipate, rendering the process all the more complex.
ÉEQ therefore revised its approach to better assess the impacts of the crisis on the compensated net costs
and lessen organizational risks. This approach is in line with the avenues for improvement proposed last year
by KPMG-SECOR and was validated by a consulting economist who has collaborated with ÉEQ for several
years.
The methodology was refined and the collection and transport costs were distinguished from the sorting and
conditioning costs. This detailed methodology considers the average increases per class of municipalities used
to calculate the P&E factor, as set out in the Regulation, and all the renegotiated and renewed contracts to
date. The compensation granted to a municipality is calculated based on its performance as compared to that
of the group to which it belongs, and the approach therefore makes it possible to follow not only the cost
variation for a municipality but also the variations in the other municipalities in the same group.
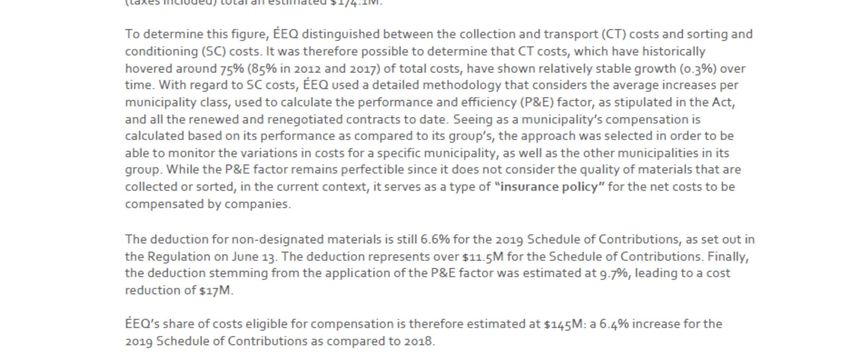
The municipal net costs for 2018, before the deduction of non-designated materials, the P&E factor and the
determination of ÉEQ’s share, are estimated at $174.1M—an 18% increase as compared to actual costs for
2017.
The impacts of the recycling crisis on the costs were felt more acutely as of June 2018. Depending on the
outcome of the sorting centres’ contract renegotiations, ÉEQ anticipates that there will be another 11 to 20%
increase in the costs for 2019, since it will be the first year in which the full effects of the recycling crisis are
felt.
7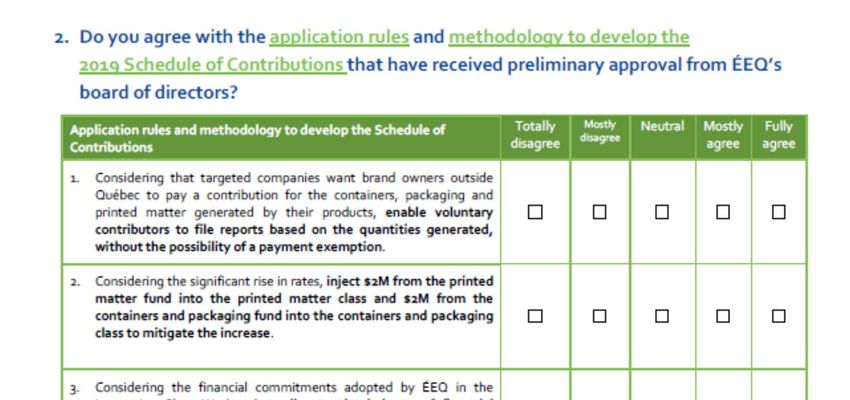
2019 Schedule of Contributions: Consultation report

The P&E factor, which was integrated into the Regulation, is applied to the reported and audited net eligible
costs. It eliminates overruns by gauging municipalities and thus ensuring that companies pay for an effective
system.
Against the backdrop of the crisis, as municipalities renegotiate their contracts with sorting centres, the gaps
between municipalities in the same group widen. For most of these municipalities, the costs will be deducted
by the P&E factor. ÉEQ estimates that the factor will cut a total amount of $17M or 9.7% of costs.

3.3.2        Deduction for non-designated materials
The deduction for non-designated materials remains 6.6% for the 2019 Schedule of Contributions, as
determined by the Regulation. Considering the estimated efficient and effective net costs, $11.5M will be
deducted from the net costs.

                                                                                                              8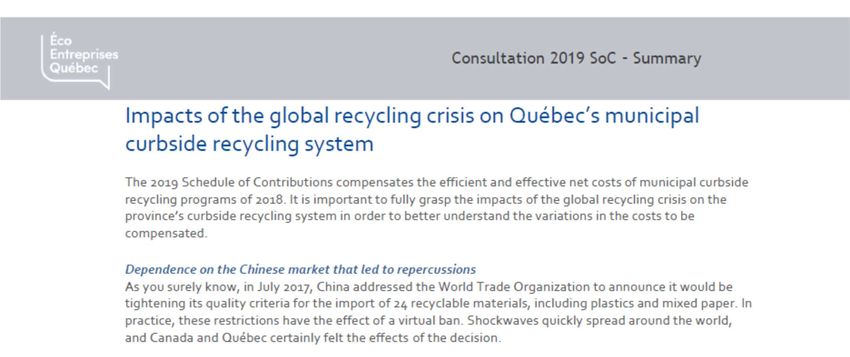
2019 Schedule of Contributions: Consultation report

3.3.3        Municipal costs eligible for compensation

Considering the deduction for non-designated
materials, the deduction from the calculation
of the P&E factor and the municipal
management fees set at 8.55%, the total
estimated costs eligible for compensation are
$158.1M: an increase of 6.4% as compared to
the costs estimated for 2017.

Note that the deduction percentages and
municipal management fees are established in
accordance with the Regulation.

3.3.4        Cost allocation per material class
The cost allocation per material class was adopted by the Québec government in May. It is identical to the
method used for the 2018 Schedule of Contributions. ÉEQ’s total share for the containers and packaging
and printed matter classes is 91.7%.

3.4 Other costs considered
Additional costs are added to the compensation
costs to establish the total contribution to be
paid out by companies. Though the 2019 budget
process is not yet completed, for the purpose of
the Schedule of Contributions, ÉEQ’s fees
remained at $5.5M. This amount represents 3.5%
of the total contributions.

Considering the RQ indemnity provided for in
the Regulation, bad debt provision and
deduction of the amounts expected from flat
fees ($1.6M), a total amount of $12.0M is used to
calculate the Schedule of Contributions, versus
$10.6M for the 2018 Schedule of Contributions,                                               representing
representing an increase of 13.2%.

To mitigate this significant cost increase, ÉEQ’s
board of directors chose to allocate an amount of
$4M from the permanent printed matter and
containers and packaging funds ($2M allocated
to the printed matter class; $2M allocated to the
containers and packaging class).

                                                                                                        9
2019 Schedule of Contributions: Consultation report

3.5 Cost overview
Considering all costs, an amount of $153.0M was used to calculate the 2019 contribution, representing a 4.2%
cost increase as compared to last year.

3.6 Expected quantities of materials
The expected quantities of materials to be reported by companies constitute another parameter that must be
estimated. For the 2019 Schedule of Contributions, the reported amounts total 642 kT, as compared to 655 kT
for the 2018 Schedule of Contributions.

Over the past four years, the process to estimate the quantities in this particular period has become
increasingly complex. Indeed, the filing deadline is very close to the consultation dates and, as noted in the
section on the application rules, the vast majority of companies file their reports very near the deadline and
very few use the early reporting system implemented in 2016. The introduction of tighter deadlines will help
mitigate this particular issue.

                                                                                                          10
2019 Schedule of Contributions: Consultation report
The quantities used to develop the 2019 Schedule of Contributions presented at the consultation meetings
are detailed here.
Estimated quantity
Class and sub-class Material
(kg) 2019
PRINTED MATTER 140 337 019
Newsprint inserts and circulars 92 875 492
Catalogues and publications 11 747 308
Magazines 6 696 562
Telephone books 587 060
Paper for general use 4 563 414
Other printed matter 23 867 183
CONTAINER AND PACKAGING 501 933 178
Corrugated cardboard 57 058 644
Kraft paper shopping bags 3 143 279
Kraft paper packaging 1 981 269
Paper and 89 357 738
cardboard Boxboard and other paper packaging
Gable-top containers 10 642 311
Laminated paper 13 221 805
Aseptic containers 5 960 890
PET bottles 28 454 071
HDPE bottles 19 105 121
Plastic laminates 18 345 512
HDPE and LDPE plastic film 20 600 752
HDPE and LDPE plastic shopping bags 8 808 546
Plastics Expanded polystyrene – food 3 577 489
Expanded polystyrene – protection 1 653 914
Non-expanded polystyrene 4 424 247
PET containers 7 889 152
Polylactic acid (PLA) and other degradable plastics 491 197
Other plastics, polymers and polyurethane 33 909 736
Aluminium containers for food and beverages 2 854 957
Aluminium
Other aluminium containers and packaging 4 823 938
Steel aerosol containers 2 430 778
Steel
Other steel containers 23 510 151
Clear glass 56 442 516
Glass
Coloured glass 83 245 165
TOTAL 642 270 197
These quantities account for short-life containers and packaging sold as products and printed matter sold as
products (CP&PM products).
112019 Schedule of Contributions: Consultation report
3.7 Impact on materials rates
Overall, the higher costs considered for ÉEQ’s contribution, along with the decrease in expected quantities, lead
to an average rate increase of 6.3% as compared to the 2018 Schedule of Contributions.
With the use of the funds, the average rate of the 2019 Schedule of Contributions is $238/t, which represents an
increase equivalent to the anticipated 6.4% increase in net municipal costs.
3.7.1 Average rate per class
Under the 2019 Schedule of Contributions, the average rate for printed matter is $235/t, an increase of 10.9%
as compared to the previous schedule. Without the $2M stimulus from the printed matter fund, the increase
would have totalled 18%.
Under the 2019 Schedule of Contributions, the average rate for containers and packaging is $239 $/t, an
increase of 4.9% as compared to the previous schedule. The $2M stimulus decreased the average rate by $4/t.
122019 Schedule of Contributions: Consultation report
3.7.2 Contribution table for the 2019 Schedule of Contributions
The following contribution table for the 2019 Schedule of Contributions, which considers the updated
inputs, was presented at the consultation meetings.
Material 2019 rate Variation
($/t) vs. 2018 SoC
Printed matter 235.10 10.9%
Newsprint inserts and circulars 204.57 11.1%
Catalogues and publications 294.85 9.7%
Magazines 294.85 9.7%
Telephone books 294.85 9.7%
Paper for general use 294.85 9.7%
Other printed matter 294.85 9.7%
Containers and packaging 239.08 4.9%
Paper/cardboard 202.32 4.3%
Corrugated cardboard 183.93 4.2%
Kraft paper shopping bags 183.93 4.2%
Kraft wrapping paper 183.93 4.2%
Boxboard and other paper packaging 201.48 3.9%
Gable-top containers 191.70 2.3%
Laminated paper 288.32 5.1%
Aseptic containers 235.11 5.1%
Plastics 359.58 5.0%
PET bottles 285.41 4.0%
HDPE bottles 109.83 2.5%
Plastic laminates 474.33 6.2%
HDPE and LDPE film 474.33 6.2%
HDPE and LDPE shopping bags and others 474.33 6.2%
Expanded polystyrene – food packaging 793.43 7.9%
Expanded polystyrene – cushioning packaging 793.43 7.9%
Non-expanded polystyrene 793.43 7.9%
PET containers 285.41 4.0%
Polylactic acid (PLA) and other degradable plastics 793.43 7.9%
Other plastics. polymers and polyurethane 288.37 3.9%
Aluminium 181.44 7.6%
Aluminum containers for food and beverages 181.44 7.6%
Other aluminum containers and packaging 181.44 7.6%
Steel 173.22 2.6%
Aerosol containers 173.22 2.6%
Other steel containers 173.22 2.6%
Glass 175.17 4.1%
Clear glass 175.15 4.1%
Coloured glass 175.19 4.1%
Average rate 238.21 6.23%
132019 Schedule of Contributions: Consultation report
3.7.3 Flat fees
There were no changes to the eligibility of low-volume producers. The amounts of the contributions by
companies eligible to pay a flat fee therefore rose based on the increase in the average rate: by 6.3%.
3.7.4 Analysis of impacts on contributing companies
As provided in ÉEQ’s process to develop the Schedule of Contributions, the impacts of the new Schedule of
Contributions on companies are systematically analyzed. Considering the average rate increase of 6.3%, ÉEQ
anticipates that:
three-quarters of companies will see an increase in their contributions of less than 7%
close to 19% will experience a 9 to 11% increase
the median invoice will rise by 5.2%
Different activity sectors generate different
materials, and the companies that generate
printed matter (e.g. in the publishing, insurance
and banking industries) will experience a more
significant increase, between 9 and 11%. For
retailers, the increases generally fall within the
average. These ratios vary depending on the
quantities of printed matter or polystyrene
generated, since they are the two materials with
the highest increases.
With regard to manufacturers, the vast
majority will see increases of less than 7%, with
a median of 4% and 5%. This ratio is due to the
fact that manufacturers generate less printed
matter and more PET, HDPE, steel and glass.
142019 Schedule of Contributions: Consultation report
3.8 Validation of the 2019 Schedule of Contributions
The 2019 Schedule of Contributions was validated by Daniel Denis, associate consulting economist at KPMG-
SECOR. Mr. Denis has collaborated with ÉEQ for over 12 years. He certifies that he validated the methodology
to estimate the municipal net costs of curbside recycling and the directions of the 2019 Schedule of
Contributions and is satisfied with both. The attestation is in Annex 3.
4. Consultation with companies and organizations
In keeping with the program to consult companies and organizations on the 2019 Schedule of Contributions,
ÉEQ held two consultation meetings on October 23, 25, 2018, in Montréal and Toronto, respectively.
4.1 Dissemination of the consultations
Official invitations and releases were sent out electronically, followed by e-mail and telephone reminders.
These communications were aimed at a number of targets and intermediaries, including:
companies and organizations registered with ÉEQ
company contacts
executives on our distribution lists
stakeholders in the environment sector on our distribution lists
a significant number of sector associations active in Québec or whose members conduct business in
Québec
4.2 Participation in the consultation meetings
Meeting Montréal Toronto A total of 83 company and organization representatives
Attendance in attended the consultation meetings in person or through audio
18 15
person broadcast (in French during the meeting in Montréal and in
Audio English during
17 33
broadcast the meeting in
Subtotal 35 48 Toronto). This is
a decrease as
TOTAL 83 compared to the
consultations on
the 2018 Schedule of Contributions, in which 167 people took
part.
With regard to the distribution of companies by contribution
level, 80% of participants represented companies and
organizations that contribute over $10K, perhaps because they
are more affected by rate variations. Only 12% of participants
represented low-volume producers and companies and
organizations exempt from payment.
152019 Schedule of Contributions: Consultation report
4.3 Questions and comments on the Schedule of
Contributions
In addition to the consultation meetings on the 2019 Schedule of Contributions, ÉEQ gave a presentation on
the future directions of the upcoming schedules and current projects within the local and global contexts.
This report outlines only the first aspect, which is the focus of the consultation.
Participants (in person and online) wanting to ask questions could do so at the end of each section and
had the opportunity to express themselves on the specific points that arose.
Companies could also share their comments by filing in a questionnaire or sending a written communication
on a particular issue.
4.3.1 Questions raised by targeted companies at the consultation meetings
It must first be acknowledged that there were few
questions. The 14 interventions by 11 participants were
grouped into 4 categories:
Development of the 2019 Schedule of Contributions
Containers, packaging and printed matter sold as
products (CP&PM products)
Future directions
Other
Just over three-quarters of the questions related to the
Schedule of Contributions (2019 and upcoming). In Toronto,
the vast majority of questions focused on innovative
environmental criteria and the credit for recycled content.
At both consultation meetings, the distribution of
companies per activity sectors was relatively equal and
representative of the general distribution of contributing companies.
The questions listed here are summarized and grouped by contributing company in the order they were raised.
Response were provided for each.
Table 1: List of questions raised at the consultation meetings
Participating companies Questions raised on the 2019 Schedule of Contributions
Coca-Cola How can we break the vicious cycle of underfunding in sorting centres?
With regard to the $2M that was taken out of the reserves (Funds), what is the current status
of the reserves?
Fromagerie Bergeron Are B2B merchandise transport boxes included in the 2019 Schedule of Contributions?
Cycle Environnement What is your response to the advent and development of major online retailers (e-commerce,
(representing David’s companies outside Québec) and their packaging, which is flooding the system?
Tea)
Canadian Tire With regard to the 63.6% residential recovery rate, are actions being taken to increase this
Corporation figure?
Procter & Gamble Regarding the increase in municipal net costs, are you able to determine where the 15%
originates?
162019 Schedule of Contributions: Consultation report
Participating companies Questions raised on the 2019 Schedule of Contributions
Regarding the recycled content thresholds, how can high-volume producer like us reach 100%
to request the credit?
Emerson Electric In the future, will ÉEQ provide the option for companies to pay their contributions in four
annual instalments, as other provinces do?
S.C. Johnson Could you explain the credit for recycled content?
Costco Wholesale Is there a cap on the credit for recycled content?
Canada
3M Canada Could you explain why the rate for no.6 unexpanded rigid polystyrene (e.g. rigid transparent
blister packaging) is so much higher than the rate for the other plastics category, which
includes no.7 made up of mixed plastics?
Loblaw Companies In terms of the credit for recycled content, would it be possible to provide a proportional
credit?
Envirotech Associates Do you have a preliminary assessment of the volumes that will be reported in the CP&PM
(representing Michaels products category and of the impacts they will have on the Schedule of Contributions and
Stores) rates?
4.3.2 Questions on the 2019 Schedule of Contributions
As set out in the consultation program, a questionnaire (Annex 5) was handed out at the consultation
meetings. It was also sent out via e-mail to participants to gather their comments and made available to
contributing companies on ÉEQ’s website. The questionnaire on the 2019 Schedule of Contributions is divided
into four parts: the first on respondents’ understanding of the impacts of the recycling crisis on the net costs;
the second on the application rules and methodology to develop the 2019 Schedule of Contributions; the third
on the respondents themselves and the fourth on future directions. The second and fourth parts included
space in which respondents could add their comments and suggestions.
With regard to the specific questions on the 2019 Schedule of Contributions, companies had to affirm their
level of agreement with the elements set out in the Schedule of Contributions presented at the consultation
meetings:
Enabling voluntary contributors to report based on quantities generated, without authorization for
payment exemption
Injecting $2M from the permanent printed matter fund into the printed matter class and $2M from the
permanent containers and packaging fund into the containers and packaging class to mitigate the rate
increase
Postponing the decision to make materials generated by B2B subject to a fee to a later Schedule of
Contributions
A total of 18 respondents filled out and returned the questionnaire. While the majority of responses (69%)
were favourable (somewhat favourable or favourable) to the elements set out in the Schedule of
Contributions, such a low response rate makes specific analyses impossible and cannot be considered
statistically significant. However, the limited number of comments is still telling since dissatisfied companies
usually mobilize and voice their concerns. Because the process has been the same for the past decade and
companies are familiar with the mechanisms, it could be assumed that, as a whole, the directions that were
presented meet expectations.
4.3.3 Correspondence and comments
Only one contributing company submitted correspondence regarding the 2019 Schedule of Contributions: the
Société des alcools du Québec (SAQ). The letter is in Annex 6.
At the consultation meetings, companies and organizations also submitted comments, which are addressed
in the following sections.
172019 Schedule of Contributions: Consultation report
4.3.3.1 In connection with the 2019 Schedule of Contributions
Funding the Innovative Glass Works program with glass
The funds required to lead the balance of the commitments undertaken as part of the Innovative Glass Works
plan are accounted for in the total costs considered in the 2019 Schedule of Contributions. The SAQ notes
that the expenditures to purchase equipment should be allocated to all materials and not only containers and
packaging. The government corporation also proposed that the surpluses from the permanents funds (and
ÉEQ’s other financial provisions) first be used to compensate for the rate increases as a result of the projects.
Rates for low-volume producers
To alleviate their administrative burden, low-volume producers may choose to pay a flat fee according to
generated tonnage thresholds or turnover between $1M and $2M. It was suggested that ÉEQ review the
option to create a new threshold to reduce the gap between the amount owed by companies whose turnover
is less than $2M and the contribution owed by companies that exceed, even slightly, the $2M cut-off.
Following a number of discussions with newly canvassed companies and others that generate heavy materials
(e.g. printed matter or glass), ÉEQ had already planned to examine the issue and recommends that a
dedicated working committee be assembled when developing the 2020 Schedule of Contributions in order to
simplify administrative procedures for small businesses.
4.3.3.2 Additional comments on future directions
Analysis of materials performance
The project to analyze the performances of the materials in the recycling value chain has drawn interest.
Respondents noted that the initiative seemed to be a good opportunity to set out optimization options across
the value chain and further develop the materials classification by making the distinction between materials
with different properties and revising the aggregations in the contribution table.
ÉEQ acknowledges the feedback and notes that changes that may affect the materials classification and
contribution table will be presented to companies in 2019.
Business-to-business (B2B)
A majority of questionnaire respondents said that they were favourable to the broadening of the materials
rates to materials generated by B2B provided contributors were given sufficient notice ahead of the coming
into effect of the change.
ÉEQ notes that analyses on the option to broaden the rates to materials generated by B2B are ongoing.
Fairness remains at the core of the approach, which also considers the complexity a broadening may entail.
Containers, packaging and printed matter sold as products
The broadening of the rates to short-life containers and packaging sold as products and printed matter sold
as products since the 2018 Schedule of Contributions has raised methodological and financial issues for a
number of companies whose business models are closely linked to these products.
ÉEQ is aware of the impacts stemming from the broadening of the materials subject to a fee and will adjust
its communications on these upcoming projects in an effort to reach the largest possible audience.
182019 Schedule of Contributions: Consultation report
5. Changes to the 2019 Schedule of Contributions
As announced at the consultation meetings in October, a number of parameters were updated, including:
municipal net costs
other costs incurred through ÉEQ projects
total costs considered in the funding formula
5.1 Updated inputs
5.1.1 Updated municipal net costs
ÉEQ continued to monitor municipal contract renegotiations and renewals. Few changes were noted since
early October. However, ÉEQ observed a number of variations that were integrated into the calculation of the
net costs. ÉEQ’s share of municipal net costs therefore totals $144.4M and not $145.0M.
2018 2019 SoC 2019 SoC
SoC consultation updated
Municipal net costs — ÉEQ share $136.3M $145.0M $144.4M
5.1.2 Other costs
Because the budget process ended in the fall, the most recent data were used. ÉEQ has maintained its planned
budget of $5.5M—a figure that is stable as compared to the 2018 Schedule of Contributions and the details
presented at the consultation meetings.
However, funding for the balance of the commitments under the Innovative Glass Works plan was adjusted
downward following the revision of estimated costs. The amount, which was initially estimated at $1.8M, was
decreased to $1.2M ($1M to fund equipment purchases and $200K to develop markets).
2018 2019 SoC 2019 SoC
SoC consultation updated
ÉEQ fees $5.5M $5.5M $5.5M
Bad debt provision $2.9M $3.0M $3.0M
Innovative Glass Works plan $1.8M $1.8M $1.2M
Printed matter fund $(1.5)M $(2.0)M $(2.0)M
Containers and packaging fund - $(2.0)M $(2.0)M
Credit for recycled content provision $0.6M $0.5M $0.5M
Anticipated reports by low-volume producers $(1.4)M $(1.6)M $(1.6)M
RQ indemnity $2.7M $2.8M $2.8M
Other total costs $10.6M $8.0M $7.4M
Variation +0% -24.5% -30.2%
192019 Schedule of Contributions: Consultation report
5.1.3 Total costs to consider in the funding formula
The update is reflected in the total costs to consider in the formula to develop the Schedule of Contributions.
Overall, there was a 3.33% increase in costs as compared to 2018, versus 4.2% presented at the consultation
meetings. This is down slightly.
The total costs to consider when calculating the Schedule of Contributions fell from $153.0M to $151.8M,
taking the average from $238/t to $237/t and leading to an average increase of 5.9% versus 6.3%.
Considering the updated costs and maintaining the allocation presented for the draft 2019 Schedule of
Contributions, the increase in the average rate for printed matter changes from 10.9 to 10.4%. The increase
for containers and packaging falls from 4.9% to 4.4%.
2018 2019 SoC 2019 SoC
SoC consultation updated
Municipal net costs — ÉEQ share $136.3M $145.8M $144.4M
Other costs with funding $10.6M $8.0M $7.4M
Total costs considered to calculate company contributions $146.9M $153.0M $151.8M
Variation -1.7% +4.2% +3.33%
5.2 New table of contributions
The final table was updated following the meeting of the board of directors on December 7 and included in
Section 6 of this report. The updated table include the decreases in the net costs to be compensated and
funding for the Innovative Glass Works plan.
However, because the average rate has remained relatively stable following the adjustments presented in
Section 5.1 and considering the fact that the flat fees were updated in the 2019 Schedule of Contributions, the
rates for flat fees are the same as those presented at the consultation meetings.
Tonnage generated criterion Turnover criterion 2018 SoC 2019 SoC
1 to 2.5 tonnes $420 $450
2.5 to 5 tonnes $890 $945
5 to 10 tonnes $1 775 $1 885
10 to 15 tonnes $1M to $2M $2 965 $3 150
6. Position of the board of directors on the 2019
Schedule of Contributions
ÉEQ’s board of directors (BOD) would like to thank the companies and organizations that took part in the
meetings held as part of the consultation process on the 2019 Schedule of Contributions. It notes the drop in
the number of participants despite the personalized reminders and ongoing recycling crisis, which led to an
increase in net costs and, consequently, in the rates. The BOD invites ÉEQ’s executive team to pursue its
202019 Schedule of Contributions: Consultation report
efforts to encourage companies and organizations to participate in the consultation process, which is vital to
ÉEQ.
The members of the BOD note that little feedback was received and are aware that the pre-release of
information and relatively stable increase in materials rates considering the context of other Canadian
programs may have curbed participation. The board acknowledges the comments received by the deadline
and would like to thank the companies and organizations that took the time to share their opinions.
In the context of the recycling crisis
The BOD emphasizes that the recycling crisis arising from the closing of the Chinese markets provides a
genuine opportunity to call for the modernization of the compensation plan, as well the curbside recycling
system. Indeed, the consequences observed on markets, sorting centres, municipalities and citizens
constitute means to seek the modernization of the compensation plan and curbside collection system. The
BOD is of the opinion that, from the extended producer responsibility (EPR) perspective, all reforms must
hinge on the greater involvement, accountability and recognition of contributing companies, beyond the
simple extension of the responsibilities of government.
The BOD recognizes ÉEQ’s efforts to closely monitor the situation in municipalities and sorting centres and
remain proactively engaged with all levels of government to determine solutions. The situation will certainly
remain ongoing in 2019, and ÉEQ’s executive team will work actively to give expression to the organization’s
vision to make Québec’s recycling industry the most economically, environmentally and socially efficient in
North American from a circular economy perspective.
In the context of the integration of CP&PM products into the 2018 Schedule of Contributions
and eventual broadening of the rates to B2B
The members of the BOD are aware of the impacts of the broadening of the rates to CP&PM products on the
2018 Schedule of Contributions. Also considering the pressure resulting from the increase in municipal net
costs, the BOD chose to limit all other fee changes in order to provide a certain level of stability. Therefore,
while the broadening of the rates to materials generated by B2B is important, it has been postponed to a later
Schedule of Contributions. The BOD has asked ÉEQ executives to pursue the action plan to assess the impacts
of the broadening with a special focus on newly targeted companies, companies that report in accordance
with current application rules and the additional resulting contributions. The BOD also requested that a
reflection be undertaken to identify targeted communication approaches.
While few companies responded to the questionnaire, the BOD notes that the majority (72%) of respondents
were somewhat favourable or favourable to the broadening of the designated materials to B2B. It also
acknowledges the comments on CP&PM products and B2B. Members underscore that fairness remains at the
core of the organization’s concerns and decisions and, to this end, they seek to foster greater consistency
between the materials subject to regulation and the materials subject to a fee. The board is also focused on
ensuring the simplicity of the reporting process and predictability from the financial and administrative
perspective when introducing changes.
Funding of the Innovative Glass Works plan
The members of the board of directors were given the comments on this innovative initiative. The report on
the 18-month experimental pilot projects will be submitted by the end of the year, and the BOD will consider
the recommendations with regard to further steps. The board highlights the need to find sustainable solutions
for the material and stresses that the development of new markets requires expertise, the adaption of
business models and, therefore, time.
In terms of the $1.8M in funding to pursue the Innovative Glass Works plan, following the budget process, the
board lowered the allocated amount to $1.2M. The BOD considered the feedback it received, assessed the
funding options and, in light of the increase in the rates for printed matter, chose to retain the funding
212019 Schedule of Contributions: Consultation report
allocation presented at the consultation meetings: $1.0M for containers and packaging and $0.2M to develop
new markets and specifically the market for glass.
Fee structure for small businesses
With regard to small businesses, the BOD is sensitive to the argument calling for fairness between the
companies eligible to use the simplification process and pay a flat rate and those that are not. Members asked
ÉEQ executives to conduct the studies required to explore possible solutions and propose a recommendation
for the 2020 Schedule of Contributions.
Other elements
Considering the few comments received through the questionnaires on the other elements of the
2019 Schedule of Contributions presented at the consultation meetings, the BOD maintains these decisions:
Enable voluntary contributors to report based on quantities generated, without authorization for
payment exemption
Inject $2M from the permanent printed matter fund into the printed matter class and $2M from the
permanent containers and packaging fund into the containers and packaging class to mitigate the
resulting rate increase
Postpone the decision to make materials generated by B2B subject to a fee to a later Schedule of
Contributions
The board asked ÉEQ executives to continue the analysis of the materials in the value chain of curbside
recycling. This forward-looking project will direct ÉEQ’s actions in connection with optimization and
especially the fee structure and compensation plan in terms of the review of the classification of the materials
subject to a fee and aggregated rates in the table of contributions, as well as the identification of problematic
materials in the curbside recycling process that could be the subject of eco-modulation in the Schedule of
Contributions and the approach to issue a future ecodesign credit. Considering the possible impacts on the
materials rates and company contributions, the BOD requested that ÉEQ produce the standard analyses and
action plans so contributors can anticipate changes with a reasonable timeframe.
The members of the board of directors recognize the significant efforts invested by ÉEQ’s executives to
stabilize the municipal net costs and optimize the value chain of curbside recycling to the benefit of the
contributing companies. Members acknowledge that there are a range of challenges leading up to the
development of stable and diversified markets and are of the opinion that the coordination and liaison efforts
initiated a few years ago will foster the emergence of a circular economy that will profit contributing
companies in the long term.
Finally, the BOD would like to thank all the representatives from companies and organizations who
contributed to the consultation process. Their participation is important and essential to further develop the
Schedule of Contributions and guide the decisions of the board of directors.
6.1 New table of contributions
The materials rates of the 2019 Schedule of Contributions were updated to reflect the updated net costs and
downward revision of the amount to fund the Innovative Glass Works plan.
222019 Schedule of Contributions: Consultation report
2018 2019 SoC 2019 SoC ∆
Material
Soc consultation updated 2018
$/t $/t $/t
Printed matter
Newsprint inserts and circulars 184.14 204.57 203.74 10.6%
Catalogues and publications 268.90 294.85 293.65 9.2%
Magazines 268.90 294.85 293.65 9.2%
Telephone books 268.90 294.85 293.65 9.2%
Paper for general use 268.90 294.85 293.65 9.2%
Other printed matter 268.90 294.85 293.65 9.2%
Containers and packaging
Corrugated cardboard 176.48 183.93 182.70 3.5%
Kraft paper shopping bags 176.48 183.93 182.70 3.5%
Kraft wrapping paper 176.48 183.93 182.70 3.5%
Boxboard and other paper packaging 193.96 201.48 200.23 3.2%
Gable-top containers 187.44 191.7 190.5 1.6%
Laminated paper 274.32 288.32 286.73 4.5%
Aseptic containers 223.75 235.11 233.71 4.5%
PET bottles 274.41 285.41 283.38 3.3%
HDPE bottles 107.19 109.83 108.44 1.2%
Plastic laminates 446.84 474.33 471.46 5.5%
HDPE and LDPE film 446.84 474.33 471.46 5.5%
HDPE and LDPE shopping bags and others 446.84 474.33 471.46 5.5%
Expanded polystyrene – food packaging 735.44 793.43 789.39 7.3%
Expanded polystyrene – cushioning packaging 735.44 793.43 789.39 7.3%
Non-expanded polystyrene 735.44 793.43 789.39 7.3%
PET containers 274.41 285.41 283.38 3.3%
Polylactic acid (PLA) and other degradable plastics 735.44 793.43 789.39 7.3%
Other plastics. polymers and polyurethane 277.57 288.37 286.18 3.1%
Aluminum containers for food and beverages 168.66 181.44 179.87 6.6%
Other aluminum containers and packaging 168.66 181.44 179.87 6.6%
Aerosol containers 168.91 173.22 171.61 1.6%
Other steel containers 168.91 173.22 171.61 1.6%
Clear glass 168.32 175.15 172.18 2.3%
Coloured glass 168.32 175.19 172.26 2.3%
Average rate 224.24 238.21 236.37 5.4%
232019 Schedule of Contributions: Consultation report
Annex 1 — 2015–2017 residential characterization
242019 Schedule of Contributions: Consultation report
Recovery rates of designated materials under ÉEQ’s Schedule
of Contributions*
Category and
Material Recovery rate
sub-category
PRINTED MATTER
Newsprint inserts and circulars 85.1%
Catalogues and publications 82.4%
Magazines 85.6%
Telephone books 81.6%
Paper for general use 56.8%
Other printed matter 62.4%
CONTAINERS AND PACKAGING
Corrugated cardboard 77.5%
Kraft paper shopping bags 41.3%
Kraft paper packaging 23.2%
Paper and cardboard Boxboard and other paper packaging 61.9%
Gable-top containers 77.9%
Laminated paper 33.4%
Aseptic containers 54.9%
PET bottles 67.8%
HDPE bottles 68.0%
Plastic laminates 16.2%
HDPE/LDPE plastic film 34.8%
HDPE/LDPE film shopping bags 15.8%
Plastic Expanded polystyrene - food 11.5%
Expanded polystyrene - protection 37.5%
Non-expanded polystyrene 24.9%
PET containers 57.3%
Polylactic acid (PLA) and other degradable plastics 54.6%
Other plastics, polymers and polyurethane 43.7%
Aluminum containers for food and beverages 48.2%
Aluminium
Other aluminum containers and packaging 10.0%
Steel aerosol containers 17.5%
Steel
Other steel containers 64.9%
Clear glass 78.8%
Glass
Coloured glass 78.8%
*Taken from the 2015–2017 residential characterization study co-funded by ÉEQ and RECYC-QUÉBEC
252019 Schedule of Contributions: Consultation report
Annex 2 — 2016 activity-based costing
262019 Schedule of Contributions: Consultation report
Net costs of designated materials under ÉEQ’s Schedule of
Contributions*
Net cost per
Category and
Material material
sub-category
($/tonne)
PRINTED MATTER
Newsprint inserts and circulars $137/t
Catalogues and publications $137/t
Magazines $134/t
Telephone books $137/t
Paper for general use 1$41/t
Other printed matter $149/t
CONTAINERS AND PACKAGING
Corrugated cardboard $190/t
Kraft paper shopping bags $190/t
Kraft paper packaging $190/t
Paper and cardboard Boxboard and other paper packaging $183/t
Gable-top containers $215/t
Laminated paper $264/t
Aseptic containers $225/t
PET bottles $292/t
HDPE bottles $12/t
Plastic laminates $663/t
HDPE/LDPE plastic film $617/t
HDPE/LDPE film shopping bags $617/t
Plastic Expanded polystyrene - food $2 352/t
Expanded polystyrene - protection $2 352/t
Non-expanded polystyrene $438/t
PET containers $391/t
Polylactic acid (PLA) and other degradable plastics $270/t
Other plastics, polymers and polyurethane $265/t
Aluminum containers for food and beverages -1$83/t
Aluminium
Other aluminum containers and packaging -$13/t
Steel aerosol containers $53/t
Steel
Other steel containers $104/t
Clear glass $201/t
Glass
Coloured glass $201/t
*Taken from the 2016 activity-based costing model co-funded by ÉEQ and RECYC-QUÉBEC
272019 Schedule of Contributions: Consultation report
Annex 3 — Letter of validation: contribution table
282019 Schedule of Contributions: Consultation report
292019 Schedule of Contributions: Consultation report
302019 Schedule of Contributions: Consultation report
Annex 4 — Executive summary: draft 2019 Schedule
of Contributions
31You can also read