INFORME DE CALIDAD DE AGUA 2020
←
→
Page content transcription
If your browser does not render page correctly, please read the page content below
2020

             INFORME DE CALIDAD DE AGUA

Photo credit: iStock.
Denver Water’s Public Water System Identification: CO0116001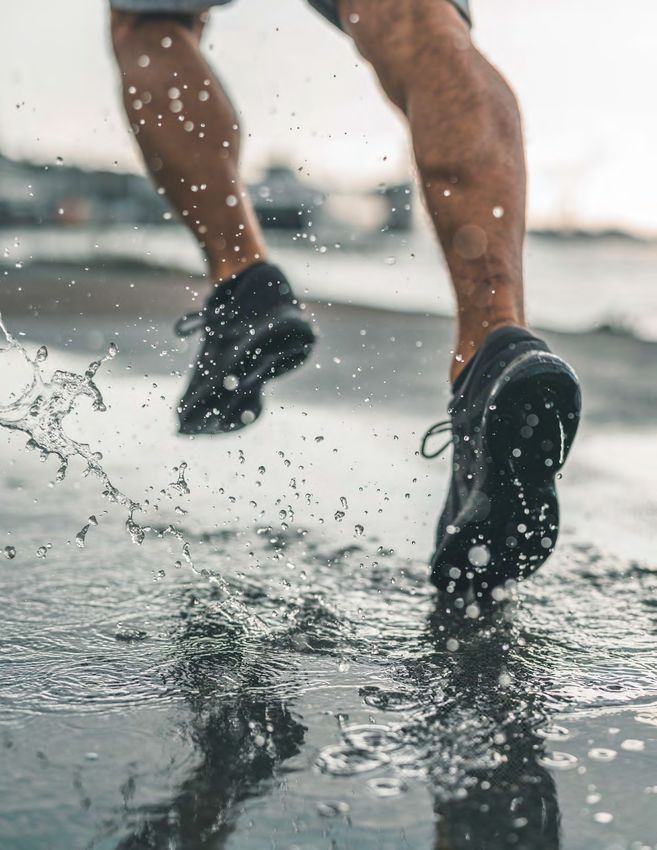
3,100
                        square miles of watersheds

                                    5
                           mountain reservoirs

                               3,000
                        miles of pipe to carry water

Photo credit: iStock.
WHAT IS THIS REPORT?
The Environmental Protection Agency a source water assessment of the For more information on the report,
requires public water suppliers that potential for contaminants reaching contact the Colorado Department
serve the same people year-round any of Denver Water’s three terminal of Public Health and Environment
(community water systems) to provide reservoirs at Strontia Springs, Marston by calling 303-692-2000 or visit
consumer confidence reports to their and Ralston, the last stop for the water Colorado.gov/cdphe/ccr. The report
customers. These reports are also before it is treated. The potential is located under “Guidance: Source
known as annual water quality reports. sources of contamination that may exist Water Assessment Reports.” Search
This report summarizes information are: EPA areas of concern; permitted the table using 116001 Denver Water
regarding water sources used, any wastewater discharge sites; above Board. Or call Denver Water Customer
detected contaminants, compliance ground, underground and leaking Care at 303-893-2444.
and educational information. storage tank sites; solid waste sites;
Información importante
Where does your existing or abandoned mine sites; other
acerca de la calidad del agua
water come from? facilities; commercial, industrial and Para recibir la versión en español del
transportation activities; residential, Informe de Calidad de Agua de 2020 de
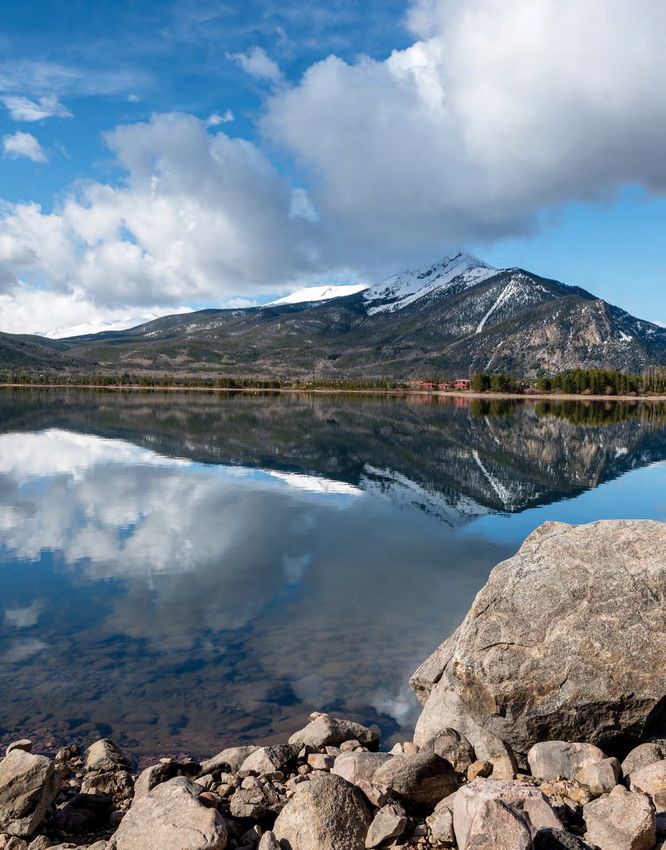
Denver’s drinking water
urban recreational grasses; quarries, Denver Water, llame a Servicio
comes from rivers, lakes,
strip mines and gravel pits; agriculture; al cliente al 303-893-2444 o visite
streams, reservoirs and
forests; septic systems; oil and gas denverwater.org/CalidadDeAgua.
springs fed by high-quality mountain
wells; and roads.
snow runoff. Denver Water’s supply is
100% surface water that originates in
sources throughout 3,100 square miles
of watersheds on both sides of the
Continental Divide.
Mountain water sources
Denver Water’s water sources are the
South Platte River and its tributaries, the
streams that feed Dillon
Reservoir, and the creeks
and canals above the Fraser
River. Denver Water stores
its water in five mountain reservoirs:
Antero, Eleven Mile Canyon, Cheesman,
Dillon and Gross. From these reservoirs,
the water is then sent to the metro area
through a complex system of streams,
canals and pipes.
After treatment, drinking water is
fed by both gravity and pumps to a
system of underground, clean-water
reservoirs before continuing to your
home or business. More than 3,000
miles of pipe carry water to Denver
Water customers.
Source water
assessment
The Colorado Department
of Public Health and
Environment has completed
1 | 2020 Water Quality Report |
SOURCES OF
DRINKING WATER
                                                                     DENVER WATER’S
                                                                     SYSTEM
                                                                     Devoted to water quality
                                                                     Denver Water proudly serves high-quality water to 1.5 million
                                                                     people in the city of Denver and many surrounding suburbs.
                                                                     Since 1918, we have expertly planned, developed and operated
                                                                     a complex system that provides clean, safe, great-tasting water.
                                                                     Denver Water is a public agency funded by water rates, new tap
 Photo credit: iStock.                                               fees and the sale of hydropower, not taxes. We are Colorado’s
                                                                     oldest and largest water utility — Denver Water has a total water
Sources of drinking water include rivers,                            service area of approximately 300 square miles.
lakes, streams, ponds, reservoirs, springs and                       Denver Water serves 25% of the state’s population with less than
wells. As water travels over the surface of                          2% of all the water used in the state. The natural environment is
the land or through the ground, it dissolves                         our lifeline, and we help protect it by promoting wise water use.
naturally occurring minerals and, in some                            We take our water quality very seriously. Last year, we collected
cases, radioactive material. It can also pick up                     more than 35,000 samples and conducted more than 70,000
substances resulting from human activity and                         tests to ensure our water is as clean and safe as possible. Denver
                                                                     Water vigilantly safeguards our mountain water supplies, and
the presence of animals. Contaminants may
                                                                     the water is carefully treated before it reaches your tap. This
include the following:
                                                                     brochure provides data collected throughout 2019.
Microbial contaminants
Viruses, bacteria and other microbes that
may come from sewage treatment plants,                                Reservoir                      Capacity    Percent of
septic systems, agricultural livestock                                                               (acre-feet) Total Capacity
operations and wildlife.                                              Dillon                          257,304               37.1
Inorganic contaminants                                                Eleven Mile Canyon               97,779               14.1
Salts and metals, which can be naturally                              Williams Fork                    96,822               14.0
occurring or result from urban stormwater
                                                                      Cheesman                         79,064               11.4
runoff, industrial or domestic wastewater
discharges, oil and gas production, mining                            Gross                            41,811                6.0
or farming.                                                           Chatfield
                                                                                                       27,076                4.0
                                                                      (Denver's portion)
Pesticides and herbicides
Chemical substances resulting from a variety                          Wolford Mountain
                                                                                                       25,610                3.7
of sources, such as agricultural and urban                            (Denver's portion)
stormwater runoff, and residential uses.                              Antero                           19,881                2.9
Organic chemical contaminants                                         Marston                          19,796                2.9
Substances including synthetic and volatile                           Ralston                          10,776                1.5
organic chemicals, which are byproducts
                                                                      Strontia Springs                   7,863               1.1
of industrial processes and petroleum
production, that may come from gas stations,                          Meadow Creek                       5,370               0.8
urban stormwater runoff and septic systems.                           Long Lakes                         1,787               0.3
Radioactive contaminants                                              Platte Canyon                        910               0.1
Substances that can be naturally occurring or
                                                                      Soda Lakes                           645               0.1
be the result of oil and gas production, and
mining activities.                                                    Total                          692,846                100

                                                   2 | 2020 Water Quality Report |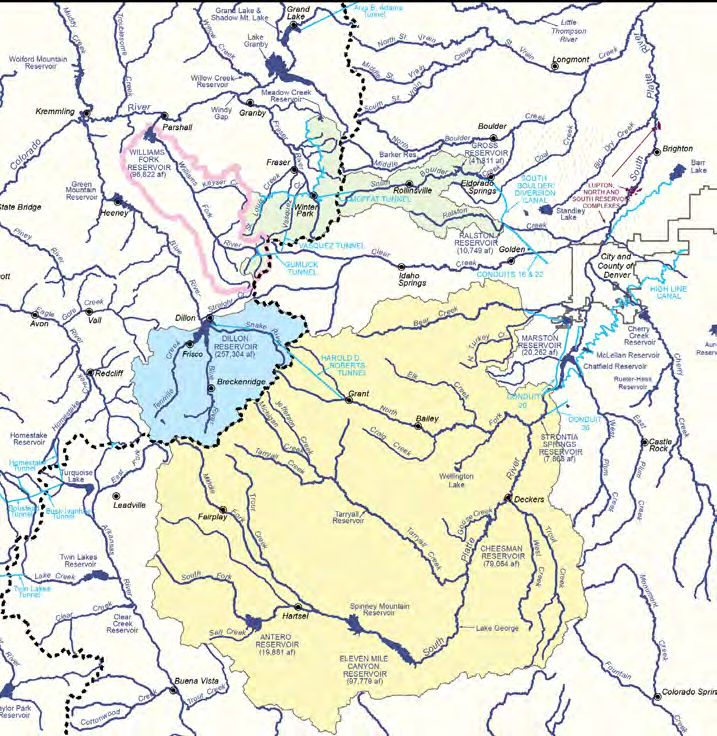
Photo credit: Denver Water.

WATER AT A GLANCE
All drinking water, including bottled        undergone organ transplants, people         lead solder connecting copper pipes
water, may reasonably be expected            with HIV/AIDS or other immune               in their plumbing. Faucets and fixtures
to contain at least small amounts of         system disorders, some elderly and          made before 2014 do not meet today’s
some contaminants. The presence of           infants, can be particularly at risk of     “lead-free” requirements.
contaminants does not necessarily            infections. These people should seek
                                                                                         Lead exposure can cause serious health
indicate that the water poses a health       advice about drinking water from their
                                                                                         problems, especially for pregnant
risk. In order to ensure that tap water is   health care providers. Guidelines from
                                                                                         women and young children.
safe to drink, the Colorado Department       the EPA and the Centers for Disease
of Public Health and Environment’s           Control and Prevention on appropriate       To address this issue, Denver Water has
regulations set limits on the amount of      means to lessen the risk of infection by    launched the Lead Reduction Program,
certain contaminants in water provided       cryptosporidium and other microbial         which was approved in December 2019
by public water systems. The Food            contaminants are available from the Safe    by the EPA and Colorado Department of
and Drug Administration sets limits for      Drinking Water Hotline, 800-426-4791.       Public Health and Environment.
contaminants in bottled water to provide     Lead in drinking water                      The Lead Reduction Program
similar protection for public health.        Denver Water is committed to delivering     has five main components:
More information about contaminants          safe water to our customers. The water      •   Increasing the pH level of the water
and potential health effects can be          we provide to homes and businesses              to reduce the risk of lead from
obtained by calling the EPA’s Safe           is lead-free, but lead can get into the         getting into drinking water from
Drinking Water Hotline at 800-426-4791       water as it moves through customer-             lead service lines or household
or by visiting epa.gov/ground-water-         owned water service lines and household         plumbing. This change is being
and-drinking-water.                          plumbing that contain lead.                     done to reduce the corrosivity of
Some people may be more vulnerable           Service lines bring water into a home           the water, which will help protect
to contaminants in drinking water            or building from Denver Water’s main            customers who have plumbing in
than the general population.                 delivery pipe in the street. In Denver          their home that contains lead, such
Immunocompromised people, such               Water’s experience, homes built prior to        as customer-owned water service
as people with cancer undergoing             1951 are more likely to have lead service       lines that connect their home to
chemotherapy, people who have                lines. Homes built before 1987 may have         Denver Water’s main delivery pipe

                                                 3 | 2020 Water Quality Report |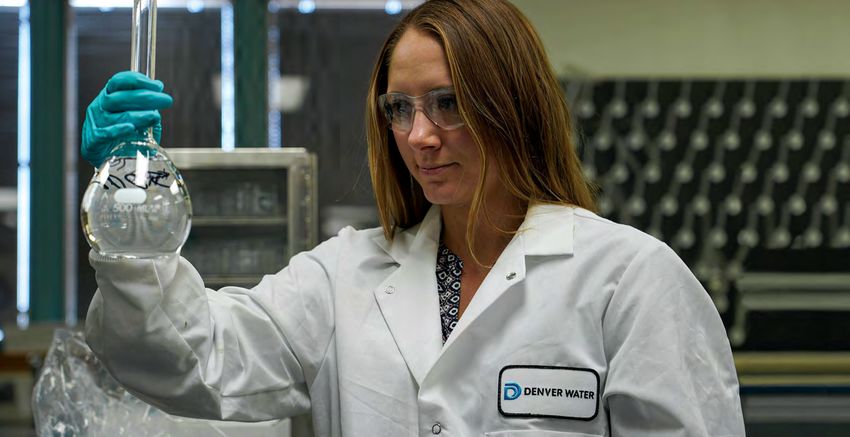
in the street, solder that connects        water treatment to minimize the risk of      testing and steps to minimize exposure
    sections of pipe in their home, and        lead getting into drinking water from        is available from the Safe Drinking
    faucet parts.                              lead pipes and plumbing. Denver Water        Water Hotline at 1-800-426-4791,
                                               studied multiple treatment options from      at epa.gov/safewater/lead and at
•   Developing and maintaining a
                                               2012 to 2017. Based on the results,          denverwater.org/Lead.
    publicly accessible inventory of all
                                               the Colorado Department of Public            Lead may exist in other areas of your
    customer-owned lead service lines
                                               Health and Environment in March 2018         home. For a complete list and more
    in Denver Water’s service area.
                                               required Denver Water to begin adding        information, visit colorado.gov/cdphe/
    This interactive map is available at
                                               orthophosphate to the water it delivers      lead-what-are-common-sources.
    denverwater.org/Lead.
                                               in March 2020.
•   Replacing all lead service lines
                                               Orthophosphate is a food additive
    over 15 years at no direct charge
                                               commonly added to water to minimize          Is there a presence of
    to the customer.
                                               corrosion and reduce the amount of lead      cryptosporidium and giardia?
•   Providing a free water pitcher and         released from pipes and fixtures. It has     Denver Water has tested for
    filters that are certified to remove       been safely and successfully used across     cryptosporidium (crypto) and giardia in
    lead to all customers suspected of         the country. Orthophosphate can impact       both source and treated water since the
    having a lead service line, for use        wastewater treatment plants and the          1980s. Since that time, Denver Water
    until six months after their service       downstream environment.                      has never detected a viable indication of
    line is replaced.                                                                       either in the drinking water.
                                               Denver Water proposed a holistic,
•   Ongoing communication, outreach            alternative approach to orthophosphate       Crypto and giardia are microscopic
    and education.                             that removes lead at its source. The         organisms that, when ingested, can
                                                                                            cause diarrhea, cramps, fever and other
How the program came to be                     approach focuses on replacing all
                                               lead service lines in the service area       gastro-intestinal symptoms. Crypto and
Since 1992, as part of the EPA’s Lead
                                               and avoids the potential impacts of          giardia are usually spread through means
and Copper Rule, Denver Water has
                                               orthophosphate to wastewater treatment       other than drinking water.
monitored water quality in homes that
have lead service lines or plumbing that       plants and downstream reservoirs,            While most people readily recover from
contains lead.                                 streams and rivers.                          the symptoms, crypto and giardia can
                                               That proposal became the Lead                cause more serious illness in people with
In 2012, water quality sample results
                                               Reduction Program, which is                  compromised immune systems. The
from homes with known lead service
                                               now underway. Learn more about               organisms are in many of Colorado’s rivers
lines and plumbing exceeded the level
                                               this effort and the program at               and streams and are a result of animal
the EPA requires for taking action. The
                                               denverwater.org/Lead.                        wastes in the watershed. At the treatment
action level is an indicator that additional
                                                                                            plants, Denver Water removes crypto and
steps may need to be taken to “optimize        If you are concerned about lead, you
                                                                                            giardia through effective filtration, and
corrosion control treatment.” That             can request to have your water tested.
                                                                                            giardia is also killed by disinfection.
means a utility may need to adjust its         Information on lead in drinking water,

    HOW TO MINIMIZE YOUR                                               Filter
                                                                       Use filtered water for drinking (including making
    EXPOSURE TO LEAD                                                   tea and coffee), cooking (particularly when
    Flush                                                              making foods like rice, beans and soup) and
    If water has not been used in the home for a few                   preparing infant formula. Be sure the filter is NSF
    hours, such as first thing in the morning or when                  certified to remove lead. Visit nsf.org for
    getting home from work, run the kitchen or any                     filter options.
    bathroom faucet for five minutes. You also can run                 Maintain
    the dishwasher, take a shower, or do a load of laundry to          Regularly clean your faucet’s screen, also known as
    help flush water in your home’s plumbing before drinking           an aerator. You can find an instructional video at
    or cooking.                                                        denverwater.org/Lead.
    Use only cold water for drinking, cooking and making               Replace filters at the manufacturer’s recommended
    infant formula. Boiling the water does not remove lead.            schedule.

                                                                                                  2020 Water
                                                                                                  2019 Water Quality
                                                                                                             QualityReport
                                                                                                                     Report| | 5
                                                   4 | 2020 Water Quality Report |
WATER QUALITY MONITORING VIOLATION                                                                     THE TREATMENT
Findings from the Colorado Department of Public Health and Environment’s 2019 Sanitary Survey          PROCESS
resulted in notification to Denver Water on Sept. 19, 2019, of two violations of Regulation 11.
                                                                                                       The treatment process consists
What happened?                                                                                         of five steps:

                                                                                                       1
Regarding the first violation, inspectors noted that Denver Water regularly conducts tank
                                                                                                            COAGULATION/
inspections and has some written standard operating procedures regarding its storage
                                                                                                            FLOCCULATION
tank inspections. However, Denver Water's standard operating procedures were not
                                                                                                       Raw water is drawn into mixing
comprehensive enough to meet all the state's requirements for storage tank inspections. The
                                                                                                       basins at our treatment plants
incomplete procedures did not allow Denver Water to successfully and consistently implement
                                                                                                       where we add alum and polymer.
its storage tank inspection plan for all its storage tanks.
                                                                                                       This process causes small
In the second violation, Denver Water was monitoring and reporting the combined filter effluent        particles to stick to one another,
turbidity for the Foothills Water Treatment Plant using a sample line from the treatment plant’s       forming larger particles.
clear well. However, Denver Water should have been reporting the combined filter effluent
turbidity from our monitoring location nearer to the combined filter effluent. Turbidity values at
each of these locations were similar, but this reporting error violates drinking water requirements.
                                                                                                       2    SEDIMENTATION
                                                                                                       Over time, the now larger
How did this impact water quality?                                                                     particles become heavy enough
Denver Water monitors water quality throughout the Denver-metro area 24/7/365, to ensure               to settle to the bottom of a basin
                                                                                                       from which sediment is removed.

                                                                                                       3
the water meets drinking water standards, which verifies that the drinking water system was
not compromised as a result of these violations.
                                                                                                            FILTRATION
What is being done (corrective action)?
                                                                                                       The water is then filtered
Your water is safe to drink, and water quality was never compromised. With regard to the first
                                                                                                       through layers of fine, granulated
violation, Denver Water is updating its storage tank inspection plan this year to reflect the
                                                                                                       materials — either sand, or
recommendations made by the health department. The second violation was corrected in
                                                                                                       sand and coal, depending on
2019 by switching sample sites per health department recommendations.
                                                                                                       the treatment plant. As smaller,
For more information, contact Denver Water Customer Care at 303-893-2444. You can read more            suspended particles are removed,
about our extensive treatment process at denverwaterTAP.org.                                           turbidity diminishes and clear
                                                                                                       water emerges.

                                                                                                       4
Please share this information with all other people who drink this water, especially those
who may not have received this notice directly (for example, people in apartments, nursing
homes, schools and businesses). You can do this by posting this notice in public places or by               DISINFECTION
distributing copies by hand.                                                                           As protection against any
                                                                                                       bacteria, viruses and other
Technical description of violations
                                                                                                       microbes that might remain,
1. F330 — Management:
                                                                                                       disinfectant is added before the
Storage Tank Inspection Plan (T3): Supplier has not developed or maintained a finished water
                                                                                                       water flows into underground
storage tank inspection plan. This is a violation of Regulation 11, Section 11.28(4)(a).
                                                                                                       reservoirs throughout the
At the time of the sanitary survey, the department found that the supplier appears to regularly        distribution system and into
conduct tank inspections and has some written standard operating procedures (SOPs) regarding           your home or business. Denver
its storage tank inspections. However, the supplier’s SOPs are not comprehensive and complete          Water carefully monitors the
to meet all the required elements of the written plan for storage tank inspections as specified        amount of disinfectant added
in Section 11.28(2) of Regulation 11 and to allow the supplier to successfully and consistently        to maintain quality of the water
implement its storage tank inspection plan for all its storage tanks.                                  at the farthest reaches of the
2. R529 — Monitoring, Recordkeeping and Data Verification:                                             system. Fluoride occurs naturally
Monitoring Turbidity (T3): Supplier was not properly monitoring and/or recording turbidity             in our water but is also added to
values. This is a violation of Regulation 11, Section 11.8(1)(2).                                      treated water, when needed, to
                                                                                                       achieve public health levels.
At the time of the sanitary survey, the supplier was monitoring and reporting the combined

                                                                                                       5
filter effluent (CFE) turbidity for the Foothills Water Treatment Plant using a sample line from the
                                                                                                            CORROSION
treatment plant’s clear well. However, the supplier has the ability to monitor CFE turbidity at a
                                                                                                            CONTROL
common header for all individual filter effluents prior to entering the clear well.
                                                                                                       pH is maintained by adding
These violations do not pose a safety risk to customers and do not require consumers to                alkaline substances to reduce
take action, but you have a right to know what happened and what we have done to correct               corrosion in the distribution
this situation.                                                                                        system and the plumbing in your
                                                                                                       home or business.
                                                         5 | 2020 Water Quality Report |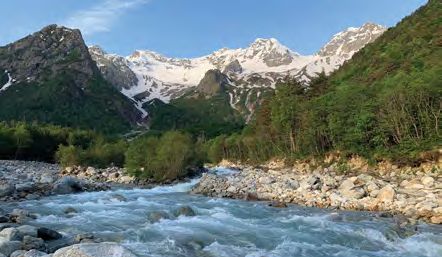
REGULATED WATER CONTAMINANTS: WHAT IS IN THE WATER?
Data collected throughout 2019
Inorganic Contaminants Sampled at the Entry Point to the Distribution System
Chemical Sampling Range Unit of MCL
Year Average MCL MCLG Typical Sources
Parameters Frequency Measure Violation
Discharge from petroleum refineries, fire
Antimony 2019 Monthly BRL BRL ppb 6 6 No
retardants, ceramics, electronics, solder.
Erosion of natural deposits, runoff from
Arsenic 2019 Monthly BRL BRL ppb 10 0 No orchards, runoff from glass and electronics,
solder.
Erosion of natural deposits, discharge of
Barium 2019 Monthly 30.7 16.7-50.0 ppb 2000 2000 No
drilling wastes.
Discharge from metal refineries and coal-
Beryllium 2019 Monthly BRL BRL ppb 4 4 No burning factories; discharge from electrical,
aerospace, and defense industries.
Corrosion of galvanized pipes, erosion
of natural deposits, discharge from metal
Cadmium 2019 Monthly BRL BRL ppb 5 5 No
refineries, runoff from waste batteries
and paints.
Discharge from steel and pulp mills,
Chromium 2019 Monthly BRL BRL ppb 100 100 No
erosion of natural deposits.
Copper 2019 Monthly 0.79 BRL-2.3 ppb 1300 (AL) 1300 No Erosion of natural deposits.
Erosion of natural deposits; discharge
Mercury 2019 Monthly BRL BRL ppb 2 2 No from refineries and factories; runoff from
landfills and croplands.
Discharge from petroleum and metal
Selenium 2019 Monthly BRL BRL ppb 50 50 No refineries; erosion of natural deposits;
discharge from mines.
Erosion of natural deposits; discharge
Thallium 2019 Monthly BRL BRL ppb 2 0.5 No from refineries and factories; runoff from
landfills and croplands.
Uranium 2019 Monthly BRL BRL ppb 30 zero No Erosion of natural deposits, mine drainage.
Erosion of natural deposits, water additive
4.0 (2.0 is
Fluoride 2019 Monthly 0.54 0.13-0.76 ppm 4 No that promotes strong teeth, discharge from
SMCL)
fertilizer and aluminum factories.
Runoff from fertilizer use; leaching
Nitrate as N 2019 Monthly 0.02 BRL-0.13 ppm 10 10 No from septic tanks, sewage; erosion of
natural deposits.
Runoff from fertilizer use; leaching
Nitrite as N 2019 Monthly BRL BRL ppm 1 1 No from septic tanks, sewage; erosion of
natural deposits.
Annually
2,4-D 2019 (Foothills BRL BRL ppb 70 70 No Runoff from herbicide used on row crops.
WTP)
TERMS, ABBREVIATIONS, AND SYMBOLS
Some of the terms, abbreviation and symbols are unique to the water industry and might not be familiar to all customers. Terms used in the table are explained below.
Action Level (AL) Level 1 Assessment Maximum Residual Disinfection Level (MRDL) Picocuries per liter (pCi/L)
The concentration of a contaminant, which A study of the water system to identify potential The highest level of a disinfection allowed in Measure of the radio activity in water.
if exceeded, triggers treatment or other problems and determine (if possible) why drinking water. There is convincing evidence that
Range
requirements that a water system must total coliform bacteria have been found in our addition of a disinfection is necessary for control of
The lowest value to the highest value.
comply with. water system. microbial contaminants
Running Annual Average (RAA)
Average Level 2 Assessment Maximum Residual Disinfection Level Goal (MRDLG)
The average of sample results for samples
Typical Value A very detailed study of the water system to identify The level of a drinking water disinfectant, below which
collected during the most recent four
potential problems and determine (if possible) why there is no known or expected risk to health. MRDLGs
Below Reporting Level (BRL) Below the calendar quarters.
an E. coli MCL violation has occurred and/or why do not reflect the benefits of the use of disinfectants
reportable level for an analysis or below the
total coliform bacteria have been found in our water to control microbial contaminants. Secondary Maximum Contaminant Level (SMCL)
lowest reliable level that can be measured.
system on multiple occasions. Nonenforceable, recommended limits for
Nephelometric Turbidity Unit (NTU)
Compliance Value substances that may affect the taste, odor, color or
Locational Running Annual Average (LRAA) The Measure of the clarity or cloudiness of water.
Single or calculated value used to determine if a other aesthetic qualities of drinking water.
average of sample results for samples collected at Turbidity in excess of 5 NTU is just noticeable to the
regulatory contaminant level is met. Examples
a monitoring location during the most recent four typical person. Treatment Technique
of calculated values are the Average, 90th
calendar quarters. A required process intended to reduce the level of
Percentile, Running Annual Average, Location Non-Health-Based
a contaminant in drinking water.
Running Annual Average. Maximum Contaminant Level (MCL) A violation that is not an MCL or TT.
Maximum level of a contaminant allowed in Variance and Exemptions
Contaminant Not Applicable (N/A)
drinking water. Department permission not to meet an MCL or TT
A potentially harmful biological, chemical, or Does not apply or not available.
under certain conditions.
radiological substance. Maximum Contaminant Level Goal (MCLG) The
Parts per billion = Micrograms per liter (ppb = µg/L)
level of a contaminant in drinking water below which Violation
Formal Enforcement Action Escalated action Equivalent to micrograms per liter. One ppb is
there is no known or expected risk to health. MCLGs Failure to meet a Colorado Primary Drinking
taken by the stat to bring a noncompliant water comparable to one drop of water in 55,000 gallons.
allow for a margin of safety. Water regulation.
system back into compliance.
Parts per million = Milligram per liter (ppm = mg/L)
Water Treatment Plant (WTP)
Health-Based Equivalent to milligrams per liter. One ppm is
Water Treatment Plant
Violation of either an MCL or TT. comparable to one drop of water in 55 gallons.
6 | 2020 Water Quality Report |
Secondary Contaminants Sampled at the Entry Point to the Distribution System*
Chemical Sampling Range Unit of MCL
Year Average MCL MCLG Typical Sources
Parameters Frequency Measure Violation
Erosion of natural deposits, water
Aluminum 2019 Monthly 24.3 10.9-40.4 ppb 50 - 200 (SMCL) N/A No
treatment chemical.
Sodium 2019 Monthly 14.8 5.1-24.7 ppm N/A N/A No Naturally occurring
*Secondary standards are non enforceable guidelines for contaminants that may cause cosmetic effects (such as skin or tooth discoloration) or aesthetic effects (such as taste, odor, or color) in drinking water.
Summary of Turbidity Sampled at the Entry Point to the Distribution System
Chemical Sampling Unit of Treatment Technique Treatment Technique Typical
Year Level Found Measure
Parameters Frequency Requirement Violation Sources
Highest single measurement: 0.135 Maximum 1 NTU for any one
Turbidity 2019 Daily NTU No Soil runoff
NTU (March, Moffat Treatment Plant) single measurement.
Lowest monthly percentage of In any month, at least 95% of
Turbidity 2019 Daily samples meeting TT requirement for NTU samples must be less than No Soil runoff
our technology: 100% 0.3 NTU.
Turbidity has no health effects. However, turbidity can interfere with disinfection and provide a medium for microbial growth. Turbidity may indicate the presence of disease-causing organisms. These
organisms include bacteria, viruses, and parasites that can cause symptoms such as nausea, cramps, diarrhea, and associated headaches.
Total Organic Carbon (Disinfection Byproducts Precursor) Removal Ratio of Raw and Finished Water*
Chemical Treatment Technique
Year Frequency Treatment Technique Requirement Violation Typical Sources
Parameters
**Denver Water uses enhanced treatment to remove
Total organic Twice per Natural organic matter present in
carbon ratio 2019 month
the required amount of natural organic material and/or No
the environment.
demonstrates compliance with alternative criteria.
**Total organic carbon (TOC) has no health effects. However, total organic carbon provides a medium for the formation of disinfection byproducts including trihalomethanes (TTHMs) and haloacetic acids (HAA5s).
Drinking water containing these byproducts in excess of the MCL may lead to adverse health effects, liver or kidney problems, or nervous system effects, and may lead to an increased risk of getting cancer.
Disinfection Byproducts Sampled in the Distribution System
Sampling Highest Range Unit of MCL
Name Year MCL MCLG Typical Sources
Frequency Locational RAA Measure Violation
Byproduct of drinking
Total Trihalomethanes (TTHM) 2019 Monthly 24.6 11.9-33.1 ppb 80 N/A No
water disinfection.
Byproduct of drinking
Haloacetic Acids (HAA5s) 2019 Monthly 15 7.5-22.9 ppb 60 N/A No
water disinfection.
Microbial Contaminants Regulated in the Distribution System
Sampling MCLG Unit of Highest Monthly MCL
Name Year MCL Number of Positives Typical Sources
Frequency Measure Percentage Violation
Total Coliform 2019 Daily No more than 5% Zero Present/ 0.5% (present T. 2 out of 4,524 total No Naturally
(T. coli) positive per month Absent coli), July 2019 samples present in the
(0.04%); 0 E. coli environment.
positive samples
Disinfectants Sampled in the Distribution System*
Number of Samples Frequency Treatment Technique
Name Year Results MRDL Typical Sources
Below Level Violation
Disinfectant 2019 Lowest period percentage 0 Daily No Drinking water
as Total Cl2 of samples above 0.2 ppm: 4.0 ppm disinfectant used to
100% control microbial growth
*Treatment technique requirement: at least 95% of samples per period (month or quarter) must be at least 0.2 ppm
Lead and Copper Sampled in the Distribution System
Contaminant Period 90th Sample Unit of 90th Percentile Sample Sites Above 90th Percentile Typical Sources
Name Percentile Size Measure Action Level Action Limit AL Exceedance
Corrosion of household plumbing; erosion
Copper 1-6/2019 0.31 614 ppm 1.3 2 No
of natural deposits.
Corrosion of household plumbing; erosion
Lead 1-6/2019 10 614 ppb 15 26 No
of natural deposits.
Corrosion of household plumbing; erosion
Copper 7-12/2019 0.25 753 ppm 1.3 1 No
of natural deposits.
Corrosion of household plumbing; erosion
Lead 7-12/2019 11.7 753 ppb 15 48 No
of natural deposits.
7 | 2020 Water Quality Report |TESTING FOR UNREGULATED CONTAMINANTS
Since 1996, the EPA, through its Unregulated Contaminant The American Water Works Association has more information
Monitoring Rule, every five years requires water utilities across about the rule and the process on its website:
the country to test for a list of substances that are suspected of drinktap.org/water-info/whats-in-my-water/unregulated-
being in drinking water but are not currently regulated under contaminant-monitoring-rule-ucmr. Information
the Safe Drinking Water Act. Utilities report their test results to about the rule also can be found on the EPA’s
the EPA, which uses the information to learn more about the website at epa.gov/dwucmr/learn-about-
presence of these substances and decide whether they should unregulated-contaminant-monitoring-rule or
be regulated in the future to protect public health. you can contact the Safe Drinking Water Hotline at
800-426-4791 or water.epa.gov/drink/contact.cfm.
Denver Water’s 2019 test results were reported to the EPA as
required. Below are the substances that were detected during
Denver Water’s tests and the levels at which they were found.
Unregulated Contaminants Monitoring Rule 4
Range Units of
Chemical Parameters Year Sample site Average
measure
Bromochloroacetic acid (BCAA) 2019 Distribution System 2.45 0.75-3.69 ppb
Bromodichloroacetic acid (BDCAA) 2019 Distribution System 1.57 0.74-2.25 ppb
Chlorodibromoacetic acid (CDBAA) 2019 Distribution System 0.33 BRL-0.67 ppb
Tribromoacetic acid (TBAA) 2019 Distribution System BRL BRL ppb
1-butanol 2019 Treatment Plant Treated Water BRL BRL ppb
2-methoxyethanol 2019 Treatment Plant Treated Water BRL BRL ppb
2-propen-1-ol 2019 Treatment Plant Treated Water BRL BRL ppb
a-hexachlorocyclohexane 2019 Treatment Plant Treated Water BRL BRL ppb
Butylated hydroxyanisole 2019 Treatment Plant Treated Water BRL BRL ppb
Chloropyrifos 2019 Treatment Plant Treated Water BRL BRL ppb
Dimenthipin 2019 Treatment Plant Treated Water BRL BRL ppb
Ethoprop 2019 Treatment Plant Treated Water BRL BRL ppb
Germanium 2019 Treatment Plant Treated Water BRL BRL ppb
Manganese 2019 Treatment Plant Treated Water 4.88 BRL-26 ppb
o-toluidine 2019 Treatment Plant Treated Water BRL BRL ppb
Oxyfluorfen 2019 Treatment Plant Treated Water BRL BRL ppb
Profenofos 2019 Treatment Plant Treated Water BRL BRL ppb
Quinoline 2019 Treatment Plant Treated Water BRL BRL ppb
Tebuconazole 2019 Treatment Plant Treated Water BRL BRL ppb
Total permethrin (cis- & trans-) 2019 Treatment Plant Treated Water BRL BRL ppb
Tribufos 2019 Treatment Plant Treated Water BRL BRL ppb
Treatment Plant Source Water (raw
Bromide 2019 BRL BRL-0.05 ppm
water)
Treatment Plant Source Water (raw
Total Organic Carbon (TOC) 2019 2.98 2.13-4.6 ppm
water)
8 | 2020 Water Quality Report |Photo credit: iStock.
1600 W. 12th Ave., Denver, CO 80204-3412
                                                                               303-893-2444

                                                         For more information on water quality,
                        including opportunities for public participation, visit denverwater.org.

                                                                         @DenverWater                 @Denver_Water
                                          DenverWater        YourDenverWater                     denverwaterTAP.org
                                                             Denver Water’s Public Water System Identification: CO0116001

Photo credit: iStock.
You can also read