Assessment of electrical and infrastructure recovery in Puerto Rico following hurricane Maria using a multisource time series of satellite imagery
←
→
Page content transcription
If your browser does not render page correctly, please read the page content below
Assessment of electrical and infrastructure recovery in Puerto Rico
  following hurricane Maria using a multisource time series of satellite
                                 imagery
                                           Jacob Shermeyer*a
                aIn-Q-Tel,   CosmiQ Works, 2107 Wilson Blvd, Arlington, VA, USA 22003

                                                     ABSTRACT

Puerto Rico suffered severe damage from the category 5 hurricane (Maria) in September 2017. Total monetary damages
are estimated to be ~92 billion USD, the third most costly tropical cyclone in US history. The response to this damage
has been tempered and slow moving, with recent estimates placing 45% of the population without power three months
after the storm. Consequently, we developed a unique data-fusion mapping approach called the Urban Development
Index (UDI) and new open source tool, Comet Time Series (CometTS), to analyze the recovery of electricity and
infrastructure in Puerto Rico. Our approach incorporates a combination of time series visualizations and change
detection mapping to create depictions of power or infrastructure loss. It also provides a unique independent assessment
of areas that are still struggling to recover. For this workflow, our time series approach combines nighttime imagery from
the Suomi National Polar-orbiting Partnership Visible Infrared Imaging Radiometer Suite (NPP VIIRS), multispectral
imagery from two Landsat satellites, US Census data, and crowd-sourced building footprint labels. Based upon our
approach we can identify and evaluate: 1) the recovery of electrical power compared to pre-storm levels, 2) the location
of potentially damaged infrastructure that has yet to recover from the storm, and 3) the number of persons without power
over time. As of May 31, 2018, declined levels of observed brightness across the island indicate that 13.9% +/- ~5.6%
of persons still lack power and/or that 13.2% +/- ~5.3% of infrastructure has been lost. In comparison, the Puerto Rico
Electric Power Authority states that less than 1% of their customers still are without power.
Keywords: Electrification, Time Series, Hurricane, Infrastructure, Recovery, Puerto Rico

                                                 INTRODUCTION
The tropical cyclone Hurricane Maria developed on September 16, 2017 in the Atlantic Ocean to the northeast of South
America. The storm hit warm coastal waters and intensified rapidly, moving from a category 1 to a category 5 Hurricane
according to the Saffir–Simpson hurricane wind scale (SSHWS) in less than 24 hours1. Maria subsequently moved in a
northwesterly direction, making landfall in Dominica on September 19, and then eventually southeastern Puerto Rico, a
territory of the United States, on September 20, 2017 with wind speeds of 155 miles per hour (Figure 1). After passing
Puerto Rico, the storm moved north of Hispaniola, up the eastern coast of the mainland United States and then out to sea.
Damage to Puerto Rico was severe and widespread following the Hurricane, with heavy rainfall, flooding, storm surge,
and high winds causing considerable damage. The power grid was mostly destroyed, causing a power outage for the
entire population2. Electrical recovery for many locations has taken months, with estimates placing 45% of the
population without power three full months after the storm2. Additionally, 95% of the cellular network, 85% of phone
and Internet service was knocked offline2. Up to 50% of the population had no access to clean drinking water2. Total
monetary damages are estimated to be ~92 billion USD, the third most costly tropical cyclone in US history since 19003.
Fatalities as a consequence of Maria are still under investigation, however the most recent estimates suggest between
793 to 8,498 excess deaths occurred following the storm4.
Estimating the amount of damage through remote sensing techniques is cost effective and enables an alternative and
independent assessment of the effects of the hurricane. Our method incorporates two kinds of remote sensing data:
Suomi National Polar-orbiting Partnership Visible Infrared Imaging Radiometer Suite (NPP VIIRS) nighttime lights
imagery as well as multispectral Landsat imagery. Several previous methods have used nighttime lights imagery to
extract built up areas, assess power outages after storms, monitor economic output, and track population migrations. For
example, Shi et al. (2014)5, evaluated the effectiveness of NPP VIIRS and the Defense Meteorological Satellite
Program’s Operational Linescan System (DMSP/OLS) satellite to extract built-up areas in twelve cities in China via
simple thresholding with an average overall accuracy of 89.58%. Cao et al. (2013)6 used a NPP VIIRS nighttime lights

*jshermeyer@iqt.org; phone 1 571 775-0328; cosmiqworks.org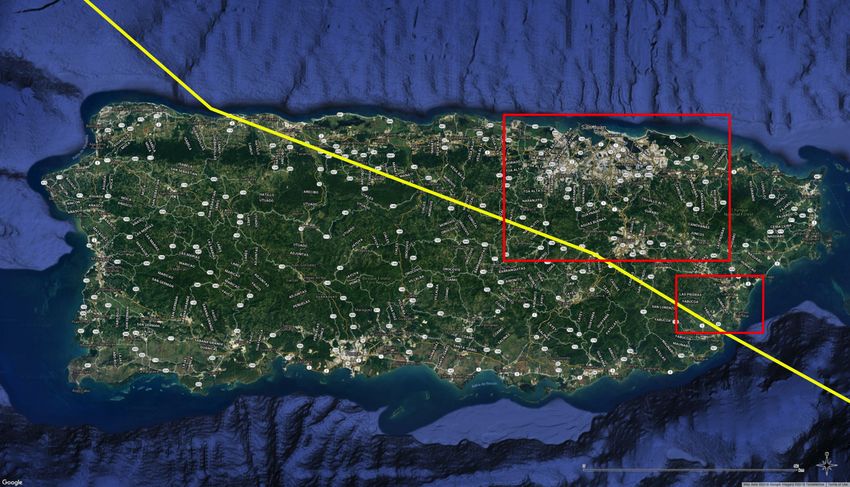
time series to detect power outages after the June 2012 Washington DC derecho storm and October 2012 Hurricane
Sandy event. This analysis was able to reliably identify areas and quantify the amount of significant power loss
following each of these events for specific regions of interest. Li et al. (2013)7, found a strong linear correlation (R2
value of ~0.87 for all provinces) between VIIRS nighttime brightness and the economic index gross regional product in
China. Gao et al. (2016)8 quantified the amount of urban sprawl seen across China using a combination of DMSP and
census data. Finally, Bharti et al. (2011)9 quantify seasonal migrations and the linkages to the spread of measles in three
cities in Niger using DMSP data.

         !
Figure 1. Map of the path of Hurricane Maria (yellow line), which moved from southeast to northwest and made landfall on
September 20, 2017, and our two primary areas of interest that we investigate using time series visualizations in the results
section (red boxes).

Landsat and multispectral imagery has been used to effectively map urbanization and impervious surface in hundreds of
previous studies10–23. Typically, these studies follow a few direct paths to success, with most including some sort of
machine learning classification approach, or the creation and application of an urban index from multiple spectral bands
to derive urban land-cover. These methods are tried and true, and have been the backbone for the majority of modern
land-cover remote sensing approaches. This paper takes a similar approach, and utilizes multispectral Landsat imagery
to train a k-nearest neighbor (k-nn) classifier and derive new impervious surface maps. Although this machine learning
approach is not a new technique, it does have unique aspects. Chiefly, this includes a transfer learning approach that
leverages the most recent existing impervious surface map from 200110 to extract spectral signatures, and transfer them
to create updated cloud free impervious surface maps from before Maria (January 2016-August 2017), and after Maria
(September 2017-May 2018) for 98.9% of Puerto Rico.
Furthermore, this study combines these impervious surface maps with cloud and anomaly masked monthly composite
NPP VIIRS nighttime lights imagery to remove misclassifications, enhance densely developed areas, and create time
series visualizations at 30 meter resolution of urban development for the island. Additionally, VIIRS nighttime imagery
alone was used to estimate brightness trends over time in all census tracts, and quantify the percentage difference in
expected brightness from the observed brightness after the storm. These trends and differences are used to estimate the
percentage of population without power, to estimate the amount of infrastructure lost, and to identify areas that are still
struggling to recover. Although previous researchers have evaluated changes following storms, no studies have
combined nightlights, multi-spectral imagery, census data, and building footprint labels to paint a holistic picture of the
consequences of a storm. Overall, this research strives to address and evaluate the recovery of Puerto Rico over time
from September 2017-May 2018.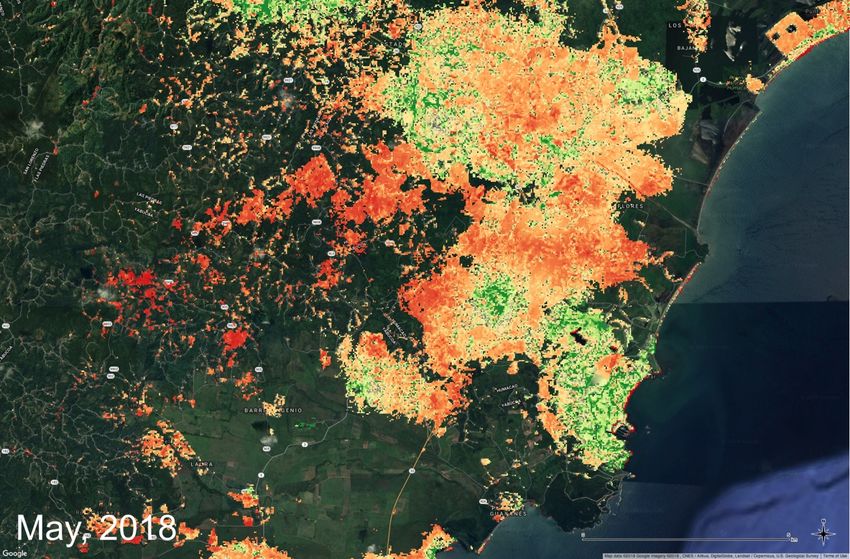
METHODS AND DATA
The methods and data are described throughout the following section. Generally, the methods fall under two categories:
1) We define a new quantity to measure impervious surface coverage, the Urban Development Index (UDI) and change
map products (Figure 2), and 2) the evaluation of VIIRS nighttime brightness trends over time, and a comparison to US
census tract population data24 and Humanitarian OpenStreetMap (HOTOSM) building footprint labels25 to estimate the
number of persons without power or infrastructure loss.

1.   Creation of the Urban Development Index
We created the Urban Development Index to evaluate and improve the quality of the maps that depict urban and
suburban areas in Puerto Rico. The idea of the index is to combine an impervious surface map derived from Landsat
imagery and monthly cloud free composites that depict nighttime brightness derived from NPP VIIRS data to validate
one another and create a robust urban index. For example, the impervious surface maps that were created have false
positives for impervious areas over highly reflective farmland. Conversely, VIIRS nighttime brightness mosaics suffer
from light pollution in non-developed areas such as coastal waters and grassy areas. By multiplying these two images
together, we can remove the false positives while quantifying the degree of development from densely urban to rural.
Additionally, the finer spatial resolution of the impervious surface map helps to sharpen the VIIRS imagery to a 30m
shared spatial resolution.
The impervious surface maps generated from the process described in section 2.2 depict impervious surface on a 1-10
scale with one being the least impervious (0-10%) and 10 being the greatest (90-100%) (!i). VIIRS monthly cloud free
composite data are described in section 2.3 and depict nighttime brightness radiance in Watts/cm2. The units on these
data range from no brightness (0) to very bright (>100) (!B. Each VIIRS monthly cloud free composite image and the
impervious surface map are multiplied together to produce the Urban Development Index that depicts urban
development on a scale that roughly spans from 0-1000 (Equation 1). The UDI is calculated for each month from April
2017 to May 2018 to track changes over time and estimate true and percentage changes to the UDI.

                                                  U
                                                  ! DI = i x B      (1)

2.   Landsat Data Description and Creation of Impervious Surface Maps
Two Worldwide Reference System 2 (WRS-2) path/rows (5/47 and 4/47) of Landsat imagery were identified to cover the
majority (98.9%) of Puerto Rico and its’ major metropolitan areas. All scenes were atmospherically corrected to surface
reflectance using the Landsat Ecosystem Disturbance Adaptive Processing System (LEDAPS) or Landsat 8 Surface
Reflectance (L8SR) system26,27. Atmospheric correction is required to standardize the images for the full time series and
to ensure that using imagery from two different Landsat satellites does not compromise our results. All images were
referenced in UTM coordinates and areas identified as medium to high confidence cloud or cloud shadow were masked
out using the pixel QA layer. Each Landsat image in the time series includes only the Blue, Green, Red, Near Infrared
(NIR), and both Shortwave Infrared (SWIR) bands.

Imagery was collected for two periods ranging from 2000-2002 and 2016-2018. The 2000-2002 time series included
only Landsat 7 Enhanced Thematic Mapper+ (ETM+) imagery, as no Landsat 5 Thematic Mapper (TM) data were
available. The 2016-2018 time series included only Landsat 8 Optical Land Image (OLI) data as the combination of
cloud cover and scan line errors present in post-2003 Landsat 7 imagery available for Puerto Rico ultimately produced
poor results. The 2000-2002 time series corresponds with the most recently created impervious surface map for Puerto
Rico. This map depicts the percentage of impervious surface for the entire island for the year 200110.

The percentage of impervious surface is correlated to the amount of urban development and total population10,16. A
transfer learning approach similar to the one described in Shermeyer and Haack (2015)28 was devised to leverage the
existing impervious surface map, and to create two updated impervious surface maps: pre-storm (January 2016 - August
2017), and post-storm from (September 2017 - May 2018).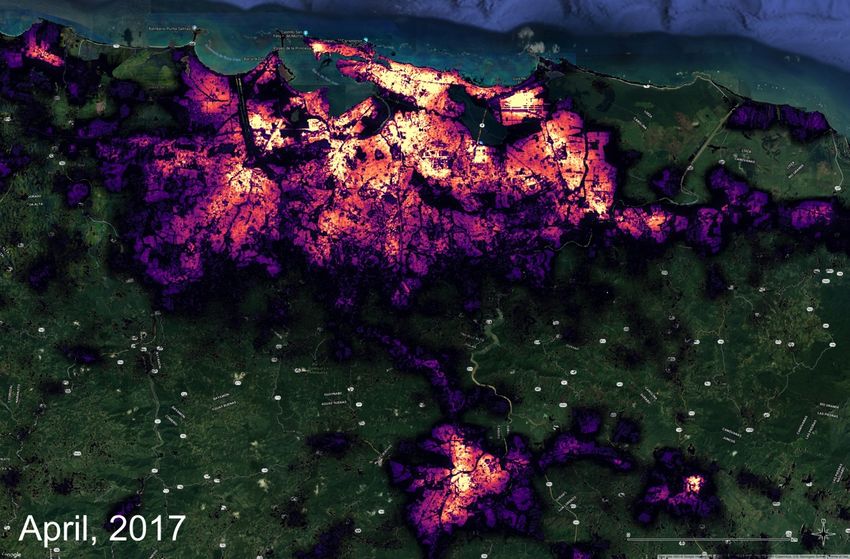
First, the existing 0-100 percent impervious surface map from 2001 is segmented by increments of ten to generate ten
distinct impervious surface classes. This simplifies the map and enables our classifier to more easily classify areas from
little to highly impervious. This reclassified map is then used to extract spectral signatures from each of the cloud-
masked Landsat images in the 2000-2002 time series. The average spectral response for every Landsat pixel that
intersected with each of the ten impervious percentage classes is extracted and stored for each image. For each path/row
an average spectral signature for each band is calculated as an aggregate of each image in the time series.

A k-nn classifier was then trained on these signatures and applied to each image in the pre-storm time series and the
post-storm time series. The k-nn classifier was chosen primarily for its ease of implementation, for its exhibition of high
accuracies in previous land cover mapping studies28–30, and for its fast training and inference time (under one minute for
each (64GB RAM CPU)). The value of k was set equal to one and the Euclidian distance metric with an equal neighbor-
weighting scheme was chosen for this study. No fine-tuning of hyper-parameters was performed; instead relying on the
strength of previous research that showed these parameters produced high accuracies for land-cover mapping28–30. It
should be noted that tuning these parameters might have slightly increased the accuracy, precision, and recall of the final
output maps. After each image in the pre and post-storm time series was classified into an impervious surface map,
these maps were then aggregated together via averaging to create two cloud-free composite pre and post-storm
impervious maps. Each map serves as an input into the pre and post storm urban development index change product.

3.   NPP VIIRS Data Description
Monthly composites of NPP VIIRS day/night band (DNB) imagery were chosen as the primary nighttime imagery input
for this workflow. VIIRS monthly composites are cloud masked and filtered to exclude areas that are affected by stray
light, lightning, and lunar illumination31,32. The masked daily images are then averaged together for each month to
create these composite products and have a nominal spatial resolution of ~450 m over Puerto Rico when using the UTM
Zone 20N projection. These data presently span from April 2012 - May 2018, and any analysis was conducted over this
period or portions of it. The data are distributed with two images, the first depicts nighttime brightness in floating point
radiance values with units in Watts/cm2, and the second depicts the number of observations acquired for this month.
Areas with zero observations for a month due to cloud cover or other anomalies are masked out. The full 2012 - 2018
time series of imagery was used for evaluations in change of brightness over time and to evaluate changes to brightness
following hurricane Maria. Individual monthly images for the months following Maria (September 2017 - April 2018)
were used to create new UDI maps for each month to evaluate the location and speed of recovery.
!
Figure 2. Flow chart of the Urban Development Index workflow. Inputs are colored in purple, actions in gray, and outputs in
orange.

4.   Electrical and Infrastructure Recovery Analysis
Comet Time Series (CometTS) was developed to facilitate analysis, extract relevant statistics, and enable visualization
for a time series of satellite imagery in any user defined area of interest33. This tool has previously been used to estimate
changes in population based upon changes in brightness to nighttime lights in Africa and Europe34. For this study, the
tool was used to extract the change in average nighttime brightness for all census tracts within Puerto Rico and to infer
electrical recovery and infrastructure loss. The tool uses a zonal statistics approach to extract various statistics on
brightness within each census tract.

An autoregressive integrated moving average (ARIMA)35 time series trend analysis was then conducted on the output of
the tool for each census tract. A 5-month centered moving average (CMA) is calculated for each month in the time
series from April 2012-August 2017. Irregularities from the smoothed CMA and the average monthly trends are
calculated. These components are combined with the smooth CMA and a linear regression to create a seasonal forecast
trend line for September 2017-May 2018. This trend line is used to determine where brightness is expected to be if the
hurricane had not hit. The difference between the actual observed brightness and the forecast brightness are used to
quantify electrical and infrastructure deficiencies and recovery. The mean absolute deviation or error from the seasonal
trend line is also calculated to quantify what the expected range in error should be and to determine if the difference
between the actual brightness and the projected brightness is significant. Finally this trend analysis is compared against
2016 census population estimates24 to approximate the number of persons without power and against the HOTOSM
building footprint25 counts by census tract to approximate the percentage of buildings lost.

                                           RESULTS AND DISCUSSION

5.   Urban Development Index Visualizations
An analysis of the urban development index depicts a precipitous drop off in UDI following Hurricane Maria, which
made landfall in Puerto Rico on September 20 2017. A 264 point stratified random sample was created and visually
interpreted with high-resolution imagery to test the accuracy of the UDI. Results indicate the index can effectively
identify urban development with an accuracy of 90.9%. Unsurprisingly, smaller rural buildings and less densely
developed areas are harder to map than highly developed areas. The San Juan metropolitan area and Caguas were
chosen for this visualization as they represent the highest density urban development, with ~46% of the population living
in these areas24. Additionally, these cities are quite representative of the rest of the island, which experienced similar
damage, particularly in the central and eastern regions. Changes in UDI for San Juan and Caguas are depicted in videos
1 and 2 in this section. Video 1 depicts the effects of this storm and the changes to the UDI over time; video 2 depicts the
differencing of a March-August 2017 average composite UDI from September 2017- May 2018 monthly UDIs. As the
storm hit late in the month of September, only a small change can initially be seen in the September visualization.
However, in October, the largest drop occurs. During this month, national estimates place 100% of the population
without power2. Power and infrastructure gradually begin to recover, but are still not fully recovered by May 2018.
Pocketed communities across the city have a much lower UDI, indicating a loss of power or infrastructure. A few select
areas are brighter, mostly including the airport, ports, and a few select parks and open green spaces.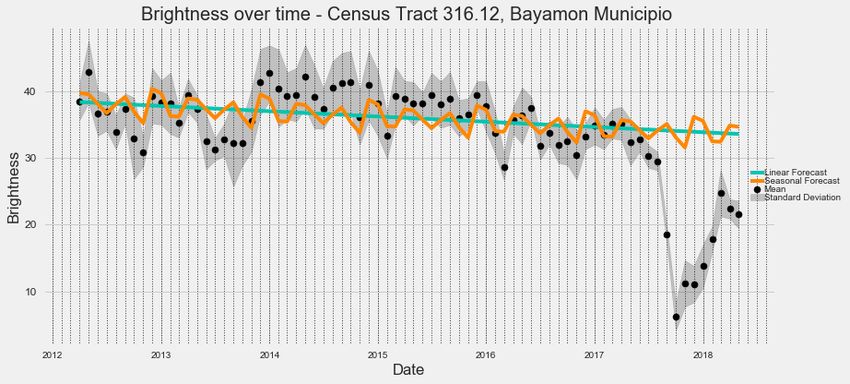
!                   !
    Video 1. This video depicts a visualization of change in the Urban Development Index from April 2017 - May 2018 for San
    Juan and Caguas, Puerto Rico. Areas that have a UDI value of zero are made transparent. All visualizations are overlaid on
    high-resolution imagery supplied via Google. Play Video

!               !
    Video 2. This video depicts a visualization of changes over time for via subtracting a pre-storm composite UDI from
    monthly UDIs for San Juan and Caguas, Puerto Rico. Areas that have a UDI change value of zero are made transparent. All
    visualizations are overlaid on high-resolution imagery supplied via Google. Play Video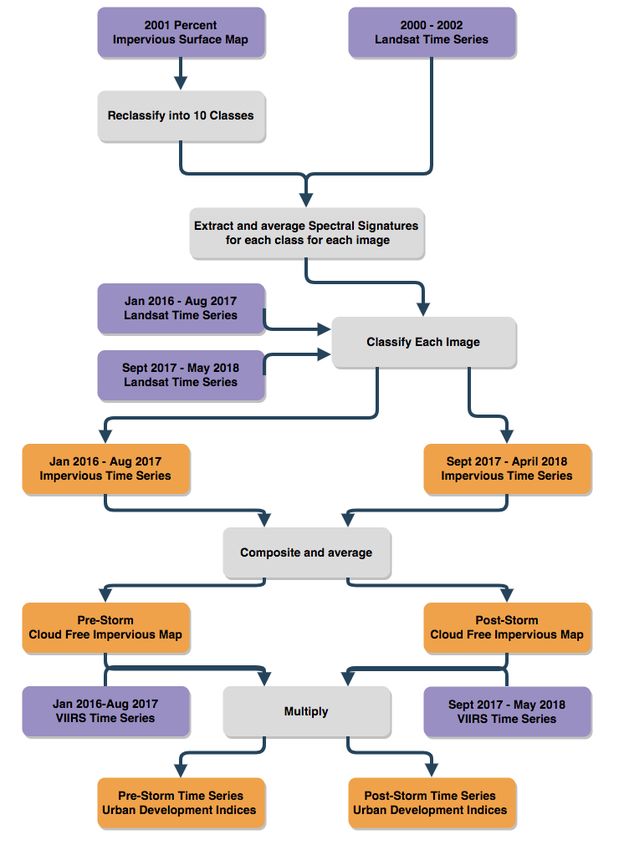
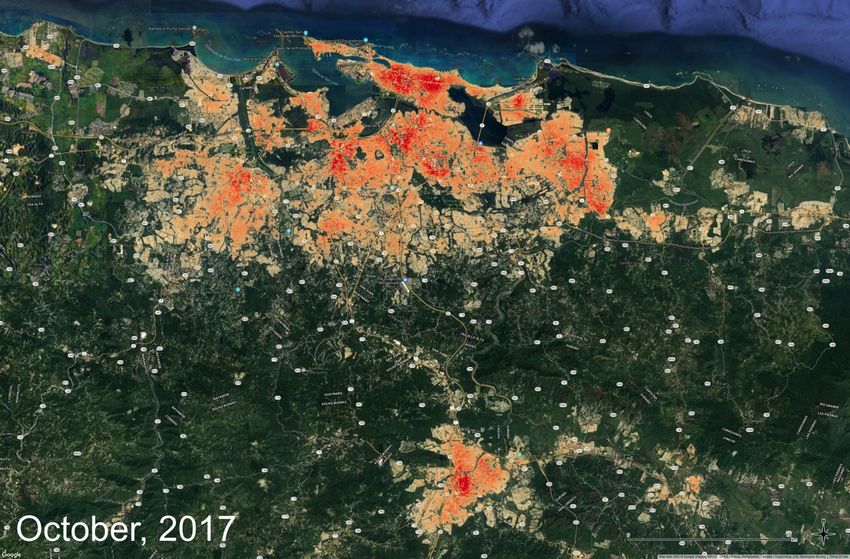
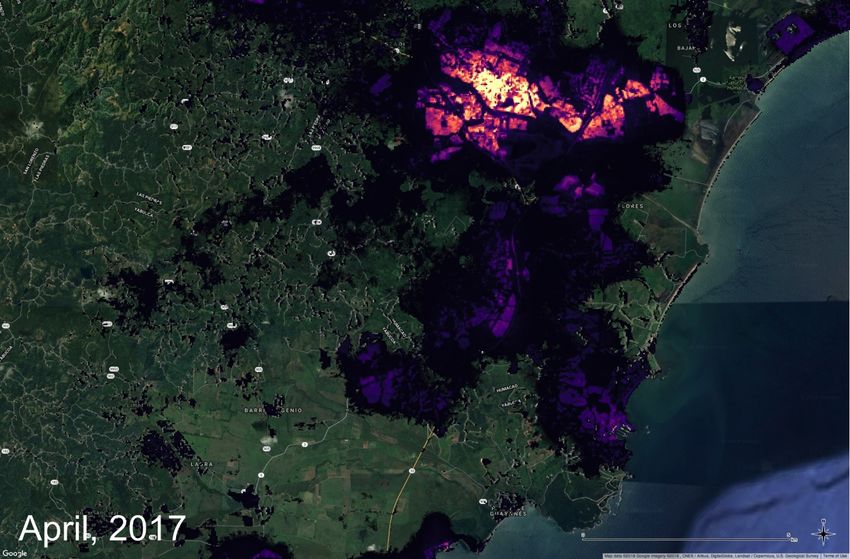
The southeastern portion of the island, the city of Humacao, and surrounding rural communities were also chosen for
investigation, as this was one of the most severely affected regions. Changes in UDI are depicted in videos 3 and 4 in
this section. Video 3 depicts the effects of this storm and the changes to UDI over time; video 4 depicts the percentage
change from March-August 2017 versus the current month. Again, changes in October were the greatest with power and
infrastructure gradually recovering thereafter. As of May 2018, the rural communities in the western-most forested
region still do not have power, and/or the buildings here have been destroyed. Most of the region remains darker as well
with the exception of coastal resorts in the southeast, the industrial park to the northwest, and the university in the
western portion of Humacao. These areas are likely the first to repaired, and ultimately recover, with some nighttime
construction increasing brightness.

!              !
    Video 3. This video depicts a visualization of change in the Urban Development Index from April 2017 - May2018 for
    Humacao, Puerto Rico and the surrounding rural communities. Areas that have a UDI value of zero are made transparent.
    All visualizations are overlaid on high-resolution imagery supplied via Google. Play Video
! !
Video 4. This video depicts a visualization of the percent difference of monthly UDIs versus a pre-storm composite UDI for
Humacao, Puerto Rico and the surrounding rural communities. Areas that have a UDI change value of zero are made
transparent. All visualizations are overlaid on high-resolution imagery supplied via Google. Play Video
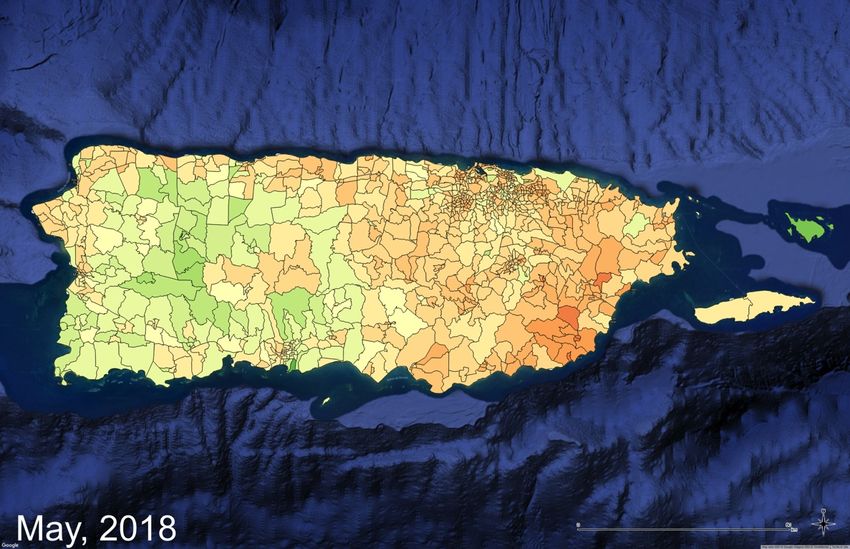
6. Full Time Series Evaluation by Census Tract
The percentage difference between projected VIIRS brightness and observed VIIRS brightness for each census tract are
shown for all of Puerto Rico from April 2017 to May 2018 (Video 5). This analysis shows that observed versus expected
brightness levels were generally in agreement before the storm, with some tracts being slightly brighter than expected
(April-August 2017). A mild drop off brightness follows in September 2017, followed by a rapid drop off in October
2017. The mild September drop off is due to the nature of the monthly composite VIIRS imagery. Only a few
observations are available after the storm hits (September 20th), and are equally weighted against pre-storm observations.
Consequently, in October we begin to see the full magnitude of the impacts of Maria with the majority of the island,
particularly in the east, showing a decline in observed versus projected brightness of 50% or greater. Power restoration
begins to show in November and December 2017 with parts of San Juan coming back online, and the western coastal
census tracts recovering first. More stability can be witnessed returning in January and February of 2018, with the
exception of the southeast and interior rural areas of the island. Finally, through March, April, and May we can see a
return to normalcy for most of the western portion of the island. The eastern portion still falls short of the forecast
brightness with the majority of the tracts falling between 10 to 30% short of projection.! !
Video 5. This video depicts a visualization of the percentage difference between observed brightness and the ARIMA
derived seasonal trend line and forecast from April 2017 – May 2018 for all census tracts in Puerto Rico. All visualizations
are overlaid on high-resolution imagery supplied via Google. Play Video
Time series visualizations were also created for all tracts. Figures 3 and 4 depict two tracts that suffered severe damage,
and have fallen far short of recovery. These figures show what the map (Video 5) is visualizing in plot format. The
black points are the mean observed VIIRS brightness levels, the gray bounding area is one standard deviation of
brightness within that tract, the orange trend line is the ARIMA based forecast that depicts the expected brightness if
Maria had not hit, and finally the teal line represents a liner regression forecast. Tract 9509 in Yabucoa is located in the
southeastern portion of the island, it is one of the first locations the storm made landfall. Its’ recovery is also visualized
in videos 3 and 4. Tract 316.12 is in the Bayamon Municipio, located in the western portion of San Juan and seen in
videos 1 and 2. Both of these visualizations show tracts that still have only marginally recovered to expected brightness
levels. This is a result of either a lack of power restoration, the loss of infrastructure, and/or the loss of population.! Figure 3. A visualization of mean and one standard deviation of brightness over time in Census Tract 9509, in Yabucoa Municipio. The linear regression forecast and seasonal adjusted forecast are plotted in teal and orange respectively. ! Figure 4. A visualization of mean and one standard deviation of brightness over time in Census Tract 316.12, in Bayamon Municipio. The linear regression forecast and seasonal adjusted forecast are plotted in teal and orange respectively. 7. Estimates of Electrical and Infrastructures Loss An estimate of the number of persons that could potentially still lack power was also conducted (Figure 5). By estimating the percentage short of the ARIMA seasonal forecast trend line and multiplying that value by the census tract population estimate24, we can quantify how many persons likely were or still are without power. In this figure, the VIIRS based estimate of persons without power is plotted in black with the mean absolute deviation from our ARIMA trend analysis from before the storm visualized in gray. The red line is the PREPA estimate for the number of customers without power2,36. Customers are likely not an absolute identifier for the number of persons without power, but they are correlated.
!
Figure 5. A visualization of the estimated persons without power across all of Puerto Rico. PREPA estimates2,36 are in red, and
VIIRS derived estimates are in black. Any gaps between PREPA estimates are interpolated. The mean absolute deviation from
the ARIMA derived seasonal trend line before the storm is visualized in gray.

The main conclusion is that there is generally strong agreement between the VIIRS based estimates and PREPA
estimates with a few clear exceptions, particularly from April to May 2018. The VIIRS estimates for the number of
persons without power are slightly lower than the PREPA estimates for the beginning of October, again, likely because
of the lack of cloud free observations during this period, artificially increased brightness because of nighttime repair
activities, or an overestimation by PREPA of the number of persons without power. PREPA estimates and the VIIRS
derived estimates then track closely to one another through November 2017 to mid-March 2018. In April, two sudden
massive outages occurred, the first from a falling tree and the second due to a bulldozer backing into a power line37.
Repairs were made quickly and power was restored within roughly 24 hours following these events. However, this
highlights the fragility of the current grid, with two minor events causing nearly the entire island to lose power. As this
workflow used VIIRS monthly composites, these single day outages are weighted against the average brightness for the
rest of the month, meaning only a small increase in estimated the percentage of persons without power for April versus
March and May of 2018. Ultimately, estimates between the VIIRS analysis and PREPA begin to diverge in April and
May of 2018. By the end of May 2018, the PREPA estimates the total number without power to be less than 1%36.
However, the VIIRS based analysis estimates that 13.9% +/- ~5.6% remain without power on the island. A comparative
analysis versus HOTOSM building footprint counts by census tract indicates that 13.2% +/- ~5.3% of infrastructure may
have been lost.
There are several conclusions that can be drawn from this analysis. The first is that the PREPA appears to be
underestimating the number of persons that still do not have access to electricity. Ultimately, it is likely difficult for the
PREPA to quantify the number of customers that have power, particularly in the rural areas in the southeast and central
parts of Puerto Rico. The number of customers without power and the number of persons without power are similar but
are not exact correlates. Although power grids may be 99% repaired, a large amount of destroyed infrastructure is still
not receiving power, certainly leaving many persons still in the dark. The difference between the population and
building analyses (0.69%) closely aligns with PREPA estimates of those without power (0.78%). Regardless, if the
infrastructure has been destroyed, it is not receiving power; we can conclude that approximately 13% of residents still
likely lack electricity. Another conclusion is that the decline in brightness is caused by a population decline and large
emigration of persons out of Puerto Rico. The emigration of the population out of Puerto Rico has been shown to be
aggressive. Melendez and Hinojosa (2017)38 estimate that up to 14% of the population will leave by December 2019,
primarily as a result of Maria. The government of Puerto Rico estimates that 200,000 will have left by the end of 2018,
approximately 6% of the population. As of May 2018, this likely means a loss of 2-5% of the population. This mass
emigration certainly will cause some level of decline in power consumption, and brightness as a corollary. Overall, the
most likely outcome is a combination of these conclusions; however, we can safely state that the observed decline in
brightness does not agree with PREPA estimates of the amount of persons or buildings receiving and/or using power.

                                                   CONCLUSION
The aftermath of Hurricane Maria is still being felt across Puerto Rico at large. Our independent assessment relied on a
fusion of remote sensing data, population estimates, and building footprint labels to quantify the number of persons
without electricity and the amount of infrastructure lost. This research leveraged a new tool called CometTS to facilitate
analysis, extract relevant statistics in census tracts, and enable visualization of a time series of NPP VIIRS nighttime
lights imagery. Our findings showed that as of May 31, 2018, declines in brightness levels across the island indicate that
13.9% +/- ~5.6% of persons still lack power and/or that 13.2% +/- ~5.3% of infrastructure has been lost. The PREPA
states that less than 1% of their customers still are without power, which appears to be a substantial underestimation
based upon our findings. Other factors such as a mass emigration of persons out of Puerto Rico and an ongoing
economic downturn are also contributing to the decline in brightness across the island. Comprehensively, time series
visualizations and maps show several areas that are not receiving electricity and a large amount of unrepaired
infrastructure damage in both urban and rural communities.

                                                   REFERENCES
[1]    Richard J. Pasch, Andrew B. Penny and Robbie Berg., “National Hurricane Center Tropical Cyclone Report:
       Hurricane Maria,” TROPICAL CYCLONE REPORT AL152017, National Oceanic And Atmospheric
       Administration and the National Weather Service, 1–48 (2018).
[2]    “Hurricanes Nate, Maria, Irma, and Harvey Situation Reports.”, Situation Report, United States Department of
       Energy, Infrastructure Security and Energy Restoration (2017).
[3]    National Hurricane Center., “Costliest U.S. tropical cyclones tables updated,” National Hurricane Center, National
       Oceanic And Atmospheric Administration (2018).
[4]    Kishore, N., Marqués, D., Mahmud, A., Kiang, M. V., Rodriguez, I., Fuller, A., Ebner, P., Sorensen, C., Racy, F.,
       Lemery, J., Maas, L., Leaning, J., Irizarry, R. A., Balsari, S. and Buckee, C. O., “Mortality in Puerto Rico after
       Hurricane Maria,” N. Engl. J. Med. Special Article (2018).
[5]    Shi, K., Huang, C., Yu, B., Yin, B., Huang, Y. and Wu, J., “Evaluation of NPP-VIIRS night-time light composite
       data for extracting built-up urban areas,” Remote Sens. Lett. 5(4), 358–366 (2014).
[6]    Cao, C., Shao, X. and Uprety, S., “Detecting Light Outages After Severe Storms Using the S-NPP/VIIRS Day/
       Night Band Radiances,” IEEE Geosci. Remote Sens. Lett. 10(6), 1582–1586 (2013).
[7]    Li, X., Xu, H., Chen, X. and Li, C., “Potential of NPP-VIIRS Nighttime Light Imagery for Modeling the Regional
       Economy of China,” Remote Sens. 5(6), 3057–3081 (2013).
[8]    Gao, B., Huang, Q., He, C., Sun, Z. and Zhang, D., “How does sprawl differ across cities in China? A multi-scale
       investigation using nighttime light and census data,” Landsc. Urban Plan. 148, 89–98 (2016).
[9]    Bharti, N., Tatem, A. J., Ferrari, M. J., Grais, R. F., Djibo, A. and Grenfell, B. T., “Explaining Seasonal
       Fluctuations of Measles in Niger Using Nighttime Lights Imagery,” Science 334(6061), 1424–1427 (2011).
[10]   Homer, C., Dewitz, J., Fry, J., Coan, M., Hossain, N., Larson, C., Herold, N., McKerrow, A., VanDriel, J. N. and
       Wickham, J., “Completion of the 2001 national land cover database for the counterminous United States,”
       Photogramm. Eng. Remote Sens. 73(4), 337 (2007).
[11]   Lu, D., Moran, E. and Hetrick, S., “Detection of impervious surface change with multitemporal Landsat images in
       an urban-rural frontier,” ISPRS J. Photogramm. Remote Sens. Off. Publ. Int. Soc. Photogramm. Remote Sens.
       ISPRS 66(3), 298–306 (2011).
[12]   Li, H., Wang, C., Zhong, C., Su, A., Xiong, C., Wang, J. and Liu, J., “Mapping Urban Bare Land Automatically
       from Landsat Imagery with a Simple Index,” Remote Sens. 9(3), 249 (2017).
[13]   Sexton, J. O., Song, X.-P., Huang, C., Channan, S., Baker, M. E. and Townshend, J. R., “Urban growth of the
       Washington, D.C.–Baltimore, MD metropolitan region from 1984 to 2010 by annual, Landsat-based estimates of
       impervious cover,” Remote Sens. Environ. 129, 42–53 (2013).
[14] Wang, P., Huang, C. and Brown de Colstoun, E., “Mapping 2000–2010 Impervious Surface Change in India Using
Global Land Survey Landsat Data,” Remote Sens. 9(4), 366 (2017).
[15] Angiuli, E. and Trianni, G., “Urban Mapping in Landsat Images Based on Normalized Difference Spectral
Vector,” IEEE Geosci. Remote Sens. Lett. 11(3), 661–665 (2014).
[16] Lu, D. and Weng, Q., “Use of impervious surface in urban land-use classification,” Remote Sens. Environ. 102(1–
2), 146–160 (2006).
[17] Lu, D. and Weng, Q., “Urban classification using full spectral information of Landsat ETM+ imagery in Marion
County, Indiana,” Photogramm. Eng. Remote Sens. 71(11), 1275–1284 (2005).
[18] Thomas, N., Hendrix, C. and Congalton, R. G., “A comparison of urban mapping methods using high-resolution
digital imagery,” Photogramm. Eng. Remote Sens. 69(9), 963–972 (2003).
[19] Herold, M., Gardner, M. E. and Roberts, D. A., “Spectral resolution requirements for mapping urban areas,” IEEE
Trans. Geosci. Remote Sens. 41(9), 1907–1919 (2003).
[20] Thapa, R. B. and Murayama, Y., “Urban mapping, accuracy, & image classification: A comparison of multiple
approaches in Tsukuba City, Japan,” Appl. Geogr. 29(1), 135–144 (2009).
[21] He, C., Shi, P., Xie, D. and Zhao, Y., “Improving the normalized difference built-up index to map urban built-up
areas using a semiautomatic segmentation approach,” Remote Sens. Lett. 1(4), 213–221 (2010).
[22] Xu, H., “Extraction of urban built-up land features from Landsat imagery using a thematicoriented index
combination technique,” Photogramm. Eng. Remote Sens. 73(12), 1381–1391 (2007).
[23] Martinuzzi, S., Gould, W. A. and Ramos González, O. M., “Land development, land use, and urban sprawl in
Puerto Rico integrating remote sensing and population census data,” Landsc. Urban Plan. 79(3–4), 288–297
(2007).
[24] U. S. Census Bureau., “2012-2016 American Community Survey 5-Year Estimates,” B01003, U. S. Census
Bureau (2017).
[25] “HOTOSM Puerto Rico Buildings (OpenStreetMap Export) - Humanitarian Data Exchange.”, Building Footprint
Labels (2018).
[26] Schmidt, G., Jenkerson, C., Masek, J., Vermote, E. and Gao, F., “Landsat ecosystem disturbance adaptive
processing system (LEDAPS) algorithm description,” Report 2013–1057, Reston, VA, 27 (2013).
[27] USGS., “Product Guide. Provisional Landsat 8 Surface Reflectance Code (LaSRC) Product” (2016).
[28] Shermeyer, J. and Haack, B., “Remote sensing change detection methods to track deforestation and growth in
threatened rainforests in Madre de Dios, Peru,” J. Appl. Remote Sens. 9(1), 096040–096040 (2015).
[29] Vogelmann, J., Khoa, P., Lan, D., Shermeyer, J., Shi, H., Wimberly, M., Duong, H. and Huong, L., “Assessment of
Forest Degradation in Vietnam Using Landsat Time Series Data,” Forests 8(7), 238 (2017).
[30] Pekkarinen, A., Reithmaier, L. and Strobl, P., “Pan-European forest/non-forest mapping with Landsat ETM+ and
CORINE Land Cover 2000 data,” ISPRS J. Photogramm. Remote Sens. 64(2), 171–183 (2009).
[31] “NOAA/NGDC - Earth Observation Group - Defense Meteorological Satellite Progam, Boulder.”, (8 June 2018 ).
[32] Mills, S., Weiss, S. and Liang, C., “VIIRS day/night band (DNB) stray light characterization and correction,” SPIE
Opt. Eng. Appl. 8866, J. J. Butler, X. (Jack) Xiong, and X. Gu, Eds. (2013).
[33] Shermeyer, J., [CometTS: Comet Time Series Toolset for working with a time-series of remote sensing imagery
and user defined polygons], CosmiQ Works Research Lab (2018).
[34] Shermeyer, J. and George, D., “Comet Time Series (CometTS): a New Tool for Analyzing a Time-Series of
Satellite Imagery,” Medium (2018).
[35] Box, G. E., Jenkins, G. M., Reinsel, G. C. and Ljung, G. M., [Time series analysis: forecasting and control], John
Wiley & Sons (2015).
[36] Puerto Rico Electric Power Authority., “Twitter Feed: Customers to Be Energized- April 19th, 2018 to May 31st,
2018,” Tweet, @AEEONLINE (2018).
[37] Wagner, J. and Robles, F., “Puerto Rico Is Once Again Hit by an Islandwide Blackout,” N. Y. Times (2018).
[38] Meléndez, E. and Hinojosa, J., “Estimates of Post-Hurricane Maria Exodus from Puerto Rico,” Research Brief
Centro RB2017-01, Center for Puerto Rican Studies, 1–7 (2017).You can also read