Numerical Investigation and Mold Optimization of the Automobile Coat Rack Compression Molding
←
→
Page content transcription
If your browser does not render page correctly, please read the page content below
Hindawi
Advances in Materials Science and Engineering
Volume 2021, Article ID 6665753, 19 pages
https://doi.org/10.1155/2021/6665753

Research Article
Numerical Investigation and Mold Optimization of the
Automobile Coat Rack Compression Molding

 Youmin Wang, Xiangli Li , and He Sui
 School of Mechanical Engineering, Anhui Polytechnic University, Wuhu, Anhui 241000, China

 Correspondence should be addressed to Xiangli Li; 2190130114@stu.ahpu.edu.cn

 Received 29 December 2020; Revised 7 April 2021; Accepted 20 April 2021; Published 30 April 2021

 Academic Editor: Ashwini Kumar

 Copyright © 2021 Youmin Wang et al. This is an open access article distributed under the Creative Commons Attribution License,
 which permits unrestricted use, distribution, and reproduction in any medium, provided the original work is properly cited.

 In order to have more accurate control over the compression molding of automobile coat rack, improve the quality of molding
 products, and achieve the goal of lightweight design, a novel mechanical model for the main two-layer composite structure of the
 coat rack is proposed. In this regard, the main factors affecting the mechanical properties of the composite structure are obtained.
 The hot air convection is selected for the sheet preheating. During the experiment, the hot air temperature, preheating time,
 molding pressure, and pressing holding time are set to 250°C, 110 s, 13 MPa, and 80 s, respectively. Moreover, the error
 compensation method is applied to compensate for the shrinkage of the product during solidification and cooling. The LS-DYNA
 finite element software is used to simulate the molding process of the main body of the coat rack, and the node force information
 with large deformation is obtained accordingly. The load mapping is used as the boundary condition of mold topology opti-
 mization, and the compression molding of the main body of the coat rack is optimized. A lightweight design process and method
 for the compression molding of automotive interior parts and a mathematical model for the optimization of the solid isotropic
 material penalty (SIMP) (power law) material interpolation of the concave and convex molds are established. Based on the variable
 density method, OptiStruct is used for the lightweight design of the convex and concave molds of the main body of the coat rack,
 which reduces the mold weight by 15.6% and meets the requirements of production quality and lightweight.

1. Introduction design goals, including low-cost and high-performance
 products. However, the mechanical properties of the ma-
Car coat rack is defined as a vehicle accessory to provide terial and the mechanical model of the coat rack were not
beautiful coverage and protection for the covered area or considered. Guo et al. [2] proposed a method for the
system. In addition, it is an important acoustic component recycling felt waste of PP glass fiber composite and studied
for blocking noise from the luggage compartment. Ac- the impact of the size of crushed particles and the proportion
cordingly, the car coat rack has been widely used in almost of crushed material on the formability and mechanical
all vehicles. With the increasing integration of automobile properties of the coat rack. However, the thickness impact of
functions, the coat rack has become a carrier for many other the glass fiber sheet on the mechanical properties of the
parts. Recently, improving the molding quality of auto- material was not considered so that the formulation of
motive interior parts has focused on controlling the me- process parameters was not reliable. Miao et al. [3] discussed
chanical properties of products, the optimal combination of the effect of the multicomponent fiber composition process
process parameters, and mold optimization. More specifi- on the performance of the car coat rack. Through investi-
cally, Zheng et al. [1] performed CAE analysis and physical gating the ratio, pressure, temperature, and speed of mul-
tests on coat racks to find control parameters that affect the ticomponent fibers, the orthogonal test was carried out to
product strength and the load capacity. Moreover, they find the best component. Studies showed that the combi-
considered the requirements of product appearance and nation scheme is an effective way to produce car coat racks
obtained optimal control parameter values to achieve the and investigate all aspects of their performance. However,
2 Advances in Materials Science and Engineering

the experimental method was not used to calculate the upper and lower layers are different. Accordingly, the com-
material shrinkage so that the solidification shrinkage and posite plate is regarded as a thin plate, and then its mechanical
the product cooling were not compensated. Yu [4] simu- model is established by considering variations of different
lated, analyzed, and performed experiments on the non- physical parameters along the Z-axis. Figure 1 shows the
woven fabric hot-molding mold and the molding process mechanical model of the composite structure.
and showed that the molding temperature is the most in- In order to simplify the mechanical model and the
fluential factor in the hot-molding process. Moreover, the corresponding solving method, it is assumed that the glass
temperature distribution was studied, which solved the fiber and PP materials are evenly dispersed into the space
problem of repeatedly adjusting the molding temperature occupied by the sheet, and the overall material performance
based on experience, but the number of research objects and is linearly combined by the volume fraction of each com-
simulation experiments was small. Shao [5] optimized the ponent. Under a specific glass fiber mass fraction, the GMT
process parameters of glass mat reinforced thermoplastics sheet has a specific material constant, which can be sim-
(GMT) composite material compression molding and ob- plified to an isotropic material in the analysis.
tained the optimal combination from the theoretical point of The volume fraction of PP and glass fiber in the GMT
view. In this optimization, no analysis software was applied sheet can be expressed as follows:
to optimize the mold. Demirci and Yildiz [6] studied the ρ 1 · Mp
effect of conventional steel, new generation DP-TRIP steels, Vp � ,
AA7108-AA7003 aluminum alloys, AM60-AZ31 magne- ρp
sium alloys, and crash-box cross-sections on crash perfor- (1)
 ρ · Mb
mance of thin-walled energy absorbers which are Vb � 1 ,
investigated numerically for the lightweight design of vehicle ρb
structures. However, it does not involve numerical research
 where ρ1, ρp, and ρb are the total density of GMT sheets, the
on nonmetallic materials such as car coat racks. It is worth
 bulk density of polypropylene, and glass fiber at room
noting that none of the foregoing studies has simulated the
 temperature, respectively. Moreover, Mp and Mb denote the
compression molding, while the molding simulation can
 mass ratio of polypropylene and glass fiber, respectively.
accurately evaluate the correlation between level factors and
 Then the material constant of the GMT sheet can be cal-
the mold quality. In order to resolve this shortcoming, it was
 culated. It is worth noting that the sum of quality scores
intended to investigate the mechanical properties of ther-
 satisfies the following expression:
moplastic composite materials and design the car coat
structure. In this regard, the LS-DYNA finite element Mb + Mp � 1. (2)
software was applied to simulate the molding process, and
the load mapping was used as the boundary condition for Since the GMT sheet may contain air and cavities during
mold topology optimization. Finally, mold structure opti- the molding process, the sum of the practical volume
mization was established and the mold structure was op- fraction of glass fiber and PP is
timized to improve the molding quality of the coat rack. Vb + Vp ≤ 1. (3)

2. Investigating the Mechanical Properties and Moreover, the void volume rate is defined as
 Structural Design of Thermoplastic ρ1 · M b ρ1 · M b
 Vc � 1 − Vp + Vb � 1 − − . (4)
 Composites for Automobile Coat Racks ρp ρb
In this section, it is intended to establish a mechanical model Let the physical property parameter of the GMT sheet be
for the thermoplastic composite of the car coat rack (the P, where P can represent the elastic modulus of the material
mechanical model is solved), analyze some test cases, de- E, Poisson’s ratio μ, linear expansion coefficient α, and so on.
termine the thickness of the main body, complete the for- Then this parameter in the composite is defined as follows
mulation of the main body molding process parameters, [8]:
determine the shrinkage compensation value, and calculate
the heat transfer in the cooling system. These items are P � Pp · V p + P b · V b , (5)
discussed in detail in the following.
 where Pp and Pb are the physical properties of polypropylene
 and glass fiber, respectively. Similarly, the elastic modulus
2.1. Establishment of Structural Mechanical Model for GMT/ and Poisson’s ratio of the GMT sheet can be calculated from
PET Composite. In the present paper, the composite two-layer equations (6) and (7), respectively.
structure is taken as the research object. The upper layer is a
decorative layer, the main specimen is made of needle-punched E1 � E p · V p + E b · V b , (6)
PET fabric, and the lower layer is a GMT sheet. It should be
indicated that the mechanical properties of GMT sheet depend μ1 � μp · V p + μ b · V b , (7)
on the spatial distribution of the fiber and PP and the com-
bination between them [7]. In the composite structure, the where Ep and Eb are the elastic modulus of polypropylene
materials, thickness, and other physical parameters of the and glass fiber, respectively. Moreover, μp and μb are
Advances in Materials Science and Engineering 3

 z

 E2

 h3
 h2
 E1
 o
 Neutral

 h1
 surface

 q

 Figure 1: Mechanical model of the composite structure.

Poisson’s ratio of polypropylene and glass fiber, respectively. D∇4 w � q, (10)
The upper layer is a single material of needle-punched PET
fabric, so the elastic modulus and Poisson’s ratio are E2 and where D is the bending stiffness of the sheet,
μ2. Then the elastic modulus of the two-layer composite D � Eh3 /12(1 − μ2 ), and h is the total thickness of the sheet.
structure is divided into two layers: The left side of equation (10) D∇4 w denotes the elastic
 E1 , −h1 , h2 , resistance per unit area, and w is the deflection. Moreover,
 E(z) � (8) the left side q is the lateral load per unit area. The stress
 E2 , h2 , h3 . differential equation can be simplified as follows:
 The same operation can be conducted for Poisson’s ratio zσ Z E(z) h2
in the following form: � · − z2 · ∇4 w. (11)
 σ Z 2 · 1 − μ(z)2 4
 μ1 , −h1 , h2 ,
 μ(z) � (9) Integrating both sides with respect to z from −h1 to h3
 μ2 , h2 , h3 . yields the following expressions:
 The differential equation of the elastic surface of the thin
plate can be expressed in the following form:

 h3 zσ Z h
 dz � σ Z 3 � 0 − q � −q,
 −h1 σ Z −h1
 (12)
 h3 E(z) h2 2 4
 h3 E(z) h2
 2 − z ∇ wdz � 2 − z2 dz∇4 w.
 −h1 2 1 − μ(z) 4 −h1 2 1 − μ(z) 4

 In order to simplify expressions, parameter D is defined equation under the boundary conditions of the plate edge
as follows: [9].
 During the unsupported subsidence, the length and
 h3 E(z) h2
 D � − 2 − z2 dz. (13) width for a rectangular thin plate, which is simply supported
 −h1 2 1 − μ(z) 4 on four sides, are a and b, respectively. In this case, the
 boundary conditions are
 Then the integral can be decomposed into the sum of
integrals of each layer: z2 w ⎪
 ⎫
 (w)x�0 � 0, � 0⎪
 ⎪
 ⎪
 h2 E(z) h 2 h3 E(z) zx2 x�0 ⎪
 ⎪
 −D � − z2 dz +
 ⎪
 ⎪
 2 2 ⎪
 ⎪
 −h1 2 1 − μ(z) 4 h2 2 1 − μ(z) ⎪
 ⎪
 2 ⎪
 ⎪
 zw ⎪
 ⎪
 (w)x�a � 0, 2 � 0 ⎪⎪
 h2 zx x�a ⎪
 ⎪
 ⎪
 · − z2 dz � −D1 − D2 . ⎪
 ⎬
 4 . (15)
 ⎪
 ⎪
 (14) z2 w ⎪
 ⎪
 ⎪
 (w)y�0 � 0, 2 � 0 ⎪⎪
 ⎪
 zx y�0 ⎪
 ⎪
 ⎪
 ⎪
2.2. The Mechanical Model of the Composite Structure Is ⎪
 ⎪
 ⎪
 ⎪
Solved. When solving the thin plate deflection-bending ⎪
 ⎪
 2
 zw ⎪
 ⎪
problem by the Navier method, the deflection w should be (w)y�b � 0, 2 � 0 ⎪⎪
 ⎭
initially obtained from the elastic surface differential zx y�b
4 Advances in Materials Science and Engineering

 The deflection w can be calculated from the following 4 a b nπy mπx
trigonometric series: Amn � q(x, y)sin sin dxdy. (19)
 ab 0 0 b b
 ∞ ∞ ∞ ∞
 mπx nπy Then equation (18) can be rewritten in the following
w � wm � Amn sin sin , (16)
 m�1 n�1 m�1 n�1 a b form:
where m and n are positive integers. Substitute this ex- 4 ∞ ∞ 4 a b nπy mπx
 q� q(x, y)sin sin dxdy
pression into equation (15) which indicates that all boundary ab m�1 m�1 ab 0 0 b b
conditions are satisfied. In order to find the coefficient Amn,
equation (16) is introduced into equation (10): nπy mπx
 · sin sin ,
 ∞ b b
 ∞
 m2 n2 mπx nπy
 π4 D + A sin sin � q, (17) (20)
 m�1 n�1 a2 b2 mn a b
 a b
and expanding the load q on the right side of equation (17) 4 0 0 q(x, y)sin(nπy/b)sin(mπx/b)dxdy
 Amn � (21)
into a multiple triangle series results in the following π4 abD m2 /a2 ) + n2 /b2 ) .
expression:
 ∞ ∞ When the thin plate is subjected to a uniform load, q
 mπx nπy becomes a constant q0. Under this circumstance, equation
 q � Amn sin sin , (18)
 m�1 n�1 a b (21) can be rewritten in the following form:

where A can be solved through the method of determining
the triangle series, and the solution is

 16q0
 Amn � 2, (m � 1, 3, 5, . . . ; n � 1, 3, 5, . . .). (22)
 π mnD m /a2 + n2 /b2
 6 2

 Then equation (16) can be applied to calculate the composite density is 1.3 g/cm3 and the void ratio is assumed
deflection: to be 0. The mass fraction and density of the glass fiber are
 ∞ ∞ 30% and 2.6 g/cm3, respectively. In the present study, alkali-
 16q0 sin(mπx/a)sin(nπy/b)
 w� free fibers (E) with an elastic modulus of 72 GPa and
 π2 D 2 2. (23)
 m�1,3,5,... m�1,3,5,... mn m /a2 + n2 /b2 Poisson’s ratio of 0.2 are applied. Furthermore, the density,
 elastic modulus, and Poisson’s ratio of PP are 0.93 g/cm3,
 Internal forces can be expressed in the following form: 1.4 GPa, and 0.4, respectively. The lateral uniform load is
 10 MPa, the thickness of the transition layer is 1.5 mm, and
 ⎪
 ⎧
 ⎪
 ⎪ z2 w z2 w the specimen is made of needle-punched PET with an elastic
 ⎪
 ⎪ Mx � −D 2 + μ 2 , modulus of 4000 MPa.
 ⎪
 ⎪ zx zy
 ⎪
 ⎪
 ⎪
 ⎪ Based on the established mathematical model, the
 ⎪
 ⎪
 ⎪
 ⎪ thickness impact on the mechanical properties of the thin
 ⎪
 ⎪
 ⎪ z2 w z2 w plate can be investigated by changing the thickness of the
 ⎪
 ⎪ My � −D 2 + μ 2 ,
 ⎪
 ⎪ zy zx GMT sheet under the condition that the glass fiber content is
 ⎪
 ⎪
 ⎪
 ⎪ maintained 30%, while the applied load and constraints
 ⎪
 ⎪
 ⎪
 ⎨ remain constant. The iterative calculations are performed in
 z2 w (24)
 ⎪
 ⎪Mxy � Myx � −D(1 − μ) , the MATLAB environment. The maximum deflection and
 ⎪
 ⎪ zx zy stress value of the two-layer structure are shown in Table 1.
 ⎪
 ⎪
 ⎪
 ⎪ The stress value can be obtained from the internal force value
 ⎪
 ⎪
 ⎪
 ⎪
 ⎪
 ⎪
 ⎪ z2 2 through the generalized Hook definition of the thin plate.
 ⎪
 ⎪ FS,x � −D(1 − μ) ∇ w, Table 1 indicates that, for a constant load and constraint,
 ⎪
 ⎪ zx
 ⎪
 ⎪ as the thickness of the GMT sheet increases, the deflection of
 ⎪
 ⎪
 ⎪
 ⎪ the two-layer composite structure gradually decreases,
 ⎪
 ⎪ z2 2
 ⎪
 ⎪ F � −D(1 − μ) ∇ w. thereby reducing the normal stress and the shear force. It is
 ⎩ S,y
 zy inferred that, as the sheet thickness increases, flexural,
 Based on the performed calculations and analyses, the tensile, and shear resistance of the whole plate improve.
two-layer composite structure is simply supported on four When the thickness is fixed and different glass fiber
sides, where the length a, width b, and GMT sheet thickness ratios are used, the deflection and internal force of the plate
are 0.1 m, 0.1 m, and 3.5 mm, respectively. Moreover, the are shown in Table 2.
Advances in Materials Science and Engineering 5

Table 1: Maximum deflection and stress values for different E0 I ≥ σ,
thicknesses.
 3 (28)
GMT plate thickness (mm)
 Deflection
 σ x, σ y (Pa)
 τxy, τyx b · d1 + d 2
 (m) (Pa) I� ,
 12
3.3 0.0022899 34.914 24.598
3.4 0.0019380 30.428 21.478 where σ is the required stiffness; I is the moment of inertia;
3.5 0.0016547 26.357 18.759 and b is the width of the coat rack. In order to solve the
3.6 0.0014242 23.458 16.102 equations easily, a thick needle-punched PET fabric with a
3.7 0.0011984 19.857 13.478 thickness of 1.5 mm, elastic modulus of 4000 MPa is
 considered in the calculations, and GMT sheet porosity is
 assumed to be 0. The glass fiber is made of alkali-free fiber
 Table 2 indicates that, under the condition of un- (E) with an elastic modulus of 72 GPa, while the elastic
changed load and restraint, as the content of glass fiber modulus of PP is 1.4 GPa. Moreover, the coat rack width b
increases, the deflection value and bending moment value is 600 mm and the required bending stiffness is σ ≥ 60 N/
decrease, while the corresponding torque increases. mm2.
Therefore, the optimal content of GMT sheet glass fiber is The combination of glass fiber content and thickness of
selected according to the required mechanical performance the GMT sheet that satisfy the stiffness requirements can be
index. calculated from equations (27) and (28). The proposed
 combination is shown in Table 3.
 Based on the obtained results, a glass fiber content of
2.3. Thickness of the Car Coat Rack. Based on the foregoing 30% and a thickness of 4.5 mm is proposed as the selected
discussions, it is concluded that the rigidity design re- composition. To maximize the safety factor, the thickness of
quirements can be achieved by increasing the thickness the GMT sheet is rounded to 4.5 mm. Since the thicknesses
of the GMT sheet without changing the main structure of of the GMTsheet and PET fabric are 4.5 mm and 1.5 mm, the
the car coat rack. However, the material consumption for overall thickness of the composite is 6 mm.
too thick products cannot be justified. More specifically,
the production cost increases, the product becomes
prone to stress concentration, and the molding quality 2.4. Formulation of the Process Parameters to Mold the Main
reduces. Body of the Automobile Coat Rack. By analyzing the com-
 The stiffness test principle is as follows: as a support mon quality defects and causes of the main body of the coat
frame, the sample deflects continuously at the midpoint of rack, the main processing parameters that affect the molding
the span until the fracture or deformation reaches a certain process of the car coat rack are determined. These param-
predefined value. In this process, the applied stress to the eters are the molding pressure, holding time, and the
sample is measured. Figure 2 illustrates the schematic molding temperature.
configuration of composite layers, indicating that the
composite consists of a PET fabric and the GMT sheet.
 Since the fabric and the substrate are subjected to stress 2.4.1. Sheet Warm-Up Time. In order to heat the GMT sheet,
in parallel, the mixed law of elastic modulus of the parallel hot air convection preheating is used. In this case, the sheet
composite structure can be used [9]: can be expanded to 2-3 times the thickness of the cold sheet.
 It should be indicated that the sheet temperature should be
 E 0 � E 1 V 1 + E2 V 2 , (25) less than 230°C; otherwise, the PP polypropylene will de-
 grade, thereby affecting the surface of the molded product
where E0, E1, and E2 denote the elastic modulus of the and reducing the heat resistance and strength of the product
composite material, PP glass fiberboard, and PET fabric, [10, 11]. The preheating time of the GMT sheet can be
respectively. Substituting equations (6) into (25) gives calculated through the following expression [12] (29):
 t � 70.9521 + 0.2318d − 0.2810T, (29)
 E0 � Ep Vp + Eb Vb V1 + E2 V2 . (26)
 where t is the appropriate preheating time, min; d is the sheet
 Then the predicted value of the elastic modulus in the
 thickness, mm; and T is the hot air temperature, °C.
composite shown in Figure 2 can be expressed in the fol-
 During the experiment, hot air flow from an oven is
lowing form:
 used to preheat the sheet. The thickness of the GMT sheet is
 d1 d2 4.5 mm and the preheating temperature of the hot air is
 E0 � E p V p + E b V b + E2 , (27)
 d1 + d2 d 1 + d2 250°C. Based on equation (29), the preheating time is
 adjusted to 99 s. In the experiment, the sheet is taken out of
where d1 and d2 denote the thickness of PP glass fiber and the oven and transferred to the mold. Since the temper-
PET fabric, respectively. In order to meet the rigidity atures of the material and the oven reduce during the
design requirements, the following conditions should be material transfer, the preheating time of the sheet is set to
satisfied: 110 s.
6 Advances in Materials Science and Engineering

 Table 2: Deflection and internal force values for different glass fiber contents.
GMT plate glass fiber content (%) Deflection (mm) Bending moment (N · m) Torque (N · m)
25 0.0016732 25.434 29.562
30 0.0016547 25.293 29.646
35 0.0016238 25.177 29.739
40 0.0015966 25.054 29.822
45 0.0015624 24.964 29.018

 PET fabric

 PP glass fiber board
 Figure 2: Schematic configurations of the composite layers.

 Table 3: Proposed GMT sheet glass fiber ratio and thickness combination.
GMT sheet glass fiber content (%) GMT sheet thickness (mm) Round thickness (mm)
20 4.886 5
25 4.636 4.8
30 4.386 4.5
35 4.136 4.3
40 3.886 4

2.4.2. Molding Pressure and Mold Clamping Speed. In the present study, for a four-post-servo-hydraulic
Appropriate molding pressure not only improved the machine (model; company) with F � 0.5 m2 and
product quality but also made up for the shortage if other S � 0.84 m2, the molding pressure is 13 MPa and
industrial parameters were not adequate [13]. ftable � 22 MPa. For these parameters, equation (31)
 indicates that x > 1, so that the selected hydraulic
 (1) The method of maximum gauge pressure:
 pressure meets the molding requirements.
 f1 f2 S In the molding process to produce the main body of
 ftable � , (30)
 T the automobile coat rack, the mold clamping speed is
 not a fixed value. It should be indicated that the
 where ftable, f1, and f2 denote the gauge pressure, unit molding process can be divided into 5 main stages:
 pressure required by the product, and the rated
 gauge pressure of the press, respectively. Meanwhile, ① When the sheet is placed in the mold, the concave
 S and T denote the projected area of the product in mold decreases at a speed of 60 mm/s.
 the compression direction and the pressing force, ② The interval between the convex and concave
 respectively. mold gradually decreases. Consequently, when
 the guide column enters the guide sleeve, the
 f1 S
 x� , (31) speed becomes 8 mm/s. Moreover, when the
 T convex and concave molds are closed, the sheet is
 where x is the ratio of the force acting on the pressure molded under pressure.
 direction of the product to the pressing force. When ③ Cooling and solidification.
 x > 1, the pressing force is too small to meet the ④ After holding the pressure for 80 s, the concave
 production requirements. On the other hand, when mold is split at a speed of 8 mm/s.
 x < 1, the pressing force is sufficient to meet the ⑥ After the split mold is completed, the concave
 production demand. mold is 60 mm/s. Then the speed rises and when
 the die is reset, the product is removed.
 (2) The method of Piston area method:
 These five stages are also shown in Figure 3.
 fS
 ftable � 1 , (32)
 F
 2.4.3. Holding Time. The cooling time calculation results are
 where F is the cross-sectional area of the piston of the utilized as a reference to select the holding time. For large
 press. products such as car coat racks, the length and width are far
Advances in Materials Science and Engineering 7

 Table 4: The value of process parameters.
 Concave and convex

 Molding pressure (Pa)
 mold distance (m)

 Parameter name Value
 The thickness of the main body of the car coat rack
 4.5
 (mm)
 The average temperature of the mold cavity wall Tw
 40
 (°C)
 The molding temperature T0 (°C) 220
 Molding The average temperature when the sheet is demolded
 Sheet into the mold

 1 High speed

 4 Low speed parting
 80

 Take out the product
 5 High speed
 3 Hold pressure
 2 Low speed mold

 time (s) T (°C)
 3
 clamping

 The density of the sheet ρ (kg/m ) 1130

 mode
 The specific heat capacity of the sheet cp (kJ/kg·°C) 1.55
 The thermal conductivity of the sheet λ (kW/m·°C) 0.33 × 10⁻³

 2.5. Shrinkage Compensation Value. The molding shrinkage
 Concave and convex mold distance
 rate of the product is measured experimentally. The ex-
 Molding pressure
 perimental process is as follows: the main model of the coat
 rack of the reference model is selected. Moreover, 20 pieces
 Figure 3: Speed variation graph during the mold clamping. of GMT plates with a thickness of 4.5 mm glass fiber content
 of 30% and a needle-punched PETfabric of 1.5 mm thickness
beyond their thickness, and they have two-dimensional are selected. It should be indicated that, in the experiment,
characteristics. However, the heat is only transferred in the the sheet preheating time, the pressure holding time,
one-dimensional direction, that is, the thickness direction of molding pressure, and mold closing speed utilize the
the part. Therefore, the cooling of such products can be abovementioned parameters. When the mold is opened, the
conducted as follows. distance between the selected positioning points is mea-
 Heat transfer can be calculated from the following sured, and each piece is averaged at one measurement in the
expression: length and width directions. After the product is left at room
 zT z2 T temperature for 24 hours, the selected positioning point is
 � k 2 2, (33)
 zθ′ zx measured again, using equation (29). Finally, the average
 shrinkage rate of the composite two-layer structure of GMT
where T and k denote the average temperature when the sheet + needle-punched PET fabric is 0.354%.
sheet is demolded and the thermal diffusion coefficient of the
sheet, respectively.
 In order to separate the variables, the following equation 2.6. Heat Transfer Calculation for the Cooling System of the
is used: Automobile Coat Rack Compression Molding Mold. The
 2 2 x2 π T − Tw cooling system adopts the water cooling method, and a
 θ′ � − 1 ln , cooling water channel is laid on the mold surface to pass the
 π k T0 − Tw
 (34) cooling water. In this section, the design and calculation of
 λ the cooling system of the forming mold of the main body of
 k� , the car coat rack are established.
 ρ · cp

where x1 is half the thickness of the part, m; Tw is the mold 2.6.1. The Total Heat of the Sheet into the Cavity. In a
cavity temperature, °C; T0 is the sheet molding temper- molding process, the total heat transferred from the sheet to
ature, °C; ρ is the density of the sheet, kg/m3 ; λ is the the mold is mathematically expressed as follows:
thermal conductivity of the sheet, kW/m · °C; and cp is the
specific heat capacity of the sheet, kJ/kg · °C. Q1 � Cp · T0 − T · V · ρ, (36)
 The process parameter values are shown in Table 4.
 Substituting the abovementioned parameters into where T0 and T denote the sheet molding temperature and
equation (34), the cooling time of the molding of the main the average temperature when the sheet is demolded, re-
body of the automobile coat rack is mathematically spectively. Moreover, ρ, cp, and V are the density of the sheet,
expressed as follows: the specific heat capacity of the sheet, and the volume of the
 sheet, respectively. It is worth noting that the volume of the
 0.33 × 10⁻³
 k� � 1.88 × 10⁻⁷ , sheet is set to 1.4 m × 0.6 m × 0.0045 m.
 1130 × 1550 × 10−3
 (35)
 2 2 0.002252 π(80 − 40) 2.6.2. Heat Taken away by the Cooling Water. The heat taken
 t � − ln ≈ 74 s. away by the mold cooling water in one press molding is
 π k 4(220 − 40)
 expressed as follows:
 Combining with the previous pressure holding time, the
 Q2 � Q1 − Qc − QR − QL , (37)
pressure holding time is determined to be 80 s.
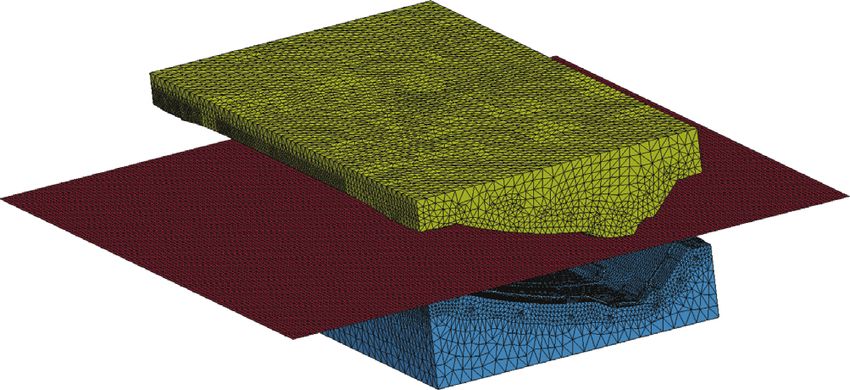
8 Advances in Materials Science and Engineering

where Qc, QR, and QL denote the convection heat transfer stress concentration area of the mold during the molding
from the mold to the air, the radiation heat transfer from the process [14]. Therefore, the boundary conditions for the
mold to the air, and the heat transfer from the mold to the topological optimization of the convex and concave mold
hydraulic machine through the upper and lower mold bases, are obtained. Moreover, the design of the mold is optimized.
respectively.
 Under normal circumstances, 90%–95% of the heat
brought into the sheet can be taken away by the cooling 3.1. The Main Influencing Factors of the Modeling Process.
water through the mold cooling channel. Therefore, during The molding process is a complicated nonlinear challenging
the design process, Q2 � Q1. process. The influencing factors in this process include the
 Since the main body of the car coat rack is a large thin- compression molding of the sheet, the elastic deformation of
walled product, it can be designed according to 50% of the the mold under high temperature and high pressure, and the
heat taken by the concave mold and the convex mold; then, frictional contact between the mold and the sheet during the
 mold clamping process; it is a complex finite element
 Q2a � Q2t � 0.5Q2 . (38) problem of thermal and mechanical coupling [15].

2.6.3. Cooling Water Hole Diameter. The volume flow of the 3.1.1. Grid Division. The density distribution of the grid is
cooling water can be calculated according to equation (39) one of the important factors that affect the calculation ac-
during the molding process of the die and the die of the die curacy [16]. In order to simplify the meshing and improve
in one molding process: the quality and solution rate of meshing, the CATIA soft-
 ware is utilized to simplify the model in the early stage. The
 ⎧
 ⎪
 ⎪ Q2a convex and concave molds use sweeping meshing,
 ⎪
 ⎪ V2a � ,
 ⎪
 ⎪ ρ1 c1 θ 1 − θ2 · t SOLID168 elements are used to mesh, and the length di-
 ⎨
 (39) rection is divided into 60. It should be indicated that the
 ⎪
 ⎪
 ⎪
 ⎪ Q2t width direction is divided into 3 equal parts with a total of
 ⎪
 ⎪
 ⎩ V2t � , 942,000 units. The sheet adopts shell163 thin shell unit and
 ρ1 c 1 θ1 − θ 2 · t
 the sheet grid is a regular quadrilateral unit with 15000 units.
where θ1 and θ2 are the inlet and outlet temperatures of the Moreover, the unit has 11 different algorithms. In the
mold cooling water, respectively. It should be indicated that present study, the Belytschko − Tsay algorithm is used be-
the temperature difference should not be too large and its cause its calculation speed is high. Figure 4 illustrates the
maximum value should not exceed 5°C. Moreover, V grid division diagram.
(m3 · min− 1 ) and ρ1 (kg/m3 ) denote the volume flow of
cooling water and the density of water, respectively. Fur-
thermore, c1 (kJ/kg · °C) and t (min) are the specific heat 3.1.2. Heat Transfer Model Settings. According to the
capacity of water and the cooling time of one molding, characteristics of the molding process, the following two
respectively. heat transfer methods are described:
 The density of water is 1000 kg/m3, and the specific heat (1) Radiation and air-cooling heat exchange
capacity of water is 4.2 kJ/kg · °C, which is calculated Owing to the small proportion of the air-cooled heat
according to equations (36) and (38): transfer, air-cooling and radiation can be written as a
 0.5Q2 0.5 · Cp · T0 − T · V · ρ unified heat transfer equation [17]:
 V2a � V2t � �
 ρ1 c1 θ1 − θ2 · t ρ1 c1 θ1 − θ2 · t
 q � h1 + h2 T − T0 , (41)
 3
 � 16.275 m /min.
 where q is the heat flux, density, J/m2 · s. Moreover,
 (40) h1 and h2 denote the convective heat transfer coef-
 According to the correlation between the cooling water ficient, W/m2 · K, and the radiant heat transfer co-
pipe volume flow and the pipe diameter, the cooling water efficient, W/m2 · K, respectively.
pipe diameter is determined as D � 27 mm. h2 � εδ T + T0 T2 − T20 , (42)
 The correlation between the distance P of the cooling
water pipe, the distance H from the profile, and the diameter where ε and δ are the blackness coefficient and the
D of the channel is P � (3∼5) D, H � (1∼2) D; from Boltzmann constant, J/K, respectively. Moreover, T
D � 27 mm, take the pipe distance P � 80 mm, H � 30 mm. and T0 are the surface temperature of the sheet, °C,
 and the ambient temperature, °C, respectively.
3. Simulation of the Molding Process Table 5 presents the specific values.
In the present study, the Ls-Dyna finite element program is (2) Contact heat transfer
used to simulate the molding process of the main body of the A contact heat transfer exists between the sheet and
car coat rack to obtain the nodal force information of the the mold, and calculation of the contact heat transfer
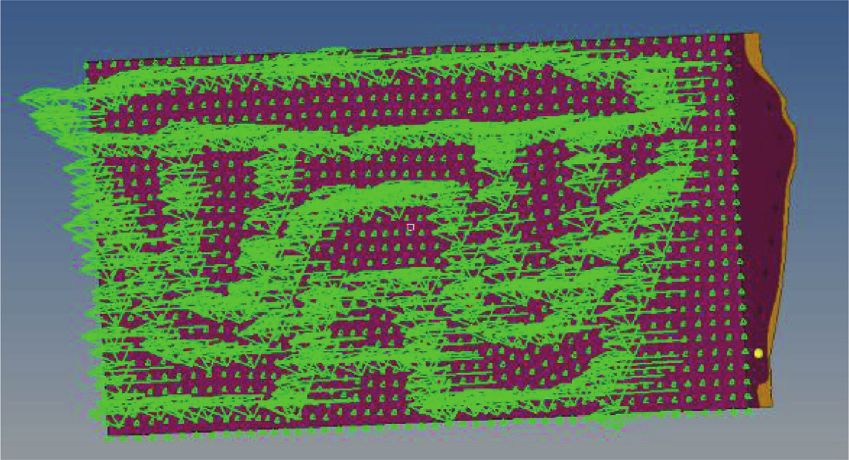
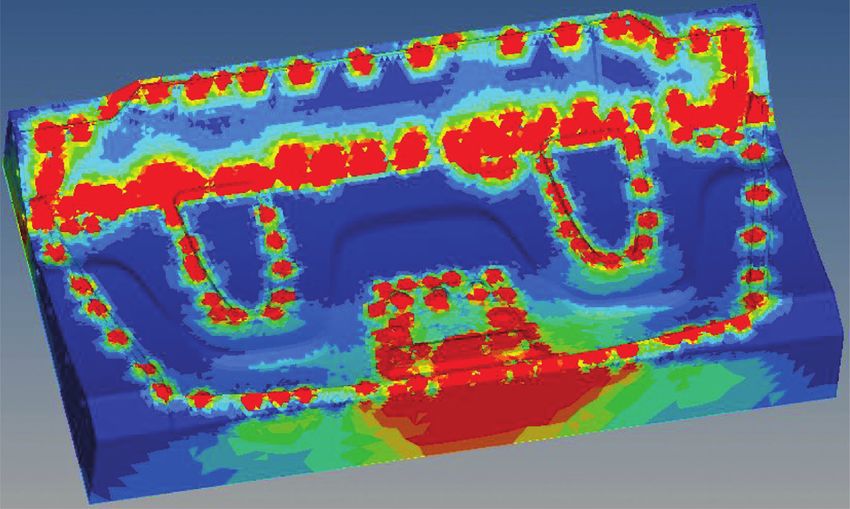
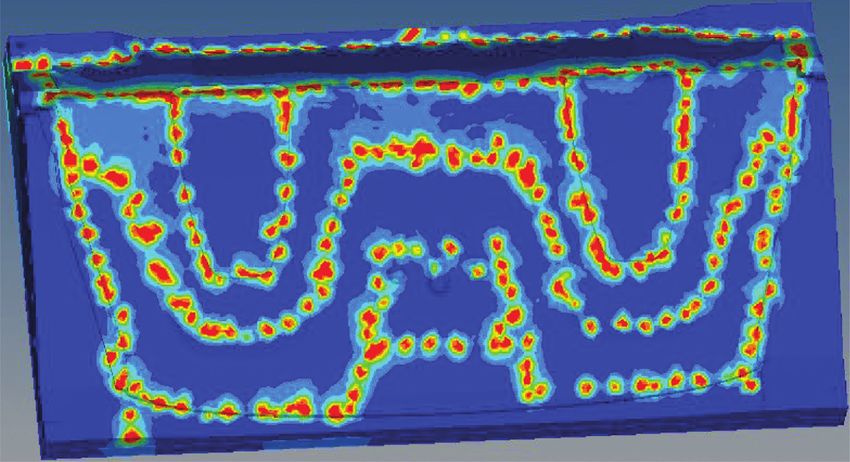
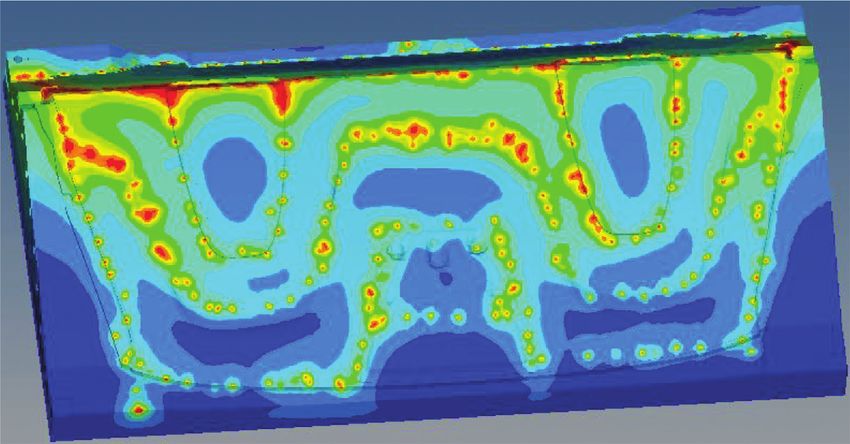
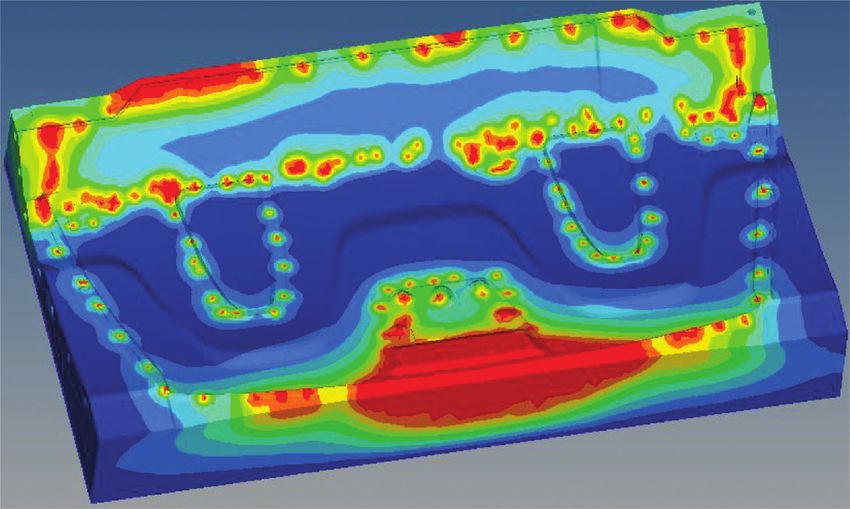
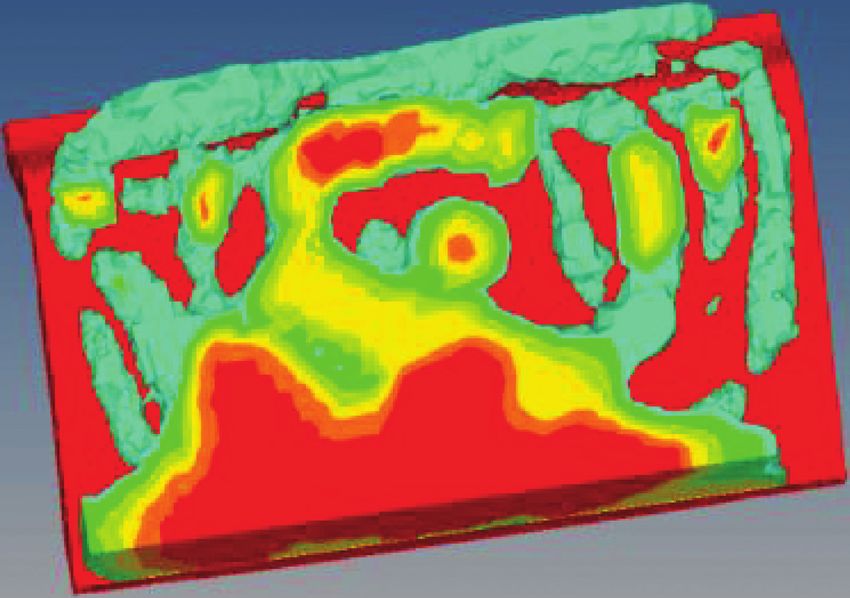
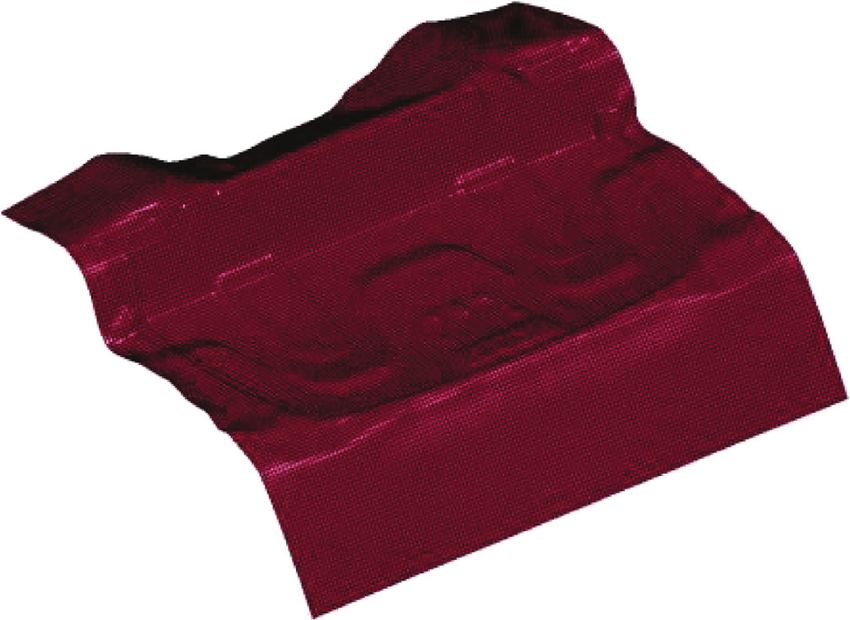
Advances in Materials Science and Engineering 9

 change in energy. The control of energy is set by the keyword
 ∗
 CONTROL_ENERGY. In this study, set HGEN � 2,
 RWEN � 2, SLNTEN � 2, and RYLEN � 2. The purpose of
 the abovementioned setting is to consider various energy
 dissipations in the energy balance.

 3.1.6. Control of the Time Step. In the LS-DYNA software,
 the convergence of the time integration algorithm is condi-
 Figure 4: Grid division diagram. tional, and it is stable only when the time step Δt is less than
 the critical time step, which is mathematically expressed as
 Δl
 Table 5: Heat transfer constant. Δt < ,
 c + x_
h1 + h2 ε δ T T0 ��������� (44)
200 W/(m2·K) 0.6 5.672 × 10− 8 J/K 220°C 20°C E
 c� 2 ,
 1 − v · ρ
 is challenging. Empirical equation [18] (43) is used in
 this regard: where Δl, c, and x denote the characteristic length of the
 element, m, the sound velocity of the material, m/s, and the
 velocity of the node, m/s, respectively.
 q � hcond T − T1 . (43) In the compression molding simulation, as time passes,
 the deformation increases. Then, Δt quickly decreases, in-
 In the abovementioned equation, hcond � K/lgap , where dicating that the integration algorithm divergence interrupts
K � 10 and lgap is the contact gap between the workpiece and the simulation. In order to avoid this phenomenon, the mass
the mold, which is automatically calculated in the LS-DYNA scaling technique is used to set a duration value ∆tsz through
program, and its unit is mm. Moreover, T1 denotes the mold the keyword ∗CONTROL_TIMESTEP. In the simulation, if
cavity temperature, °C. ∆t < ∆tsz, the program automatically increases the density of
 the structural material and the time step size. In the present
 study, Δtsz is set as 0.0000025, time step size scaling factor
3.1.3. Contact and Friction Settings. The keyword TSSFAC � 0.9, and DTINIT � 0. Moreover, the initial step
∗
 CONTACT_FORMING_ONE_WAY_SURFACE_TO_S- size is set by the program.
URFACE_THERMAL defines the contact method of the
compression molding, and FORMING_ONE_WAY is the
type of contact specifically used for molding. It should be 3.2. Setting of Materials and Boundary Conditions
indicated that the penalty function algorithm is used to
calculate the contact interface force. Since LS-DYNA is (1) Material: the sheet material is selected from the
originally used for the collision analysis, if it is used for the constitutive equation of the thermoplastic material.
forming analysis, the default parameter settings should be The thickness of the sheet is defined by the actual
modified [19]. In the present study, the penalty function thickness of the part. The material of the convex and
stiffness factor SLSFAC is modified to 0.1. concave mold is 45#. The sheet is made of PP-based
 In the compression molding process, there is friction GMT composite material with a glass fiber content of
between the mold and the sheet. Therefore, the friction 30%.
coefficient should be determined. In LS-DYNA, the friction (2) Initial boundary conditions: the initial process pa-
force is calculated by the Coulomb model. In this study, the rameters of the automobile coat rack compression
average friction coefficient is 0.1. molding are set as follows. Moreover, the punch is set
 to fix the lower table of the hydraulic press, and the
 concave mold should be closed under the pressure of
3.1.4. Hourglass Control. In order to verify the validity of the
 the press. The molding pressure is set to 13 MPa, the
calculation result, the ratio of the hourglass energy to total
 mold closing speed after the upper mold contacts the
energy should be less than 10%. On the other hand, the
 sheet is 8 mm/s, and the initial temperature of the
hourglass control coefficient cannot be too large. When the
 sheet is 220°C. The mold temperature is 40°C, the
hourglass control coefficient is greater than 0.15, the cal-
culation will be unstable. Therefore, the hourglass control cooling channel water temperature is 20°C, and the
 pressure holding time is 80 s.
sets IHQ � 4, and the hourglass energy coefficient is set to
QH � 0.1.
 3.3. Finite Element Numerical Calculation Results.
3.1.5. Energy Dissipation Control. In the numerical simu- Figures 5–7 show the numerical simulation results in the
lation of the compression molding, the main reference index molding process, which are obtained after the software
to determine the accuracy of the simulation result is the calculation.
10 Advances in Materials Science and Engineering

 Time = 1.2199 Time = 2.44
 Contours of effective stress (v-m) Contours of effective stress (v-m)
 Reference shell surface Reference shell surface
 Min = 0.0906078, at elem# 801032
 Min = 0, at elem# 466963
 Max = 345, at elem# 12265
 Max = 345, at elem# 78093

 (a) (b)
 Time = 3.6599 Time = 5.7947
 Contours of effective stress (v-m) Contours of effective stress (v-m)
 Reference shell surface Reference shell surface
 Min = 0.0779287, at elem# 804289 Min = 0.0725777, at elem# 798571
 Max = 345, at elem# 75756 Max = 345, at elem# 52086

 (c) (d)
 Time = 7.9299 Time = 9.4549
 Contours of effective stress (v-m) Contours of effective stress (v-m)
 Reference shell surface Reference shell surface
 Min = 0.0533153, at elem# 513264 Min = 0.0829849, at elem# 885116
 Max = 345, at elem# 11392 Max = 711.588, at elem# 909186

 (e) (f )

 Figure 5: The equivalent stress diagram of the forming process.

 Time = 14.335 Time = 28.365
 Contours of effective stress (v-m) Contours of effective stress (v-m)
 Reference shell surface
 Reference shell surface
 Min = 1.06772, at elem# 747972
 Min = 3.63642, at elem# 876981
 Max = 345, at elem# 189378
 Max = 345.001, at elem# 741474

 (a) (b)
 Figure 6: Continued.
Advances in Materials Science and Engineering 11

 Time = 19.215 Time = 43.005
 Contours of effective stress (v-m) Contours of effective stress (v-m)
 Reference shell surface Reference shell surface
 Min = 2.89149, at elem# 13894 Min = 2.45393, at elem# 13429

 Max = 345, at elem# 151856 Max = 341.061, at elem# 283299

 (c) (d)
 Time = 52.155 Time = 57.34
 Contours of effective stress (v-m) Contours of effective stress (v-m)

 Reference shell surface Reference shell surface

 Min = 0.766231, at elem# 536714 Min = 0.527726, at elem# 536714
 Max = 345, at elem# 485733
 Max = 345.001, at elem# 487450

 (e) (f )

 Figure 6: Cloud diagram of stress changes during the packing process.

 Time = 9.76
 Time = 9.76

 (a) (b)

 Figure 7: The main body shape of the car coat rack.
12 Advances in Materials Science and Engineering

3.3.1. Equivalent Stress during Forming. The simulation (5) Based on the OptiStruct, the topological optimiza-
results of the equivalent stress during the molding process tion of the convex-concave structure is iteratively
show that, during the molding process of the main body of solved.
the automobile coat rack, the stress concentration area is (6) The final shape is optimized according to the to-
located at the outer contour of the mold and the slope is pology of the convex and concave mold structure,
steeper. and the three-dimensional software is utilized to
 redesign the mold structure.
3.3.2. Equivalent Stress during the Holding Pressure. The (7) According to the redesigned mold structure for mold
simulation results of the equivalent stress during the packing processing and manufacturing.
process show that the node displacement is the largest when
the packing time is 11 s. As the packing time passes, the mold 4.2. OptiStruct-Based Optimization Design of the Mold
temperature decreases and the deformation gradually de- Topology. OptiStruct uses LS-DYNA for preprocessing and
creases too. After 64 s, it remains unchanged until the end of definition of structural optimization problems. After com-
the packing process. pleting the finite element modeling in LS-DYNA, the op-
 timization definition panel is used to define optimization
 variables, constraints and goals, and optimization parame-
3.3.3. Appearance of the Molding Process. The above- ters. Then, OptiStruct is submitted for structural analysis
mentioned simulation results show that the nodal force and optimization. Figure 8 shows the OptiStruct structure
information of the mold during the compression molding optimization design flowchart [22].
process is obtained. Therefore, the load mapping is used as
the boundary condition for the next topology optimization.
 4.2.1. The Establishment of the Topological Optimization
 Model of the Mold Convex and Concave Mold Structure.
4. Optimized Mold Design In the optimization process of the convex and concave dies,
Currently, the lightweight design of molds is the develop- the problem of the mass minimization can be equated to the
ment direction of mold optimization [20]. Based on the problem of the volume minimization. The real working
empirical design, CAE tools are used to perform mold conditions of the convex and concave molds are analyzed.
structure analysis and optimization design before process- Moreover, based on the solid isotropic material penalty
ing. Aiming at the problem of excessive quality of molds and (SIMP) method and according to the numerical simulation
due to the current empirical design of compression molding calculation results of the compression molding, the maxi-
dies for automotive interior parts, in the present study, a mum displacement of the nodes in the stress concentration
lightweight design process and method is proposed for area is used as the constraint condition. Furthermore, the
compression molding dies. material element density is used as the design variable. The
 minimum volume of the convex-concave structure is the
 SIMP optimization model [23], and the density penalty
4.1. Lightweight Design Process of the Mold Structure. factor P is set to 3. The model is formulas (45) and (46),
According to the numerical simulation method for the ⎧ Ee � ρpe · E0 ,
 ⎨
molding process of automotive interior parts and the to- (45)
 ⎩
pology optimization theory of the variable density method 0 < ρmin ≤ ρe ≤ 1,
[21], a lightweight design method for the mold structure of
interior parts molding is proposed. ⎪
 ⎧
 ⎪ min : V
 ⎪
 ⎪
 ⎪
 ⎨ subject to: KU � F,
 (1) According to the mold design requirements, the
 ⎪ (46)
 structure of the compression molding convex and ⎪
 ⎪ 0 < ρmin ≤ ρe ≤ 1,
 ⎪
 ⎪
 concave mold is designed in accordance with the ⎩ U ≤ U∗ ,
 j j
 traditional mold design guidelines.
 (2) With the help of the LS-DYNA finite element pro- where ρi are V denote the design variable for the topology
 gram, the compression molding process of the main optimization with the variable density method and the
 body of the coat rack is numerically simulated to overall structure volume, respectively. Moreover, U, K, and
 obtain the force information of the convex and F are the overall displacement column vector, the overall
 concave mold nodes in the actual working structure stiffness matrix, and the external load vector,
 conditions. respectively.
 (3) Load mapping is used to construct convex and
 concave boundary conditions of die structure 4.2.2. Topological Optimization of Convex and Concave Dies
 optimization. Structure. According to the analysis of the real working
 (4) The improvement space of the mold structure design conditions of the convex and concave molds, based on the
 is clarified, and the design area and nondesign area SIMP material interpolation optimization model of the
 are determined. convex and concave molds, OptiStruct is used to solve.
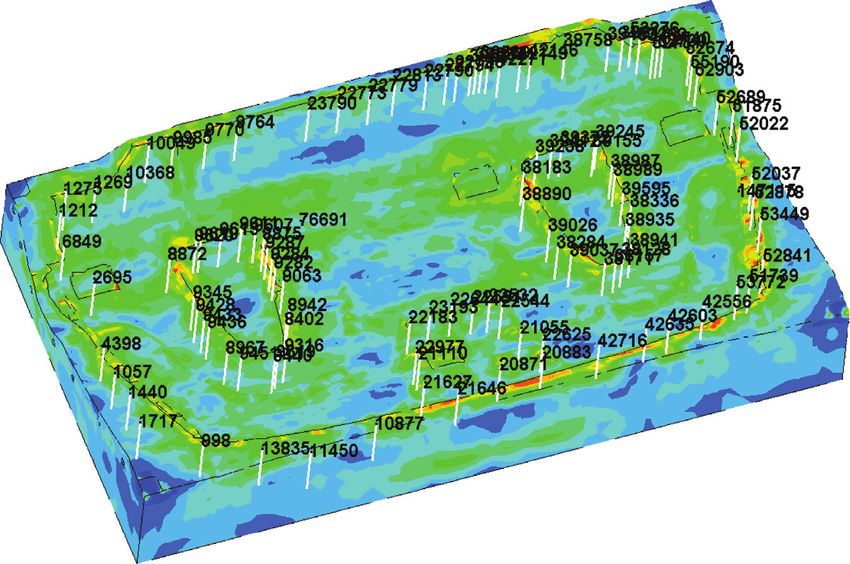
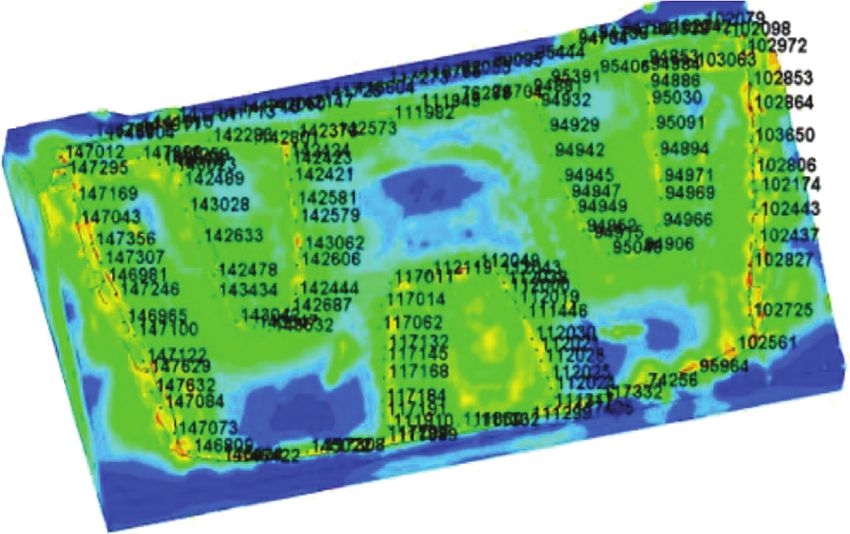
Advances in Materials Science and Engineering 13

 Start

 Finite element modeling
 (i) Create a finite element model
 (ii) Define boundary conditions and loads

 Define optimization parameters
 (i) Define design variables
 (ii) Define responses and constraints
 (iii) Define design goals

 Structural analysis

 Y
 Whether to converge End

 N

 Sensitivity analysis

 Approximate model

 Optimization

 Update design variables

 Figure 8: Topology optimization flowchart.

OptiStruct describes the three elements of the optimal design Figures 10 and 11 show that boundary conditions are
through different types of information cards. applied and the optimization area is determined. The
 analysis of the mold structure shows that, in the
 (1) Set optimization variables
 optimized design, the concave and convex model
 In the topology optimization of convex and concave surfaces and the location of the cooling water channel
 molds, the tighter the optimized cell density is, the will remain unchanged. Moreover, the design area
 more important the material is. Moreover, this and the nondesign area are divided according to this,
 should be retained when redesigning the convex and and the pink area of the concave mold is determined
 concave mold structure [24]. As it tends to 0, it can as the nondesign area. Furthermore, the blue part is
 be determined according to the analysis of the the design area, the light color of the punch is the
 convex and concave structure. Therefore, the design nondesign area, and the dark color is the design area.
 area and nondesign area should be selected when The boundary conditions are as described above.
 designing optimization variables.
 (3) Trial calculation
 (2) Define optimization goals and constraints
 The preliminary trial calculation is passed, as shown
 Through the numerical simulation of the molding in Figure 12, through the topology optimization
 process of the main body of the car coat rack, the algorithm and through the iterative calculation of
 node number of the stress concentration and de- this process to find the best path for load transfer, to
 formation of the mold during the molding process obtain the optimal solution for topology optimiza-
 are obtained. Moreover, the number and displace- tion, and thus to obtain the best distribution of
 ment values with time change are obtained by ap- convex and concave mold materials.
 plying LS-Prepositi postprocessing. Export as a .txt
 (4) Topology optimization results
 file, and define the corresponding node displacement
 load in Hyperworks according to these results, in After the lamination calculation, the topological
 order to optimize the mold design. Figure 9 shows results of the die and punch of the die are obtained.
 the nodal displacement results derived from the Figure 13 illustrates a topographic cloud image with
 concave and convex molds. a density threshold of 0.2.
14 Advances in Materials Science and Engineering

 Time = 64.05
 Contours of effective stress (v-m) Fringe levels
 Reference shell surface 3.450e + 02
 Min = 2.47294, at elem# 13429 3.165e + 02
 Max = 345, at elem# 92439 2.879e + 02
 2.594e + 02
 2.308e + 02
 2.023e + 02
 1.737e + 02
 1.452e + 02
 1.166e + 02
 8.810e + 01
 5.956e + 01
 3.102e + 01
 2.473e + 00
 (a)
 Contours of effective stress (v-m)
 Reference shell surface Fringe levels
 3.441e + 02
 Min = 0.457014, at elem# 536714
 3.155e + 02
 Max = 344.093, at elem# 490044
 2.868e + 02
 2.582e + 02
 2.295e + 02
 2.009e + 02
 1.723e + 02
 1.436e + 02
 1.150e + 02
 8.637e + 01
 5.773e + 01
 2.909e + 01
 4.570e – 01
 (b)

Figure 9: Derived node displacement result graph. (a) Nodal displacement results derived from the die. (b) Nozzle displacement results
derived from punch.

 (a) (b)

Figure 10: Boundary condition diagram of the upper die definition. (a) The upper die defines the boundary conditions. (b) The upper die
defines the boundary conditions.
Advances in Materials Science and Engineering 15

 (a) (b)

Figure 11: Boundary condition diagram of the lower die definition. (a) The lower die defines the boundary conditions. (b) The lower die
defines the boundary conditions.

 Contour plot
 Displacement (mag)
 Analysis system
 5.865E – 05

 3.000E – 06

 2.625E – 06

 2.250E – 06

 1.875E – 06

 1.500E – 06

 1.125E – 06

 7.500E – 07
 Y
 3.750E – 07
 Z X
 0.000E + 00
 Max = 5.865E – 05
 Grids 58850
 Min = 0.000E + 00
 Grids 16971
 (a)
 Contour plot
 Element stresses
 (2D & 3D)(vonMises)
 Analysis system
 2.328E + 09

 5.000E + 06

 4.375E + 06

 3.750E + 06

 3.125E + 06

 2.500E + 06

 1.875E + 06

 1.250E + 06
 Y
 6.250E + 05
 Z X
 0.000E + 00
 Max = 2.328E + 09
 3D 360075
 Min = 0.000E + 00
 3D 454673
 (b)
 Figure 12: Continued.
16 Advances in Materials Science and Engineering

 Contour plot
 Displacement (mag)
 Analysis system
 2.721E – 03

 8.000E – 04

 7.000E – 04

 6.000E – 04

 5.000E – 04

 4.000E – 04

 3.000E – 04

 2.000E – 04
 Z
 Y 1.000E – 04
 X
 0.000E + 00
 Max = 2.721E – 03
 Grids 16134
 Min = 0.000E + 00
 Grids 76670
 (c)
 Contour plot
 Element stresses
 (2D & 3D)(vonMises)
 Analysis system
 Simple average
 1.103E + 02

 3.000E + 00

 2.625E + 00

 2.251E + 00

 1.876E + 00

 1.501E + 00

 1.126E + 00

 7.515E – 01
 Z
 Y 3.768E – 01
 X
 2.002E – 03
 Max = 1.103E + 02
 Grids 67460
 Min = 2.002E – 03
 Grids 64993
 (d)

Figure 12: Preliminary calculation results. (a) Calculation result of upper die displacement. (b) Calculation result of upper mold equivalent
stress. (c) Calculation result of lower die displacement. (d) Calculation result of equivalent stress of lower die.

4.2.3. Redesign of the Convex and Concave Mold Structure. By optimizing the topology of the convex and concave
According to the topological optimization of the optimal mold structure of the automobile coat rack compression
path of the material distribution, the topological shape of the mold, the optimized design results of the convex and
model can be obtained. Through the OptiStruc-OSSmooth concave mold structures of the automobile coat rack mold
program, the IGES general CAD file is exported and fed back are obtained. After the CATIA volume measurement, the
to CATIA. The CATIA software is used to reverse the convex optimized design of the convex and concave mold can meet
and concave mold structure to obtain the topology. Fig- the strength and on the premise of stiffness, weight loss was
ure 14 presents the optimized convex-concave structure. 15.6%.
Advances in Materials Science and Engineering 17

 Contour plot
 Element densities
 (density)
 1.000E + 00
 Design : iteration 2
 8.900E – 01

 7.800E – 01

 6.700E – 01

 5.600E – 01

 4.500E – 01

 3.400E – 01

 2.300E – 01

 Y 1.200E – 01
 Z
 X
 1.000E – 02
 Max = 1.000E + 00
 3D 16127
 Min = 1.000E – 02
 3D 429681
 (a)
 Contour plot
 Element densities
 (density)
 Maximum average
 1.000E + 00

 8.900E – 01

 7.800E – 01

 6.700E – 01

 5.600E – 01

 4.500E – 01

 3.400E – 01

 2.300E – 01

 Z 1.200E – 01
 Y

 X
 1.000E – 02
 Max = 1.000E + 00
 Grids 2
 Min = 1.000E – 02
 Grids 33851
 (b)

 Figure 13: Topology optimization morphology. (a) Top mold topography. (b) Topology of the lower die.

 (a) (b)

Figure 14: Optimal design of the convex and concave die. (a) Punch optimization design results. (b) Die optimization design results.
18 Advances in Materials Science and Engineering

5. Conclusion [2] X. Guo, B. Ke, X. Liu, and D. Gong, “Reuse of waste PP glass-
 fiber composite felt,” Shanghai Textile Science & Technology,
The following conclusions are drawn from the present study: vol. 42, no. 4, pp. 18-19, 2014.
 [3] T. Miao, Y. Feng, and R. Zhang, “Multicomponent fibre
 (1) A mechanical model of the composite two-layer composition process effect the properties of automotive
 structure of the main body of the car coat rack is coatrack,” Journal of Wuhan Textile University, vol. 30, no. 3,
 established. By solving the model, it is found that the pp. 30–34, 2017.
 main factors affecting the mechanical properties of [4] R. Yu, Research on Key Technologies of Nonwoven Fabric Hot
 the composite two-layer structure are the thickness Molding, Soochow University, Suzhou, China, 2016.
 of the PP glass fiber sheet and the content of glass [5] C. Shao, Research on Compression Molding Technology of
 fiber. The process parameters of the molding of the Hatchback Door Plate with Glass Mat Reinforced Thermo-
 main body of the hat rack are prepared: the sheet plastics, Jilin University, Changchun, China, 2015.
 preheating is performed by convection with hot air; [6] E. Demirci and A. R. Yildiz, “An investigation of the crash
 performance of magnesium, aluminum and advanced high
 the temperature of the hot air is 250°C; the pre-
 strength steels and different cross-sections for vehicle thin
 heating time is 110 s; the molding pressure is 13 MPa; walled energy absorbers,” Materials Testing, vol. 60, no. 7-8,
 and the holding time is 80 s. Using the experimental pp. 661–668, 2018.
 method, the average shrinkage rate of the material is [7] M. Li, P. Xue, M. Jia, and K. Chen, “Research development of
 calculated to be 0.354%, and the shrinkage rate of the processing technology of fiber-reinforced thermoplastic resin
 solidification and cooling of the product is com- composites,” China Plastics Industry, vol. 44, no. 11, pp. 5–11,
 pensated by error compensation. 2016.
 (2) Aiming at the current empirical design of mold [8] J. Wang, C.-y. Fu, Y. Yu, J. Yanagimoto, and W. Zhu, “Effect
 of temperature on formability of glass mat reinforced ther-
 designers, a lightweight design process for molding
 moplastic sheets with ductile dummy sheets,” Journal of
 molds for interior parts is proposed. The LS-DYNA
 Central South University, vol. 26, no. 4, pp. 779–786, 2019.
 finite element program is used to simulate the [9] M. Fellah, K. Draiche, H. M. S. Ahmed et al., “A novel refined
 molding process to obtain the actual working con- shear deformation theory for the buckling analysis of thick
 ditions. Under the stress concentration area of the isotropic plates,” Structural Engineering and Mechanics,
 mold, the nodal force information with large de- vol. 69, no. 3, pp. 335–345, 2019.
 formation is obtained. Therefore, the load mapping [10] J. Hartikainen, M. Lindner, T. Harmia, and K. Friedrich,
 is used as the boundary condition of the next mold “Mechanical properties of polypropylene composites rein-
 topology optimization. forced with long glass fires and mineral fillers,” Plastics,
 Rubber and Composites, vol. 33, no. 2-3, pp. 77–84, 2004.
 (3) A mathematical model for SIMP material interpo-
 [11] Y. Wang, Z. Zhu, L. Tang et al., “Research on the molding
 lation optimization of the male and female molds is design and optimization of the molding process parameters of
 established. Based on the variable density method, the automobile trunk trim panel,” Advances in Materials
 OptiStruct software is used to design the male and Science and Engineering, vol. 2020, Article ID 5629717,
 female molds of the main body of the automobile 19 pages, 2020.
 coat rack compression mold. The weight of the mold [12] Y. Zhu, H. Lu, and G. Dai, “Study on preheating technology
 is reduced by 15.6%, while ensuring the structural for GMT thermoplastic sheet,” China Plastics Industry, vol. 3,
 rigidity and strength of the mold. pp. 35–37, 2000.
 [13] M. J. Song, K. Kwon-Hee, and H. Seok-Kwan, “Simulation-
Data Availability based optimization of cure cycle of large area compression
 molding for LED silicone lens,” Advances in Materials Science
The data used to support the findings of this study are in- and Engineering, vol. 2015, Article ID 573076, 11 pages, 2015.
cluded within the article. [14] E. Demirci and A. R. Yıldız, “An experimental and numerical
 investigation of the effects of geometry and spot welds on the
 crashworthiness of vehicle thin-walled structures,” Materials
Disclosure Testing, vol. 60, no. 6, pp. 553–561, 2018.
 [15] V. Goodship, I. Brzeski, B. M. Wood et al., “Gas-assisted
This paper is part of the major projects of the “The University
 compression moulding of recycled GMT: effect of gas in-
Synergy Innovation Program of Anhui Province (GXXT- jection parameters,” Journal of Materials Processing Tech-
2019-004) and the project of the “Teaching Research Project nology, vol. 214, no. 3, pp. 515–523, 2014.
of Anhui Education Department (2019jyxm0229).” [16] H. Li, Research on Topology Optimization Methods of Con-
 tinuum Structure Based on Variable Density Method, Huaz-
Conflicts of Interest hong University of Science and Technology, Wuhan, China,
 2011.
The authors declare that they have no conflicts of interest. [17] S. V. Patankar, Numerical Heat Transfer and Fluid Flow, CRC
 Press, Boca Raton, FL, USA, 1980.
References [18] LS-DYNA, Keyword User’s Manual, Material Models, II,
 Livermore Software Technology Corporation (LSTC), Liver-
 [1] J. Zheng, Y. Wei, and Z. Wei, “Rear window trim stiffness more, CA, USA, 2014.
 research on hatchback vehicle,” Industrial Technology Inno- [19] M. Stolpe and K. Svanberg, “An alternative interpolation
 vation, vol. 3, no. 3, pp. 510–513, 2016. scheme for minimum compliance topology optimization,”
You can also read