Understanding the Relationship between Corporate Facebook Pages and Stock Price Activity
←
→
Page content transcription
If your browser does not render page correctly, please read the page content below
Understanding the Relationship between Corporate
          Facebook Pages and Stock Price Activity
                                              by
                                        Nathan Tennant

                                               Abstract
For Fortune 500 companies, social media has become a major form of communication and point
of access to reach potential customers, employees, and shareholders. Past studies have outlined
the activity of traditional media publications and the effect they have on influencing stock prices.
These journal articles, whether positive or negative, have been found to relate to both an increase
in trading activity as well as a correlated change in a firm’s stock price. As social media becomes
a leading source of media and outlet of conversation, it is important to compare how electronic
media relates to traditional media. As firms build social media into marketing and
communication strategies it is equally as important to understand the risks and potential issues
that may arise. Corporate Facebook pages are a major target for complaints, which companies
need to decide how to best manage to maintain target levels of customer satisfaction which can
be a driver in financial performance. For this study I have developed a statistical model to
analyze the relationship between the number of posts and associated user activity on a Facebook
fan page and the performance of a stock price across one fiscal quarter. The results were not able
to systematically prove that Facebook activity can be used as a predictor of financial
performance. Future studies have the opportunity to build on this research and examine
additional factors that may provide insight in the relationship between social media and market
activity.

Key words: social media, stock prices, Facebook, investor perception, social interaction

Submitted under the faculty supervision of Professor Yuqing Ren, in partial fulfillment of the
requirements for the Bachelor of Science in Business, magna cum laude, Carlson School of
Management, University of Minnesota, Spring 2013.
Section 1: Introduction

       Social media can be used by a company for a variety of purposes, whether it is

connecting with potential employees, advertising an event, promoting a new product, or other

reasons, it has become a vital form of communication. Additionally, consumer’s use of social

media provides increased interaction and access to information about a company, and creates a

platform on which a community of users with similar interests. The combination of public and

corporate use has allowed social media to become a major source of communication for Fortune

500 firms, in 2011 58% of companies had Facebook pages and 62% had corporate accounts on

Twitter (Barnes & Andonian, 2011). With this increased public interaction it is important for

management to set policies and guidelines for corporate social media posts to mitigate the

potential of a social media crisis. Some of the most famous of these include, the “Dirty Domino’s

Pizza” video or “United Breaks Guitars”, both of which caused damage to the company image.

This damage requires time and strategy to rebuild as well as financial resources in maintaining a

customer base. These events can not only play a role in brand image but also affect how the firm

performs in financial markets.

       Research has shown that traditional media, in the form of newspapers, magazines, and

other publications, has had an influence on stock prices. With the increased usage of social

media, it is likely that many of the same relationships exist between media and financial market

activity. While it can be difficult to determine a specific return on investment of social media, it

is important to look at how the online interaction of companies and stakeholders affects the value

of a firm’s stock prices. Before starting a social media site, management must consider how their

actions will be perceived by not only the general public but also investors and financial markets.

                                                                                                       2
In a 2010 study, Tina McCorkindale examined the activity of the Fortune 50’s Facebook

pages to better understand how organizations were using the site and found that most of the

organizations had begun using Facebook, but were not utilizing it to the fullest extent. Over the

past three years there have been many changes to the interface of Facebook, in switching from

“Walls” and “Member Pages” to the current “Timeline” and “Fan Page”, but the same goals

remain intact for companies. The importance of electronic communication has become critical;

management must consider how they will use it across different levels of the company. One area

that is relatively new for social media use is investor relations as many companies have released

earnings announcements via Twitter and Facebook. A recent example of this can be seen through

the activity of a company called Zillow, an online real estate site, which has decided to release its

2013 first quarter earnings on through an online webcast. (GlobeNewsWire, 2013). Not only will

the earnings be released, but the company will answer questions via the official Facebook Fan

page and Twitter handle. These channels bring additional risks, as investors spend time on social

media sites; they have become a source of “material” information, including, earnings reports

and acquisition announcements, which previously were released through formal press releases

and filings (Kopytoff, 2013). The SEC requires that companies tell investors ahead of time if

they plan to use of social media for these key announcements to avoid fraud and hackers posting

false information, which has become a major source of concern firms.

       The financial market system is built around the interpretation of what is considered

“novel information”; this term is loose in what it includes and how the information is

disseminated through stock market agents in changing security prices (Chen, De, Hu, and

Hwang, 2011). It can be very easy for companies to promote a positive earnings release across

social media and quickly inform a large group of people. Just as easily a poor earnings report can

                                                                                                    3
spread across the internet in a matter of minutes, whereas in the past it would have taken a Wall
Street Journal article or similar publication much longer to circulate. New technology has
allowed media channels to operate with increased speed and intensity, as well as provide
potential investors with increased access to information on which they can make financial
decisions.
In addition to an outlet for information to investors, Facebook provides the ability for
companies to interact with potential and current customers. Done correctly and effectively this
may lead to increased revenue. While not tied directly to stock price, revenue is an important
measure of financial performance and used to analyze the firm’s share value. It is through this
connection that Facebook activity and increased usage has an opportunity to relate stock price. If
a firm does a superior job of responding to customer posts on a fan page or providing promotions
it may lead to a competitive advantage over other firms. Equally as important, if a firm is not
utilizing a Facebook page they may not be fully reaching a segment of the market and miss out
on revenues based on a lack of activity. Considering that stock prices are based on perception
they have the potential to reflect this activity and performance.
This study looks specifically at the volume of posts and the associated responses from a
company’s Facebook fan page and its relation to the stock prices of the firm over the course of a
fiscal quarter. These posts can contain a wide range of information, including but not limited to,
a company may post about a new product, upcoming sale, or something related to current events.
This research attempts to determine a correlation between the volume of these posts and a
percentage of increase (decrease) in stock price. The goal is to understand how social media is
perceived by investors and whether having a more active social media presence is important to
brand valuation. I hypothesize that this will be a positive relationship to the value of the firm,
4based on the idea that these posts will contain positive information surrounding the activity of
the company. In order to conduct this study I have gathered data from the activity on a Facebook
fan page as well as stock market activity.
There have been past studies that analyze the media affecting stock prices and trading
volumes. When looking specifically at social media, researchers have dissected social media
down to the post level and coded the overall sentiment of activity to examine how the stock
market reacted. My contribution to original research will be identifying the quantitative
relationship between post volume and percent of change in stock returns, as well as comparing
total post volumes between three different industries. This is a valuable study in understanding
the transition from traditional forms of media, such as newspapers and magazines, to social
media and how they play a role in affecting stock price.
Firms spend large amounts of money in managing public relations and how the public
perceives everything from daily operations to corporate social responsibility. Posts on a
Facebook fan page attempt to shed a positive light on a company and its activities. Doing this
effectively, can result in internet buzz, and brand recognition that may increase sales. Companies
try to use social media as a source of positive interaction with customers and shareholders
through the forms of “Likes, Shares, and Comments”, which may be used on other social media
sites but for this study they are specific terms surrounding the activity on a Facebook fan page.
On the following page, there is an example of a Facebook fan page, from Wells Fargo.
5Figure 1.1 – Example Facebook Fan Page
In addition to providing basic information, pictures, and interactive content, the fan page
is used to post from the voice of the company. In Figure 1.2 there are multiple posts by Wells
Fargo, covering various topics, including promoting an internship program and encouraging
women’s leadership in business. These posts are often tailored to a specific group, with the goal
of initiating interaction through likes, comments, and shares. While many posts do not have a
direct tie to financial performance or company earnings, they are a representation of the
company image and brand which ultimately play a role in how investors perceive a company
stock.
6Figure 1.2 – Facebook Fan Page Post Examples
When choosing how to utilize a Facebook fan page, firms additionally have the decision
of allowing outside users to post on the “Timeline”, which is a publicly visible area for
comments, complaints, or any other information and also the same place where company posts
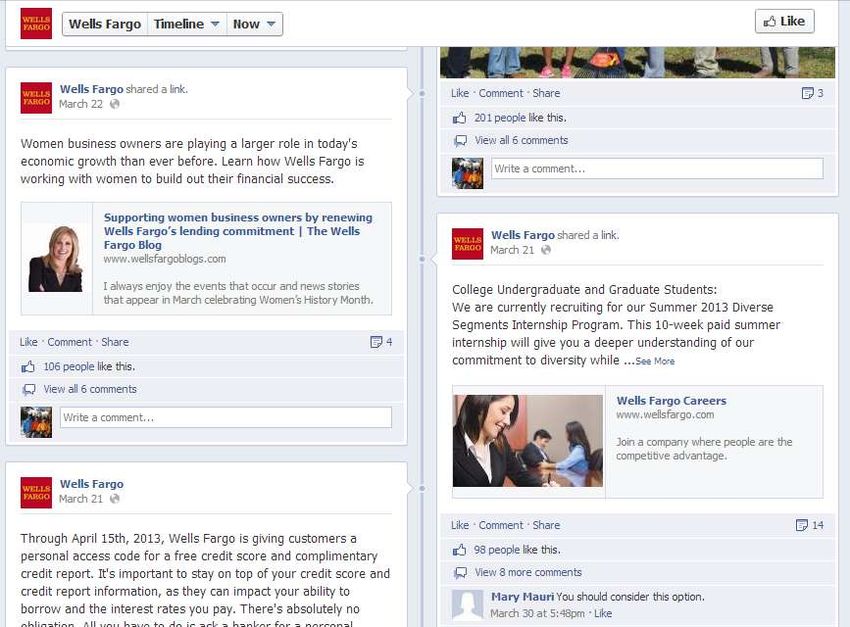
appear. Figure 1.3 below, shows the Discover page and a side by side image of both a company
post and various user posts on the right side of the page. This decision alone is one that is
important for companies when building an online presence and presents an opportunity for
compliments or positive comments from Facebook users but also makes the company vulnerable
to spam and other postings that may be crowd the page.
7Figure 1.3 – Sample Non-company Posts on Corporate Fan Page
This study will examine outside posts in order to analyze whether user posts are also
related to an increase in stock performance. Additionally the collection of likes, shares, and
comments across all posts for a fiscal quarter will attempt to capture the volume of interaction
with outside users.
As social media becomes continually more of a necessity for firms, it is important to first
understand how the activity on a Facebook page relates to investor’s perception of firm
performance. For certain firms this may require a more strategic plan surrounding social media
posts and connecting the right information to shareholders and managing the brand image
represented in the media. This study will look at a selection of firms and determine whether the
relationship between social media and stock price can be useful as a predictor of financial
performance. This information can be valuable to corporate management teams as they seek to
understand the value of social media. Given the results and relationship of Facebook activity and
stock performance, there is potential to minimize a decrease in stock price and attempt to
capitalize on positive activity. It is also valuable to utilize capital most effective and make
decisions around time and effort placed around social media promotion. As practices such as Big
8Data analytics become more and more widespread, the information from within social media
becomes more attainable and practical. Currently social media activity is difficult to analyze but
with the addition of speed and accuracy in coding trends on Twitter, Facebook, and other sites,
this information could be used for crucial decisions by companies and investors alike.
Section 2: Literature Review
Stock prices have long been a measure of firm performance and many studies have
examined the different variables that can affect them. The efficient market hypothesis assumes
that financial markets operate based on all past publically available information and provide
unbiased indications of firm performance. With the rapid growth of technology use, investors
now have more information and they receive it in a timelier manner. The internet can be seen as
an extension of traditional forms of media and prior studies have evaluated the effect of media
coverage on stock price. The recent development of social media in the corporate environment
presents another opportunity for media to affect stock returns as recent studies have shown that
many companies have engaged in online interaction through platforms of Facebook, Twitter,
YouTube, and many others.
2.1 Media’s impact on stock prices
Past research studies have identified correlations between stories reported by the media
and stock market reactions. There have been studies around the influence of Facebook in various
dimensions but most of them analyze the idea of privacy, impact on professionalism, or ability to
connect to specific target customers (Timian, Sonia, Kachnowski, and Paloma, 2013). Engelberg
9and Parsons (2011) studied the causal relation between traditional media and market activity
comparing public stock information of S&P 500 firms, trading data by Barber and Odean (2000),
and the major news sources of 19 U.S. major cities. They found that the reporting of an event by
a local newspaper stimulated trading activity of the stock. The results of this study show that
local media’s coverage of an event strongly predicts local trading activity, but did not analyze
whether the value of the stock went up or down. In addition to this it has also been shown that
published opinions in The Wall Street Journal are found to correlate to higher trading volumes
(Liu, Smith & Syed, 1990). In the past The Wall Street Journal was a primary source of
information, today there are many online sources that provide similar articles and information.
The study found that on publication day the reaction of stock prices followed the
recommendations of the publisher. Additionally, the search capabilities of Facebook and Twitter
provide quick access to content and opinions. For some investors, these sources are major
sources of information for the basis of choosing what to purchase and/or sell. Effectively
utilizing current news and media publications is important to staying up to date with market
activity.
In terms of internet media, a study of the U.S. pharmaceutical industry was able to
estimate the perceived importance of the use of internet marketing by analyzing two groups of
firms and their respective stock returns. This was done through an experiment by Jambulingham
and Sharma (2010), which examined the returns of firms across the pharmaceutical industry in
the weeks following the release of a publicly available FDA warning. One group of firms
received a letter from the FDA, while the other group did not receive a letter. The letter was sent
to firms that had violated the FDA’s fair balance rules through the use of online paid search
banner ads. Both groups of firms saw a significantly negative stock market reaction, which
10signals that information of these letters and the reaction of the market show that stakeholders
view the use internet marketing as important to the firms’ value. The authors of this study
suggested that it was important for the industry and the FDA to work in collaboration around the
use of internet marketing to prevent future decreases in stock performance (Jambulingam &
Sharma, 2010). This relates to my study in the idea that firms may use Facebook as a source of
internet marketing material, thus it is a potential concern for investors in analyzing strategic
decisions of the company.
One of the most valuable aspects of social media is the instantaneous updates and
opportunity for information to spread at an unprecedented speed, which can provide investors
with access information as well as the response to information, which would have taken much
longer through traditional publications (Luo, Zhang, and Duan, 2013). Social media allows for
shareholders to investigate beyond financial metrics published in earnings statements or annual
reports and see what customers and the general public is saying about a firm. This information
has the potential to serve as an important factor in predicting firm equity value. In an analysis of
the social media platform Seeking Alpha, which is popular among investors, Chen, De, Hu, and
Hwang (2011) were able to show that there was a larger impact on stock performance from
social media activity than traditional media, such as newspapers. Traditional media has been a
factor in determining stock prices but with the increasing trends of social media usage, the effect
of Facebook activity on firm valuation remains an open question.
2.2 Social media usage
Companies can use social media for advertising; the effectiveness of this advertising
depends on the user’s attitudes and perception of the firm’s content. This can be a valuable form
11of communication to build customer satisfaction, which was found to have to have a positive
association with shareholder value as well as a firm’s ability to create shareholder wealth
(Anderson, Fornell, and Mazvancheryl, 2004). In a study of variables of the effectiveness of ads
on social media it was determined that the most important factor was the offering of
entertainment or informational value (Lewin, Strutton, & Taylor, 2011). Utilizing Facebook as a
source to distribute information has benefits to companies, in the ability to quickly share with a
large user base for little or no cost at all. As social media becomes a method of acquiring
information as it is indexed within search engines, it will likely play an increased role in the
financial markets.
The use of social media by corporations is evident across many industries. The study of
Barnes and Andonian (2011) found that in comparison to the last four years, the adoption rate of
social media sites by Fortune 500 companies seems to have leveled off or decreased. This is
evidence that many companies have used social networking sites and it has become a common
form of communication. Social media sites have been analyzed as a form of media outlet and a
useful source for predicting customer satisfaction levels. In one particular study of New York
Facebook fan page activity of New York hospitals, it was found that the number of “Likes” on an
existing page could be correlated to the patient satisfaction and quality of treatment (Timian et al.
2011). While many studies produce a textual analysis and decode social sentiment across sites,
this study took a quantitative approach to determine if a “Like”, which is traditionally a positive
indicator, can be correlated to other forms of quality reviews. This study is valuable in
determining how effective and representative social media is compared to other forms of
recognition for performance. As the adoption of social media by both corporate and non-
12corporate users becomes more relevant, these relationships become more important in
understating the implications of a Facebook page.
2.3 Gap in research to be addressed – the implication of volume of posts
The research to date on the effect of media on stock performance has yet to fully consider
the increasing role of social media in communicating with investors and connecting with
customers. With the vast amount of activity on social media sites, it can be difficult to
understand how a firm can benefit from what they put out as a company or how they interact
with online users. This study will seek to target the relationship between the number of posts on
a corporate Facebook page and how a company performs in the stock market to understand
whether the two have a positive correlation. As adoption and participation increases this
relationship becomes valuable to both investors who seek to target high performing stocks as
well as companies who take value from understanding how Facebook activity can represent the
brand image of the business.
Section 3: Methodology
Predicting stock performance through the use of a statistical model is a challenging task
and requires constant attention in order to identify trends and patterns. These patterns are
valuable to both management as well as investors who seek financial gains based off predicting
explanatory variables that may lead to an increase or decrease in market prices. In the past,
media including newspapers and television coverage of events have been found to affect a firm’s
stock activity. Engelberg and Parsons (2011) found that local newspaper coverage strongly
13predicted local trading while controlling for other market factors. The idea that media can cause
fluctuation within the stock market is important to consider when researching new forms of
media, beyond newspapers. While this study will not predict trading volumes, as many have
examined in the past, it will seek to find a correlation between financial performance based on
firm stock returns and social media activity.
The recent increase in usage of social media in the corporate environment presents
another opportunity for media to affect stock returns. Post volumes are important in showing
activity and usage levels on a corporate Facebook page. Firms that post too often may lose
Facebook fans due to annoyance, and firms that post too little risk missing out on the opportunity
to interact and converse with potential customers. This study will analyze this relationship across
three different industries and determine the impact of social media activity to relative to each. It
is expected that social media usage is more important to certain industries than others due to the
clientele and viewers interested in what a company may post. For example a retail company may
need to actively respond to user complaints and publish promotions while an insurance company
deals with a more complicated product lines with more personal information and the nature of
complaints may come to the customer service department instead of being posted on a Facebook
fan page. Building on existing literature this study will attempt fill a gap in understanding how
the activity on Facebook relates to the perceived performance of the company through the eyes
of investors by looking at the stock price. It is challenging to analyze the meaning of social
media activity and this research will look at solely the volume of activity, in both content and
user reaction through likes, comments, and shares, but can be used as a foundation for
understanding online interaction between companies and Facebook users. This study will also be
14valuable in understanding the sensitivity of social media to financial markets and how this differs
between various industries.
3. 1 Hypothesis Statements
While examining the effect of Facebook activity it is necessary to think about what online
interaction between a brand and customer or potential customer may involve. From a corporate
stand point, an online post may be used to stimulate a conversation and create internet buzz. A
customer may post to a corporate Facebook page for numerous reasons, such as complaining
about a brand or product. Past studies have conducted textual analysis of both traditional media,
articles published in the Wall Street Journal, and social media site Seeking Alpha and found that
the effect of the article’s connotation correlated to stock returns and found a greater correlation
to social media press releases than that of traditional media articles (Chen, Hailiang, P. De, Yu
Hu, and Byoung-Hyoun Hwang. 2011). While, this study will not analyze textual sentiment it
will similarly attempt to show that company posts and the associated likes, shares, and comments
on a fan page have a positive correlation to stock returns. Similar to the idea of “No press is bad
press” and that past media has been shown to influence stock market activity; my hypotheses
predict that greater Facebook activity will correlate to positive stock performance. While the
content of these posts may not relate to financial performance, when a company posts on
Facebook, they are interacting with a user base, which is a positive signal to increasing customer
satisfaction and should ultimately relate to stock price through increased revenues and profits.
Given this idea my first hypothesis states the following:
H1: There is a positive correlation between volume of Facebook posts posted by a
company and an increase in stock price across one fiscal quarter for a sample of firms.
15For the purpose of this study, “Social Likeability” will be an additional measure,
provided through the volume of aggregated “Likes”, “Comments”, and “Shares” on company
posts. This measure is hypothesized to also show a positive relationship to stock performance.
“Likeability” is important in developing activity and spreading information across social media
platforms. This second hypothesis will be run through the same regression equation as the first.
H2: There is a positive correlation between increased “Social Likeability” and an
increase in stock price across one fiscal quarter for a sample of firms.
In addition to examining the relationship between all of the firms in my sample I will
compare the strength of the correlation of the relationship across three industries. Due to the
nature of the finance industry and past history of relatively low levels of customer satisfaction I
believe this relationship will be the strongest correlation between post volume and an increase in
stock price. This is based on the idea that Facebook has provided financial firms with a medium
for communicating and interacting with shareholders as well as visibility into the brand. Social
media provides an easy point of access to attempt to reach out to customers and manage
complaints. Compared to financial services, I believe that the retail industry, while still having a
positive correlation, will be weaker due to the fact that its business is likely more diversified
across different product lines and segments. The retail industry is one that has typically been
very oriented around customer satisfaction and has many outlets to deal with the issues of
consumer. Thus, I believe that social media posts will not be as critical to the success of retail
firms firm in the stock market. In between these two industries I think that the healthcare
industry will also be positively correlated but less than that of finance and more than the retail
industry. This is due the complex product line of the insurance and healthcare industry versus
traditionally more simple retail purchases, both of which potentially do not have the low levels of
16satisfaction found in banking and financial services. Hypothesis three will also be included in the
first regression equation and utilize an interaction variable to analyze the correlation strength
comparatively across the three industries.
H3: The positive relationship between Facebook posts and stock price will be stronger
for firms in the finance industry relative to Healthcare; similarly the positive
relationship between posts and stock price will be stronger for firms in healthcare
relative to retail.
The fourth hypothesis in this study will follow the same approach as the first two, but
will use the volume of posts on a Facebook page posted by external users instead of the
company. Within this study, this will be a relatively small sample size but will seek to determine
whether this can be used as an additional measure in determining the correlation of social media
activity and stock price.
H4: There is a positive correlation between increased non-company posts and an
increase in stock price across one fiscal quarter for a sample of firms.
3.2 Data collection and Measurements
In order to examine the relationship between stock price and volume of Facebook posts
on a corporate fan page, I selected a sample of firms across three different industries. This
sample includes publicly traded firms within the Fortune500, categorized in financial services,
healthcare and insurance, and retail. These three industries were selected based on identified
categories by Fortune in the 2012 Fortune500 list. The sample was selected based on availability
of data and usage of Facebook fan pages with 15 firms from the financial services industry, 18
from the retail industry, and 12 from the healthcare and insurance industry. This sample is
17representative of the Fortune500 and takes into account ranking within the top 500 by controlling
for 2011 annual revenue, but does not include firms that do not use Facebook pages or full firm
listings within each industry category. Historical stock prices will be compared against the
activity on each of the companies’ primary Facebook fan pages.
In order to test the independent variables, post volume on a corporate Facebook page and
the associated likes, shares, and comments, I will use data collected with the assistance of
Professor Yuqing Ren. Through the use of a developed software script, data was downloaded for
each post, which was grouped by where the post came from (company or outside user) as well as
how many Facebook users clicked like, shared, or commented within a selected time period. This
code was developed to work with Facebook’s API (Application Programming Interface) in the
programming language of C-Sharp. The data was then stored in a series of tables in a MySQL
database. The goal of pulling all Facebook posts is to identify a relationship with the
performance of the firm. In addition to the post volume, I have also aggregated the likes, shares,
and comments for total posts in order to examine whether the post volume itself or the
interaction related to posts is more closely related to the change in stock price. My research will
attempt to show how the activity on stock price is affected by the social media activity of a firm
in both by volume of posts as well and determining how the relationship differs by industry.
Using a multiple regression model, I have determined the effect of the independent
variable, change in post volume along with a categorical variable for the industry type of a firm,
on the dependent variable which is change in stock price for the firm. The firm stock price will
be evaluated based on the change in stock price value as provided by Yahoo! Finance for fiscal
quarter two (Q2) of 2012 which was Sunday, April 1 to Saturday, June 30. For this study I will
use the opening price of the stock as of Monday, April 2, as it is the first business day of the
18quarter and the close price of Friday, June 29 as it is the last business day of the quarter.
Subtracting these two values and dividing by the opening Q2 price will give me the percentage
of increase (or decrease) in stock price across the duration of Q2 and signify the performance of
the firm. Quarter two was chosen based on data availability and the relatively low level of
seasonality. The retail industry is highly seasonal around the time period that lies within both Q4
and Q1, thus Q2 seemed to be an appropriate timeframe when comparing the returns across
multiple industries. Since not all of the firms in the selected sample follow the same quarterly
filing schedule, it was chosen to control for profit and earnings of the previous year, as stated by
Fortune in the Fortune500 listing. This provides a control for the size of the firm in terms of
revenue as well as gives an additional control for financial performance based on profits.
My methodology relies on multiple assumptions because it uses stock price data. This
assumption limits the study to public firms and also does not take into account major events or
incidents for companies that may not be relative to social media activity. As stocks may be
affected many different events, this study uses a financial Beta value, provided by Yahoo!
Finance in order to control for stocks that may tend to be more volatile. This beta value is used to
benchmark the volatility of a stock compared to the overall financial market activity. Building
this control into the regression equations attempts to ensure firms stock activity is representative
of firms with various past return levels.
I am also limited in the way that my results can be applied due to the fact that I am using
a volume calculation for Facebook post correlation. Using the volume of posts, does not take into
account the subject matter or provide any insight into the textual analysis of the posts. The same
issue is seen when counting the number of comments on company posts; some of these can be
unrelated to business activity or the brand at all. This study looks to examine whether quantity
19alone is important in creating social media buzz and whether that has any implication on
financial performance. Another limitation in my study is that many companies have multiple
Facebook pages, for different business segments or specific products. I have arbitrarily chosen
one, that I consider the main online presence for the brand. The URL of these Facebook pages
can be seen in Appendix A. While making this decision it was generally clear what Facebook fan
page best represented the firm as a whole, although it may not be the most active, it is likely
where Facebook posts relate most to the firm specifically.
3.3 Analysis
My five hypotheses will be tested across two multivariate regression models and I will
attempt to reject the null hypothesis that there is no effect on stock price in relationship to
Facebook post volume by both the company and outside user posts. In testing my first two
hypotheses I will be testing for a coefficient value greater than zero in its correlation to the
response variable. The regression model below compares the coefficients between the amounts
of company posts, likes, shares, and comments on a firm’s Facebook page coded with a
categorical variable for three different industries.
Regression Equation 1:
20The second regression equation follows a similar approach to the first, but will analyze
the relationship of user posts instead of company posts compared to the response variable of
change in stock price. This relationship is also predicted to be positively correlated and will use
the same control factors of firm stock beta, 2011 annual revenue, and 2011 annual profit.
Regression Equation 2:
Figure 3.1 outlines the five hypotheses as well as the associated value from the
regression equations above.
Figure 3.1 - Hypothesized Results
Hypothesis Correlation to Increase in Stock Coefficient
Price
Equation 1
H1 – Company Posts Positive
H2 – Social Likeability Positive
H3 – Industry Relation Positive
Coefficient value:
Financial > Insurance > Retail
Equation 2
H4 – Non-company Posts Positive
213.4 Appropriateness of Methodology
While testing the relationship between social media and financial market performance of
a firm, it is difficult to take into account the large volume of factors that can affect the model.
This methodology is appropriate because it separates out a measurement of post volume and
compares it to firm performance across one fiscal quarter. The idea behind looking at one quarter
is that all firms should have faced similar market conditions. Taking a beginning value and end
value limits the ability to account for day-to-day stock fluctuations but allows for a comparison
of one time period across multiple firms. The regression model is useful in determining how each
of the coefficients is correlated to the stock return change and allows for an interaction to
compare the difference in industries. While this model may only compare three industries it does
analyze 45 companies within the Fortune500 and provide a basis for quantitative analysis of the
volume of Facebook posts by a firm. In the dynamic field of social media it is difficult to
understand the benefits and implications of a corporate social media page as well as an online
presence as a whole. Future studies will look at how not only the quantity of Facebook posts
relate to financial performance, but also dive deeper in understanding sentiment behind each
post.
Section 4: Results
Looking at the relationship between the response variable of stock price to the primary
explanatory variable of company posts, it was clear that many firms took different approaches to
posting on a Facebook fan page. Below, Figure 4.1 shows that there were highly variable post
volumes, ranging from 2 – 362. From the three graphs on the following pages it is also visible
22that 31 of the 45 firms saw a decrease in stock price for quarter two of 2012. For this quarter the
S&P 500 index opened at $1408.47 and closed at 1362.16 which is equal to a 3.29% decrease.
The average firm within this study performed worse than the S&P 500 with a mean stock
decrease of 6.31%. Figure 4.1 shows the summary statistics for all 45 firms across the three
industries. This figure also shows the respective correlations of the explanatory values with the
first regression equation. For the full list of firms used in this study, view appendix A.
Figure 4.1 – Summary Statistics for Stock and Facebook Activity in Q2 2012 for 45 Firms
Coefficient Correlations
Standard
Mean Deviation Minimum Maximum 1 2 3 4
Percent Stock
Change -6.31 11.03 -25.71 24.60
1 Company
Posts 130.31 83.42 2 362 1
2 Total Likes 66575.98 156829.90 6 761982 .607 1
3 Total Shares 5332.16 13153.65 0 53497 .563 .941 1
4 Total
Comments 6295.69 11701.79 0 51121 .644 .962 .918 1
Each of the graphs on the following pages, Figures 4.2-4, plots the percent stock change
versus company post volumes in each of the three industries. Both the retail and financial
industries follow a slight upward trend in stock price as post volume increases, while the
healthcare/insurance industry did not have a trend of increase or decrease in stock price as the
volume of posts went up.
23Figure 4.2 – Retail Industry Percent Stock Change vs. Post Volume
Percent Stock Change vs. Post Volume
30.00%
20.00%
Percent Stock Change in Q2
10.00%
0.00% Retail
0 50 100 150 200 250 300 350 Linear (Retail)
-10.00%
-20.00%
-30.00%
Post Volume in Q2
Figure 4.3 – Financial Industry Percent Stock Change vs. Post Volume
Percent Stock Change vs. Post Volume
10.00%
5.00%
Percent Stock Change in Q2
0.00%
0 50 100 150 200 250 300
-5.00%
-10.00% Financial
Linear (Financial)
-15.00%
-20.00%
-25.00%
-30.00%
Post Volume in Q2
24Figure 4.4 – Insurance/Healthcare Industry Percent Stock Change vs. Post Volume
Percent Stock Change vs. Post Volume
10.00%
5.00%
Percent Stock Change in Q2
0.00%
0 100 200 300 400
-5.00%
Insurance/Healthcare
-10.00% Linear (Insurance/Healthcare)
-15.00%
-20.00%
-25.00%
Post Volume in Q2
In order to analyze the coefficients within the regression model, equation one was run 4
different times to add in additional the variables as a hierarchical regression. The table on the
following page outlines the coefficient and p-values associated with each of the explanatory
variables.
Due to the large range of data for the summed likes, shares, and comments across all
company posts it was necessary to standardize the data to get an appropriate coefficient on the
percent stock change. This was done through by using the level-log model on the summed
values, which means that each of the firm’s values was logarithmically transformed. This model
requires a change in the interpretation of the results, meaning that for every one-percent increase
on an independent variable, there is a predicted change in the dependent variable of the
coefficient value divided by 100. Given that many companies see a proportional amount of like,
shares, and comment, it was also necessary to look at the correlation between the coefficient
values. Referring back to Figure 4.1, it shows that the three items were all correlated with each
25other above 90%. To remove the autocorrelation that was triggered by these three variables, the
regression model was rerun based solely on the volume of total likes on company posts. This
value of total likes was used as a representation of the “Social Likeability” of the firm. Figure
4.5, displays the results of the regression model.
Figure 4.5 – Regression Results of Equation 1
Model 1 Model 2 Model 3 Model 4
2
Adjusted R .110 .101 .075 .049
Intercept 1.099 -2.188 -.074 4.079
(.817) (.730) (.986) (.750)
2011 Revenue – mill .000 .000 .000 .000
(Control) (.190) (.197) (.279) (.260)
2011 Profits – mill .000 .000 .000 .000
(Control) (.878) (.746) (.616) (.604)
Stock Beta Value -5.469 -5.410 -5.892 -6.277
(Control) (.044) (.048) (.039) (.045)
Company Posts .019 .008 .010 -.006
(.342) (.761) (.690) (.885)
Total Likes .578 .367 .268
(Log Transformed) (.431) (.707) (.791)
Financial Dummy 1.891 -4.916
Variable (.685) (.589)
Insurance Dummy -2.456 -4.937
Variable (.649) (.613)
Financial * Comp .053
Posts Interaction (.362)
Insurance * Comp .012
Posts Interaction (.813)
Standard Error 10.404 10.452 10.602 10.755
P-values list in parentheses
The results above show that there was not a systematic meaning and additionally
statistically inconclusive results surrounding company posts and the relationship to firm stock
returns. There were not results with a p-value low enough to reject the null hypothesis that
26correlation of social likeability and stock price change did not equal zero. While the relationship
was hypothesized to show a positive correlation, the results show that the two have a relationship
with a slight negative but near zero correlation. From the above results, the correlation of total
likes and stock price change can be interpreted as for every one percent increase of total likes
there was a .00268 percent decrease in stock price. While this is a small change, it does indicate
that the perceived positive signal of a like or comment may actually not correlate to a change in
stock valuation. The potential reasoning for this relationship will be further analyzed in the
discussion section.
Figure 4.6 outlines the summary statistics for the 32 firms that allowed non-company user
posts on the Facebook fan page, which were used to evaluate hypothesis four.
Figure 4.6 – Summary Statistics for Non-Company Posts of 32 Firms
Note: 32 of the original 45 firms allowed outside user posts on Facebook Fan pages, numbers by
industry category:
16 of 18 Retail firms
8 of 15 Financial firms
8 of 12 Insurance/Healthcare firms
Note: Removed 1 outlier (Target Corporation, 13225 user posts)
Correlation of
Coefficients
Standard
Mean Deviation Minimum Maximum 1 2
1 Company
Posts 130.31 83.42 2 362 1
2 User Posts 883.258 1098.337 2 3705 .142 1
27Figure 4.7 shows a scatter plot of the 31 firms that allow non-company posts. This is followed by
Figure 4.8, which outlines the results for the second regression equation which incorporated the
user posts instead of the company posts but followed the same hierarchical procedure and
controls.
Figure 4.7 – Percent Stock Change vs. Non-company Posts
Percent Stock Change vs. Non-company Posts
30.00%
20.00%
Percent Stock Change
10.00%
0.00% User Posts
0 500 1000 1500 2000 2500 3000 3500 4000 Linear (User Posts)
-10.00%
-20.00%
-30.00%
Non-company Posts
28Figure 4.8 – Regression Results for 31 Firms that Allow Outside User Posting
Model 1 Model 2
2
Adjusted R .110 .095
Intercept -12.515 -10.621
(.164) (.257)
2011 Revenue – mill .000 .000
(Control) (.230) (.209)
2011 Profits – mill .000 .000
(Control) (.898) (.817)
Stock Beta Value (Control) -4.028 -4.012
(.198 (.203)
User Posts **2.581 **4.023
(Log Transformed) (.053) (.092)
Total Likes -1.186
(Log transformed) (.455)
Standard Error 10.952 11.042
P-values list in parentheses
**Denotes p-value at the 90% confidence level
4.1 Summary of Results
Based on results of the regressions it was not possible to find a correlation between
corporate social media activity and stock returns. The results from both regression models show
that all of the explanatory variables, with the exception to non-company posts were inconclusive
in predicting the relationship to a percent change in firm stock price. Figure 4.9 outlines the
results as compared to the hypothesized result. For hypotheses one, two, and three the results
were unable to reject the null hypothesis of the coefficient of company posts, social likeability,
and user posts were greater than zero. For hypothesis four it was possible to reject the hypothesis
that the coefficients of company posts separated by industry were not different than zero.
Because the non-company posts were logarithmically transformed the coefficient value of 4.023
needs to be divided by 100 to interpret the relationship in the response variable. After doing so it
29can be said that for every one percent increase in non-company posts, the firm can predict to see
a .04% increase in stock price.
Figure 4.9 – Results According to Hypothesis
Hypothesis Hypothesized Correlation to Hypothesized Result
Increase in Stock Price Coefficient
Model 1
H1 – Company Posts Positive
H2 – Social Likeability Positive
H3 – Industry Relation Positive
Coefficient value:
Financial > Insurance > Retail False
Model 2
H4 – Non-company Posts Positive **
**Denotes p-value at the 90% confidence level
Section 5: Discussion
Given the high volume of social media activity and various strategies for corporations, it
is difficult to build a quantitative model to analyze the relationship in accordance with stock
activity. While hypotheses one, two, and three were not statistically supported, this study does
provide insight into the value of social media activity and the opportunity to view the various
post volumes between different companies. In order to truly understand the relationship between
financial performance and stock price it would be necessary to analyze a much larger sample of
firms and use conduct a categorization of post types. An additional limitation of this study is the
use of solely stock price as a measure of financial performance. While a percentage of increase is
a relatively fair method of comparing a sample of firms, there are many other measures that
could be taken into account. Looking at firm profits or earnings across the quarter may
30strengthen the model and provide a more varied measure than stock change, which seemed to
show minimal movement across the second quarter of 2012.
Although it was not proven statistically significant, the coefficient of the interaction
variable between the financial and retail industries (.053) suggests that the correlation of
company posts to stock price is closer for the finance industry. Similarly, the coefficient of the
interaction variable between the healthcare/insurance and retail industries (.012) aligns with the
third hypothesis. In order to systematically show this relationship exists, it would require the
examination of additional firms. With further research, it could be identified whether increased
Facebook activity is a sign of poor financial performance and the companies that are seeing
positive financial performance do so regardless of Facebook activity. In building off of this idea
that Facebook posts may play a role in firm stock performance, it may be necessary to dig deeper
into the classification of a post. Textual analysis would provide more detail than quantity to use
in the regression model and categorize the type of post.
As for hypothesis four, it was possible to reject the null hypothesis that non-company
posts did have a small, but positive relationship to a change in stock returns. Approximately half
of one percent of an increase in stock price can be related to every one percent of increase of
posts by non-company Facebook users. While this is a small value, it may be potentially valuable
for firm’s to take into consideration when monitoring Facebook activity. The upward trend line
as seen in the scatter plot could be investigated further with a larger sample of firms. From this
information companies can evaluate whether they feel it is necessary to allow outside user posts
on a corporate Facebook page.
The results of this study also suggest that Facebook may not be a crucial factor in
attempting to predict financial performance. The methodology of this study can be applied to
31other social networks to provide a more comprehensive dataset of social media activity.
Additionally the increase of niche social media platforms may shift company emphasis from
Facebook to more targeted user bases, specifically investor focused sites such as Seeking Alpha
and micro-blogs.
This study has provided an initial step in understanding whether there is a relationship
between Facebook fan page activity and stock price. Although it was not possible to make a
direct connection between the two, there are many avenues for future research to address.
Facebook is one factor in managing customer satisfaction and in combination with other
technology; it may provide an opportunity to link to an increase in stock price. In developing a
social media strategy, management must analyze what is best for the organization based on the
industry, customer base, and many other factors. Future studies have the opportunity to identify
whether these strategies are able to tie back to a specific return on investment in social media.
Section 6: Conclusion
This study was unsuccessful in proving a positive correlation between an increase in
stock price and a higher volume of company posts on a corporate Facebook fan page. While
social media is used widely across the Fortune500 it is still very difficult to build an analytical
framework around quantitative activity. Further research will require complex technology to
precisely breakdown individual posts and utilize sentiment analysis. This study also shows that
when analyzing social media, quantity may not be the most important factor in relating to
financial performance. Management must understand how to best reach potential customers and
investors in order to capitalize on the wide spread adoption of social media.
32Reference List
Anderson, E. W., Fornell, C., & Mazvancheryl, S. K. (2004). Customer Satisfaction and
Shareholder Value. Journal of Marketing, 68(4), 172–185. doi:10.2307/30162024
Andonian, J. & Barnes, N.G. (2011) The 2011 Fortune 500 and Social Media Adoption: Have
America’s Largest Companies Reached a Social Media Plateau? Charlton College of
Business, University of Massachusetts Dartmouth. Retrieved from
http://www.umassd.edu/cmr/studiesandresearch/2011fortune500/
Chen, H., De, P., Hu, Y., & Hwang, B. -. (2011). Sentiment revealed in social media and its
effect on the stock market. Paper presented at the IEEE Workshop on Statistical Signal
Processing Proceedings, 25-28.
Engelberg, J. E., & Parsons, C. A. (2011). The causal impact of media in financial markets.
Journal of Finance, 66(1), 67-97.
Jambulingam, T., & Sharma, R. (2010). Estimating the value of internet marketing in the US
pharmaceutical industry. Journal of Medical Marketing, 10(4), 332-343.
doi:10.1057/jmm.2010.24
Kopytoff, V. (2013). The truth about social media for business: It’s a risk - Fortune Tech.
CNNMoney. Retrieved May 6, 2013, from http://tech.fortune.cnn.com/2013/04/29/the-
truth-about-social-media-for-business-its-a-risk/
Lewin, J.E., Strutton, D. & Taylor, D.G. (2011). Friends, fans, and followers: Do ads work on
social networks? Journal of Advertising Research, 51(1), 258-275. Retrieved from
http://search.ebscohost.com/login.aspx?direct=true&db=buh&AN=59484333&site=ehost
-live
Liu, P., Smith, S. D., & Syed, A. A. (1990). Stock price reactions to the wall street journal's
securities recommendations. Journal of Financial & Quantitative Analysis, 25(3), 399-
410. Retrieved from
http://search.ebscohost.com.ezp2.lib.umn.edu/login.aspx?direct=true&db=buh&AN=572
2682&site=ehost-live
Timian, Alex, Sonia Rupcic, Stan Kachnowski, and Paloma Luisi. 2013. “Do Patients ‘Like’
Good Care? Measuring Hospital Quality via Facebook.”American Journal of Medical
Quality. http://ajm.sagepub.com/content/early/2013/01/31/1062860612474839.
Xueming Luo, Jie Zhang, and Wenjing Duan. 2013. “Social Media and Firm Equity Value.”
Information Systems Research 24(1): 146–63.
33“Zillow Announces Webscast of First Quarter 2013 Earnings Conference Call and Plans to Take
Questions Via Social Media” The Street. April 24, 2013.
http://www.thestreet.com/story/11904918/1/zillow-announces-webcast-of-first-quarter-
2013-earnings-conference-call-and-plans-to-take-questions-via-social-media.html.
34Appendix A – Full Listing of Firms
Fortune Company 2011 Revenue Facebook URL
500 Rank Name ($ mill)
Bank of http://www.facebook.com/BankofAmerica
13 America 115,074.00
JP Morgan http://www.facebook.com/ChaseCommunityGi
16 Chase & Co. 110,838.00 ving
20 Citigroup 102,939.00 http://www.facebook.com/citibank
22 UnitedHealth 101,862.00 http://www.facebook.com/uhgcareers
24 Costco 88,915.00 http://www.facebook.com/Costco
26 Wells Fargo 87,597.00 http://www.facebook.com/wellsfargo
34 MetLife 70,641.00 http://www.facebook.com/metlife
35 Home Depot 70,395.00 http://www.facebook.com/homedepot
38 Target 69,865.00 http://www.facebook.com/target
45 Well Point 60,710.70 http://www.facebook.com/WellPointCareers
51 Intel 53,999.00 http://www.facebook.com/Intel
53 Best Buy 50,272.00 http://www.facebook.com/bestbuy
54 Lowe's 50,208.00 http://www.facebook.com/lowes
65 Sear's 41,567.00 https://www.facebook.com/Sears.Outlet.Stores
Morgan http://www.facebook.com/pages/Morgan-
68 Stanley 39,376.00 Stanley/16709413101
70 Fedex 39,304.00 http://www.facebook.com/Fedex
79 Humana 36,832.00 http://www.facebook.com/Humana
Aetna Student http://www.facebook.com/AetnaStudentHealth
89 Health 33,779.80
American http://www.facebook.com/americanexpress
95 Express 32,282.00
http://www.facebook.com/Macys
110 Macy's 26,405.00
112 Travelers 25,446.00 http://www.facebook.com/travelers
128 Aflac 22,171.00 http://www.facebook.com/Aflac
Hartford http://www.facebook.com/TheHartford
Financial
131 Services 21,918.00
132 US Bank 21,399.00 http://www.facebook.com/usbank
136 Nike 20,862.00 http://www.facebook.com/nike
137 Cigna 21,998.00 http://www.facebook.com/CIGNA
146 Kohl’s 18,804.00 http://www.facebook.com/kohls
148 Capital One 18,525.00 http://www.facebook.com/capitalone
Bank of NY http://www.facebook.com/bnymelloncareers
166 Mellon 15,804.00
Chubb http://www.facebook.com/ChubbInsurance
202 Insurance 13,585.00
Marriot http://www.facebook.com/marriottinternational
217 International 12,317.00
35271 Suntrust 9,602.00 http://www.facebook.com/suntrust
279 CarMax 9,402.20 http://www.facebook.com/CarMax
281 Visa 9,188 https://www.facebook.com/VisaUnitedStates
Caesar's http://www.facebook.com/CaesarsAtlanticCity
288 Entertainment 8,834.50
Principal http://www.facebook.com/PrincipalFinancial
295 Financial 8,709.60
300 Discover 8,550.30 http://www.facebook.com/discover
Quest http://www.facebook.com/questdiagnostics
341 Diagnostics 7,510.50
Barnes & http://www.facebook.com/barnesandnoble
360 Noble 6,998.60
370 Mastercard 6,714.00 http://www.facebook.com/mastercard
418 Avis 5,900.00 http://www.facebook.com/avis
Starwood http://www.facebook.com/starwood
Hotels &
434 Resorts 5,624.00
Dick's Sporting http://www.facebook.com/dickssportinggoods
466 Goods 5,211.80
472 Fidelity 5,153.70 http://www.facebook.com/fidelityinvestments
489 CIT group 4,855.30 http://www.facebook.com/CITGroup
36You can also read