Eat at Home or Away from Home? The Role of Grocery and Restaurant Food Sales Taxes - Western ...
←
→
Page content transcription
If your browser does not render page correctly, please read the page content below
Journal of Agricultural and Resource Economics 44(1):98–116                                                 ISSN 1068-5502
Copyright 2019 Western Agricultural Economics Association

        Eat at Home or Away from Home? The Role of
          Grocery and Restaurant Food Sales Taxes
              Yuqing Zheng, Diansheng Dong, Shaheer Burney, and Harry M. Kaiser

       Sales taxes on either grocery food or restaurant food exist in almost every U.S. county. By
       combining county-level sales tax data with the USDA’s recent national household food acquisition
       and purchase survey, we examine how a food sales tax affects consumers’ expenditures on grocery
       and restaurant food. We find that a grocery tax reduces consumers’ grocery food expenditures and
       increases restaurant food expenditure and a restaurant food sales tax increases consumers’ grocery
       food expenditures. We also find no differential impacts from food sales taxes based on consumers’
       income or participation status in the Supplemental Nutrition Assistance Program.

       Key words: grocery tax, Supplemental Nutrition Assistance Program, tax salience

                                                     Introduction

The majority of states and counties in the United States exempt grocery food—but not restaurant
food—from the general sales tax. For example, Fayette County, Kentucky, which has no county sales
tax, exempts groceries but not restaurant food from the 6% state sales tax. As a result, consumers
living in Fayette County face at least a 6% tax differential between eating at home versus away from
home for a similar meal.1 However, in Lee County, Alabama, groceries are subject to the same 4%
state and 4% county sales taxes levied on restaurant food, providing no tax incentive for consumers
to eat at home. Such myriad and often conflicting sales tax codes across and even within states can
have direct public health implications, changing the relative prices of eating at home and dining out,
since restaurant meals generally are more calorie-dense and could be nutritionally poorer (in many
cases lower in fiber, calcium, and iron) than meals prepared at home (e.g., Guthrie, Lin, and Frazao,
2002; Lin and Guthrie, 2012).2
    This research provides the first empirical examination of consumers’ eating behaviors in
response to both types of food sales taxes, defined as grocery taxes (sales taxes imposed on foods
at retail outlets such as grocery stores, convenience stores, etc.) and restaurant taxes (sales taxes
imposed on restaurant food). We address two important policy questions faced by local, state, and
federal governments: i) do food sales taxes affect consumers’ expenditures on grocery food and

Yuqing Zheng is associate professor in the Department of Agricultural Economics at the University of Kentucky. Diansheng
Dong is an economist at the USDA Economic Research Service. Shaheer Burney is an assistant professor in the Department
of Agricultural Economics at the University of Wisconsin-River Falls. Harry M. Kaiser is the Gellert Family Professor in the
Dyson School of Applied Economics and Management at Cornell University.
This work was funded by the USDA Economic Research Service through a cooperative agreement under federal grant number
58-5000-5-0096. The findings and conclusions in this article are those of the authors and do not represent the views of USDA.
We thank the editor (Darren Hudson) and two anonymous reviewers for insightful comments.
   Review coordinated by Darren Hudson.
   1 We state “at least” here because labor and overhead for meal production are taxed. Once this is considered, the

aforementioned price differential for a similar meal is actually greater than 6%.
   2 Many studies have associated dining out with lower diet quality (e.g., Taveras and Skidmore, 2005; Beydoun, Powell,

and Wang, 2009). However, the literature seems inconclusive on whether restaurant meals lead to obesity (e.g., Currie et al.,
2010, report supporting evidence while Anderson and Matsa, 2011, find no causal link).
Zheng et al. Grocery and Restaurant Food Sales Taxes 99
(a) Grocery Food Sales Taxes
(b) Restaurant Food Sales Taxes
Figure 1. U.S. Food Sales Taxes, State and County Combined, 2014
restaurant food, and ii) are food expenditures of participants in government food assistance programs
less sensitive to food sales taxes?
The first policy question is important for at least two reasons (in addition to the aforementioned
public health implications). First, food sales taxes exist in almost every county in the United States.
The two maps in Figure 1 show the rates of grocery taxes and restaurant taxes, respectively, for each
U.S. county in 2014. These are the state and county combined tax rates. Our restaurant tax data
reflect the fact that some counties impose an additional sales tax on top of the general sales tax on
restaurant food.3 Grocery taxes exist in 18 states. The average combined grocery tax rate for counties
that tax groceries is 4.3%, and the highest rate is 9% (4% state plus 5% county) in Tuscaloosa
County, Alabama, in 2014. Most of the counties with a grocery tax are located in the South (e.g.,
Alabama, Mississippi, and Arkansas). Restaurant taxes exist in all states except Delaware, New
Hampshire, Montana, and Oregon; the highest is 10% (4% state plus 6% county) in Catahoula Parish
3 Our sources for tax data are http://www.tax-rates.org, http://www.sale-tax.com, and state and various county departments
of revenue. Our data are at the county level and do not reflect that some cities may impose additional restaurant taxes (not
available to us).100 January 2019 Journal of Agricultural and Resource Economics
Table 1. Overview of U.S. State and County Grocery Food Sales Taxes, 2014
States (no. of counties if not all fall
State Grocery Tax County Grocery Tax into this category)
State taxes grocery at full rate Counties tax at full rate AL (67), KS (90), OK (76)
Counties have no sales tax AL (1), HI, ID, KS (15), MS,a OK
(1), SD
State taxes grocery at reduced rate Counties tax at full rate AR (73), IL (4),a MO (114), TN, VA
Counties tax at reduced rate IL (4),a MO (1)
Counties exempt grocery (from IL (55)a
county sales tax)
Counties have no sales tax AR (2), IL (39)a
State exempts grocery from state Counties tax at full rate GA, LA (56), NC, SC (20), UT
sales tax (18)a
Counties tax at reduced rate LA (4), SC (11), UT (11)a
Counties exempt grocery (from AZ, CA,a CO (52), DC, FL (56), IA
county sales tax) (92), MN (17), NE (1), NV (12),
NM, NY, ND (6), OH, PA (2), SC
(7), TX (123), WA, WI (65),a WY
(20)
Counties have no sales tax CO (12), CT, FL (11), IN,a IA (7),
KY, LA (4), ME,a MD, MA,a MI,
MN (70), NE (92), NV (5), NJ, ND
(47), PA (65), RI,a SC (8), TX
(131), VT,a WV, WI (7),a WY (3)
State has no sales tax Counties tax full rate AK (13)
Counties have no sales tax AK (15), DE, MT, NH, OR
Notes: Bold denotes the existence of a grocery tax.
a
Indicates that some counties impose an additional sales tax on top of the general sales tax on restaurant food.
Sources: http://www.tax-rates.org, http://www.sale-tax.com, and state and county departments of revenue.
County, Louisiana. Overall, one-third of U.S. counties are affected by grocery taxes, and most U.S.
counties are affected by restaurant taxes.
Second, many state and local governments have imposed or raised food sales taxes, particularly
grocery taxes, as a way to raise additional governmental revenues. Table 1 presents an overview of
many possible combinations of grocery tax policies, each of which depends on whether a state and
a county tax grocery food at the full rate, tax grocery food at a reduced rate, exempt grocery food
from sales tax, or have no sales tax. A grocery food tax is simply the result of a state and/or county
taxing groceries at the full or reduced rate (e.g., South Dakota [full state tax], Georgia [full county
tax], and Tennessee [reduced state tax coupled with full county tax]). In addition, many public
health supporters advocate taxing fast food restaurants to curb the obesity epidemic. While recent
literature provides some insights, there are still significant gaps in our knowledge about how food
sales tax policies affect consumers’ eating behaviors. If consumers allocate more of their budgets to
eating away from home in response to a higher grocery tax rate, such a tax is beneficial to the local
restaurant industry at the cost of grocery retailers.
The second policy question addresses how federal food assistance policies may interact
with local tax policies. According to federal laws and U.S. Department of Agriculture (USDA)
regulations, food purchases made with federal government food assistance benefits, such as those
from the Supplemental Nutrition Assistance Program (SNAP), are exempt from both state and
local sales taxes. Therefore, SNAP recipients might be less sensitive to grocery taxes because their
program benefits are shielded from the taxes.
This paper empirically examines the impact of county-level grocery and restaurant taxes
on consumers’ food-at-home (FAH) and food-away-from-home (FAFH) expenditures using the
USDA’s new National Household Food Acquisition and Purchase Survey (FoodAPS), the first
nationally representative survey of American households to collect unique and comprehensiveZheng et al. Grocery and Restaurant Food Sales Taxes 101
data about household food purchases and acquisitions for FAH and FAFH consumption. We
combine the FoodAPS data with newly collected county-level food sales tax data to address the
two aforementioned policy questions. Our findings suggest that policy makers should consider
consumers’ food consumption responses when crafting or changing food tax policies.
Relevant Literature
Our study is closely related to a large literature on the impacts of food and beverage taxes (and
subsidies) on consumptions and health outcomes. Most studies emphasize the importance of the
price elasticity of demand for food, while assuming that a tax is perfectly passed on to consumers
(e.g., Zheng and Kaiser, 2008; Zhen et al., 2014). A few studies analyze the impact of state food
sales taxes on grocery sales for consumers living close to state borders by using tax-inclusive prices
(e.g., Walsh and Jones, 1988; Tosun and Skidmore, 2007). Several researchers use a reduced-form
approach to directly examine the impact of a tax on food and beverage consumption (e.g., Sturm
et al., 2010) and health outcomes such as body mass index (e.g., Fletcher, Frisvold, and Tefft,
2010). Andreyeva, Long, and Brownell (2010) and Powell et al. (2013) conduct two subsequent,
comprehensive reviews (published studies for 1938–2007 and 2007–2013, respectively) of hundreds
of studies in the literature and find clear evidence of negative consumption responses to food and
beverage taxes. However, Powell et al. (2013) show that the evidence for the effect of taxes on
weight outcomes is mixed. Because the tax studies used primarily state-level sales taxes, Powell et al.
(2013) attribute this mixed evidence to the small magnitude of state-level taxes. Following some of
the previous studies, we adopt the reduced-form approach but use sales tax data with a much finer
level of disaggregation. As displayed in Table 1, numerous counties have their own grocery taxes.
Using county-level sales tax data therefore better captures reality and provides a greater source of
variation.
Complicating the results from the above literature is the small but burgeoning collection of
research on tax salience. In their seminal work, Chetty, Looney, and Kroft (2009) use a store
experiment to show that consumers underreact to taxes that are not salient. These authors also show
that for beer, consumers ignore state sales tax but not the excise tax imposed on manufacturers.
Zheng, McLaughlin, and Kaiser (2013) further find that consumers’ imperfect tax knowledge can
attenuate or strengthen the degree of consumer underreaction to a sales tax. Their survey finds that
about one-third of New York State consumers have an incorrect understanding of the tax status
of some foods. Similarly, Chen, Kaiser, and Rickard (2015) use an economic experiment of 131
adult, nonstudent subjects and find that an inclusive tax (i.e., included in the menu price) has a
significantly stronger effect on reducing the consumption of total calories, calories from fat, and the
intake of carbohydrates, cholesterol, sugar, and sodium compared with an exclusive tax (added at the
register). Goldin and Homonoff (2013) investigate income differences in attentiveness to cigarette
sales taxes and find that only low-income consumers respond to the taxes. In contrast, Berck et al.
(2016) show that a bottled-water sales tax in Washington decreased sales, and the effect is more
pronounced in the lowest and highest quintile income areas. Our analysis relates to this literature
because it provides a test of whether consumers ignore food sales taxes, which are generally added
at the register. We also examine income differences in attentiveness to food sales taxes, providing
some insights on whether food taxes place a higher burden on lower-income population.
Several recent studies have analyzed the determinants of FAH and FAFH spending using
longitudinal survey data. These studies share a common objective of identifying consumption
responses to the SNAP program, and all ignore food sales taxes. For example, Wilde, Troy, and
Rogers (2009) analyze this issue by splitting samples into SNAP participants and nonparticipants.
Burney (2018) exploits state variation in SNAP caseloads arising from the early 2000s recession,
Hoynes and Schanzenbach (2009) utilize the original introduction of the program across counties
as the source of variation, and Beatty and Tuttle (2015) utilize the large increases in SNAP benefits
in 2009. The last three studies adopt a difference-in-differences research design. That the FoodAPS102 January 2019 Journal of Agricultural and Resource Economics
data are only 1 week in duration prevents us from using the panel data techniques used by the
last three related studies to get around the endogeneity of SNAP participation. Instead, following
a broader literature of examining SNAP impacts on food security (e.g., Ratcliffe, McKernan, and
Zhang, 2011) we use cross-sectional data and rely on instrumental variables to address this well-
known issue. Because historical county food sales tax information is unavailable, our source of
variation to identify the impact of tax on household food consumption comes from the vast tax
differences among U.S. counties (Figure 1). This is a reasonable approach considering that food
sales taxes generally do not change over short periods of time. We also make use of the detailed and
unique consumer characteristics (e.g., traveling time to primary food store, food access) provided
by FoodAPS to better control for factors that could influence food purchasing decisions.
Overall, we attempt to make three contributions. First, we examine both the own- and cross-
price effects of grocery and restaurant taxes on FAH and FAFH and explore potential tax policy
interactions between state/local and federal levels. The estimates presented here are directly relevant
to policies such as a fat tax on fast food restaurants. Second, our conceptual framework illustrates
how the sales tax affects market equilibrium in the presence of tax inattentiveness and various
degrees of tax pass-through. Our empirical model provides a test of tax attentiveness, contributing
to the growing tax salience literature. Third, the use of county-level food sales tax data is an
improvement over previous tax studies. The rich household information in FoodAPS also provides
insight into how food access affects consumption.
Conceptual and Empirical Frameworks
Conceptual Framework
Our conceptual framework builds on the framework introduced by Fletcher, Frisvold, and Tefft
(2010) and incorporates the salience component developed by Chetty, Looney, and Kroft (2009).
We conceptualize the food consumption quantity (Q, which can be FAH or FAFH consumption) of
individual i living in county c as a function of the tax-exclusive food price (P) and food sales tax rate
(T ) in county c as well as other variables such as demographics and income. Suppressing the other
variables for exposition purpose leads to a general functional form
(1) Qic = f [Pc , (1 + Tc )] .
Total differentiation of equation (1) yields
∂ Qic ∂ Qic
(2) dQic = dPc + d (1 + Tc ) .
∂ Pc ∂ (1 + Tc )
Dividing equation (2) by d (1 + Tc ) and expressing it in logarithm, we have
d ln Qic ∂ ln Qic d ln Pc ∂ ln Qic
(3) = + ,
d ln (1 + Tc ) ∂ ln Pc d ln (1 + Tc ) ∂ ln (1 + Tc )
∂ ln Qic d ln Pc
where ∂ ln Pc is the price elasticity of demand, d ln(1+Tc ) is the degree of tax pass-through, and
∂ ln Qic
∂ ln(1+Tc ) is the tax elasticity of demand. Equation (3) can be expressed equivalently as
d ln Qic ∂ ln Qic d ln P
c
(4) = + ,
θ
d ln(1 + Tc ) ∂ ln P d ln(1 + Tc )
| {z c}
|{z}
| {z } tax attentiveness
price elasticity tax pass-through
∂ ln Qic
where the θ term, defined as θ = ∂ ln(1+T c)
/ ∂∂lnlnQPcic , measures the ratio of tax elasticity to price
elasticity of demand and bears further discussion. If θ = 0, the consumer completely ignores theZheng et al. Grocery and Restaurant Food Sales Taxes 103
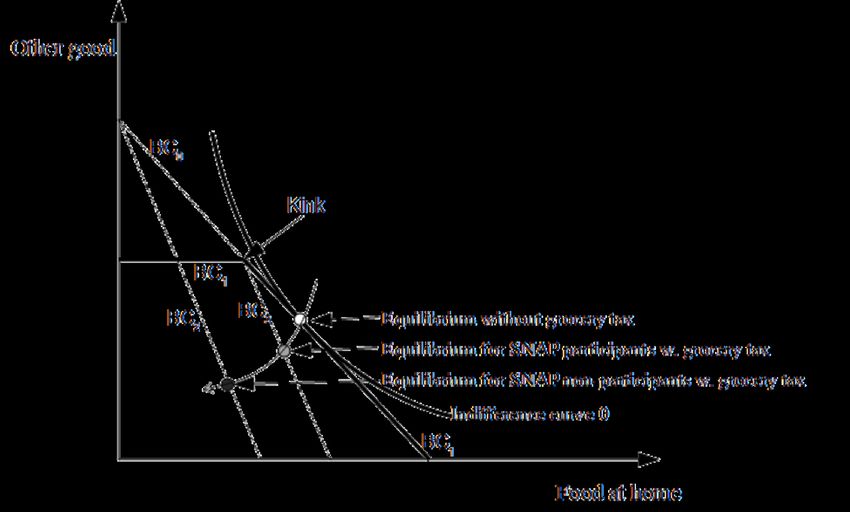
Figure 2. Illustration of Grocery Tax on Food-at-Home Consumption
sales tax when shopping; if θ = 1, then the consumer is fully attentive of sales taxes when shopping;
0 < θ < 1 is the case between the two extremes in which the consumer partially responds to the sales
tax.
The effect of the tax on equilibrium food consumption depends on three factors: i) price elasticity
of demand, ii) degree of tax pass-through to consumers, and iii) degree of tax attentiveness. The
conventional thought is that retail price rises by approximately the amount of a sales tax in a standard
ln Pricec
competitive market (i.e., full pass-through, d dln(1+Tax c)
= 0, because the price here excludes tax). On
the other hand, the tax can over-shift in a noncompetitive market (i.e., price increases more than
ln Pricec
the increase in tax, or d dln(1+Tax c)
> 0}. Empirical studies estimating tax pass-through for food sales
taxes are very limited. Besley and Rosen (1999) report full tax pass-through for Big Macs, Crisco,
and eggs and over-shifting for bananas, bread, milk, and soda. Therefore, our reduced-form estimates
of tax impact subsume the net effect of tax pass-through and tax attentiveness, assuming a negative
price elasticity of demand.
Figure 2 illustrates our conceptual framework for the differential impact of grocery tax on SNAP
recipients; the kinked budget constraint (BC1 ) is the standard textbook treatment of SNAP recipients
(e.g., Hoynes and Schanzenbach, 2009; Beatty and Tuttle, 2015). Imagine another consumer who
attains the same consumption bundle of FAH and the other good but does not participate in the SNAP.
The budget constraint for this consumer is the straight line BC0 . When the grocery tax increases, the
budget constraint for the nonparticipant rotates clockwise around the y-axis intercept and becomes
BC2 . However, the budget constraint for the SNAP participant rotates clockwise around the kink
and becomes BC3 (proof available upon request). As a result, the reduction in FAH consumption
becomes more pronounced for the nonrecipient (the black dot versus the gray dot). The fundamental
cause for this difference is the exemption of SNAP benefits from the tax, providing SNAP benefits
with higher purchasing power than cash in the presence of a tax.
Empirical Model
Our empirical model consists of a separate equation for household weekly FAH and FAFH
expenditures. We hypothesize that the out-of-pocket or cash FAH expenditures (that is, total FAH
expenditures minus SNAP purchases) of household i living in county c are a function of the
following core variables: grocery tax rate (Grtax) and restaurant food tax rate (Resttax) in county
c, household SNAP participation status (dummy variable), basket food price index constructed from104 January 2019 Journal of Agricultural and Resource Economics
retail scanner data for the county to control for price effect, household size, income, and additional
control variables:
CashFAH ic =β0 + β1 Grtaxc + β2 Resttaxc + β3 SNAPi + β4 Basketpricec + β5 Sizei
(5)
+ β6 Incomei + β7 D e m o g i + β8 A c c e s s i + β9 Ot h e r i + εi ,
where β are parameters to be estimated and εi is the error term. Equation (5) uses expenditures
instead of quantities (as in equation 1) for FAH and FAFH since that information is both better
recorded in FoodAPS than information on physical quantities and easy to aggregate from all food
consumptions. With the rich information provided by the FoodAPS data, we add three additional
sets of control variables: The demographic variable vector (DDe m o g ) includes the primary survey
respondent’s age, education level, marital status, and race. The primary respondent is the person
in the household most responsible for grocery shopping. Food access variable vector (A Ac c e s s )
includes one-way travel time to the household primary food stores measured in minutes, numbers
of SNAP–authorized retailers, fast food restaurants, and non–fast food restaurants all within 5 miles
of the household. The last vector includes whether any household member is on any kind of food
diet, whether the household received USDA foods from local program or distribution site, meals at
home from community program, or meals at a community center in past month, respectively. The
FAFH equation is similarly specified by replacing the dependent variable in equation (5) with FAFH
expenditures.
The National Household Food Acquisition and Purchase Survey (FoodAPS)
The USDA’s new FoodAPS offers unique data on 4,826 American households’ food choices.
For FoodAPS, households, including SNAP participants, living throughout the continental United
States recorded all the foods they acquired for both at home and away from home consumption
over 7 consecutive days between April 2012 and mid-January 2013. Each household’s primary
respondent participated in two in-person interviews and up to three telephone interviews. Collected
data include information on food and beverage items purchased or otherwise acquired, including
location, price, brand, package size, flavor, and payment method (e.g., whether it was purchased
with SNAP benefits). Collected data also include detailed factors expected to affect food acquisition
decisions, such as household size, demographic characteristics, income, participation in federal food
assistance programs, and food access information (also known as the food environment). The basket
prices were constructed by the University of Illinois using weekly IRI store-level sales and costs at
the universal product code (UPC) level for a group of foods based on the food basket defined by
the Thrifty Food Plan for Feeding America’s the Meal Gap Project (Gundersen et al., 2015).4 The
basket prices were calculated for each of the 50 FoodAPS’s primary sampling units and captured
both time and store variation in food basket cost. Since different stores may offer different quality
foods, one major limitation of the basket prices is that they “cannot guarantee the goods compared
over time and over stores are identical.” Detailed survey information, including variable lists and
code books, is available on the USDA’s website.5
Our unit of analysis is the household. We aggregated all household members’ FAH and FAFH
expenditures over the week for each household. FAH and FAFH expenditures include sales taxes
paid. Since payments made using SNAP Electronic Benefit Transfer (EBT) cards are exempt from
grocery taxes, we subtracted this amount from total FAH expenditures and use the net amount as the
dependent variable in equation (5). That is, we use the cash FAH expenditures (similar to Hoynes
and Schanzenbach, 2009), including sales taxes paid, to better estimate the tax impact. About 60% of
the SNAP recipients in the data reported a positive EBT transaction amount for the week. Similarly,
4 The detailed construction of basket price is available at https://www.ers.usda.gov/media/8582/priceindexdata.pdf.
5 http://www.ers.usda.gov/data-products/foodaps-national-household-food-acquisition-and-purchase-survey.aspx.Zheng et al. Grocery and Restaurant Food Sales Taxes 105
we use household members’ total FAFH expenditures over the week, including taxes and tips paid,
as the dependent variable for the FAFH equation. About 5%, 6%, and 1% of households reported
zero (cash) FAH expenditures, zero FAFH expenditures, and zero FAH and FAFH expenditures,
respectively (a handful of households with negative cash FAH expenditures were found in the data,
likely due to reporting errors, and thus dropped from our sample). Since zero expenditures represent
only a very small fraction of the dependent variables and are more likely attributable to factors
such as shopping frequency rather than food taxes, we restrict our study samples to households
with positive FAH expenditures and households with positive FAFH expenditures during the week,
resulting in sample sizes of 3,995 and 3,596, respectively, for the two equations. Our tax data came
from several sources. We augment sales tax data available from www.tax-rates.org and www.sale-
tax.com with a comprehensive search on state and county departments of revenue. Because we
started collecting the tax data at the end of 2014 and the sources only provide county tax data for the
current year, our tax data are for 2014 and therefore do not align perfectly with the FoodAPS data.
However, the historical state-level grocery tax rates reported by Bridging the Gap (2015), a research
program funded by the Robert Wood Johnson Foundation, show that only Kansas changed its rate
(from 6.3% to 6.15%) from 2013 to 2014. Our data adjusted for this change accordingly, but results
should be interpreted with the caveat that county-level taxes may have changed during this period.
Table 2 shows summary statistics for FAH and FAFH expenditures, taxes, and other control
variables based on households with positive FAH and FAFH expenditures, respectively. On average,
households spent $98.36 for FAH net of SNAP benefits and $60.31 for FAFH in the week. When
broken down by SNAP participation status, SNAP recipients spent $63.51 cash for FAH, $93.81
SNAP benefits, and $45.6 for FAFH, while nonparticipants spent $112.64 in cash for FAH and
$66.72 for FAFH. Such numbers fit squarely into the textbook illustration of the SNAP effect on
recipients: an increase of total FAH expenditure and a decrease in cash FAH expenditure (Hoynes
and Schanzenbach, 2009, p. 119). Table 2 shows that 29% of households received SNAP benefits,
which is higher than the national participation rate of 19%.6 This reflects the fact that the FoodAPS
oversampled low-income households because of special interest in the food acquisition patterns of
households participating in government food assistance programs.
Table 3 breaks down average FAH and FAFH expenditures by food sales tax rate. Overall,
counties that exempt groceries have the highest average FAH expenditures. It is striking to observe
that FAH expenditures are lowest not in areas with the highest tax rates but in counties with a grocery
tax rate that positive but less than 2%. On the other hand, areas with higher restaurant taxes seem
to have higher average FAFH expenditures. This ambiguity necessitates a multivariate statistical
analysis.
For several reasons, the FoodAPS data are a far better source than other large datasets such as the
Current Population Survey Food Security Supplement (CPS-FSS) to study the impact of food sales
taxes. First, while SNAP enrollment is self-reported in the CPS-FSS and most large datasets, the
FoodAPS data verifies enrollment through administrative records, which significantly reduces bias
arising from measurement error. Second, FAH and FAFH expenditures are measured with better
precision because households were asked to scan barcodes on packaged foods and calculate FAFH
expenditures based on saved receipts from restaurants. Third, the FoodAPS data allows for better
control of the local food environment by including variables that measure food prices, food access,
ease of SNAP benefit use, and type of grocery stores available.
6 The USDA reports that 23 million households participated in SNAP in 2013 (U.S. Department of Agriculture, SNAP
Participation and Costs, 1969–2015, https://www.fns.usda.gov/pd/supplemental-nutrition-assistance-program-snap) out of
122 million households in that year (U.S. Census Bureau, Households by Type and Tenure of Householder for Selected
Characteristics, 2013, https://www.census.gov/data/tables/time-series/demo/families/households.html).106 January 2019 Journal of Agricultural and Resource Economics
Table 2. Summary Statistics of the FoodAPS and Tax Data
Variable Description N Mean Std. Dev. Min. Max.
FAH Total cash food-at-home 3,995 $98.36 $97.41 $0.03 $1,847.50
expenditures during the week
FAH for SNAP = 1 . . . for SNAP recipients 1,161 $63.51 $74.02 $0.03 $567.19
FAH for SNAP = 0 . . . for SNAP nonrecipients 2,834 $112.64 $102.14 $0.99 $1,847.50
FAFH Total food-away-from-home 3,596 $60.31 $73.35 $0.35 $1,816.97
expenditures during the week
FAFH for SNAP = 1 . . . for SNAP recipients 1,091 $45.60 $56.42 $0.89 $1,073,36
FAFH for SNAP = 0 . . . for SNAP nonrecipients 2,505 $66.72 $78.77 $0.35 $1,816.97
Grocery tax Grocery food sales tax rate, 3,995 0.04a 0.02 0.01 0.08
county and state combined
Restaurant tax Restaurant food sales tax rate, 3,995 0.07 0.01 0.04 0.10
county and state combined
SNAP participation = 1 if household reports 3,995 0.29 0.45 0.00 1.00
SNAP current participation, 0
otherwise
SNAP EBT SNAP EBT payment 3,995 $93.81a $95.48 $0.50 $856.72
Basket price Basket food price index 3,995 347.41 56.33 235.80 518.24
constructed from IRI scanner
data
Household size Number of people at 3,995 2.99 1.73 1.00 –b
residence, excluding guests
Household income Household average monthly 3,995 $3.58 $4.04 $0.00 >$60b
income, in $1,000
Age Individual’s age in years (for 3,995 46.29 16.36 16.00 >90b
the primary respondent)
Education Highest level of school 3,995 20.21 2.80 11.00 24.00
completed
Married = 1 if married, 0 otherwise 3,995 0.45 0.50 0.00 1.00
Black = 1 if race is black or African 3,995 0.14 0.35 0.00 1.00
American, 0 otherwise
Native American = 1 if race is American Indian 3,995 0.02 0.14 0.00 1.00
or Alaska Native, 0 otherwise
Asian = 1 if race is Asian, 0 3,995 0.05 0.21 0.00 1.00
otherwise
Hispanic = 1 if individual is Spanish, 3,995 0.01 0.07 0.00 1.00
Hispanic, or Latino; 0
otherwise
Travel time One-way travel time to 3,995 10.50 8.22 1.00 90.00
primary food store, in minutes
No. SNAP retailers No. of SNAP–authorized 3,995 184.14 423.69 0.00 3,812.00
retailers within 5 miles of
household
No. fast food rest. No. of fast food restaurants 3,995 73.81 79.00 0.00 429.00
within 5 miles of household
No. non-fast food rest. No. of non–fast food 3,995 337.90 547.17 0.00 3,639.00
restaurants within 5 miles of
household
Shop convenience = 1 if household shopped for 3,995 0.34 0.47 0.00 1.00
food at a convenience store
during past 30 days, 0
otherwise
Continued on next page. . .Zheng et al. Grocery and Restaurant Food Sales Taxes 107
Table 2. – continued from previous page
Variable Description N Mean Std. Dev. Min. Max.
Shop big box = 1 if household shopped for 3,995 0.42 0.49 0.00 1.00
food at a discount or big box
store during past 30 days, 0
otherwise
Shop clubs = 1 if household shopped for 3,995 0.22 0.42 0.00 1.00
food at a wholesale club
during past 30 days, 0
otherwise
Nutrition facts How often use nutrition facts 3,995 3.01 1.34 1.00 6.00
panel (1 = always, 6 = never
seen)
Any dieting = 1 if any household member 3,995 0.32 0.47 0.00 1.00
is on any kind of food diet, 0
otherwise
Food pantry = 1 if household went to a 3,995 0.06 0.24 0.00 1.00
food bank or food pantry in
past 30 days for groceries, 0
otherwise
USDA foods = 1 if anyone receiving USDA 3,995 0.04 0.19 0.00 1.00
foods from local program or
distribution site, 0 otherwise
Meal delivery = 1 if anyone receiving meals 3,995 0.01 0.10 0.00 1.00
at home from community
programs, 0 otherwise
Meal facility = 1 if anyone received meals 3,995 0.02 0.15 0.00 1.00
at a community center in past
month, 0 otherwise
Fingerprint = 1 if SNAP requires 3,995 0.33 0.47 0.00 1.00
fingerprinting of applicants, 0
otherwise
Report simple = 1 if SNAP uses simplified 3,995 0.87 0.33 0.00 1.00
reporting option for
households with earnings, 0
otherwise
Outreach Outreach spending (federal, 3,995 $150.19 $166.63 $0.00 $452.80
state, and grant), in $1,000
Notes: a Summary statistics for the observations that are not 0. Mean is not weighted. The grand mean for grocery tax rate is 0.0076.
b
Maximum household size, income, and age are suppressed protect respondent confidentiality.
Estimation and Results
Strategy to Address Endogeneity Issue
The primary econometric issue for the empirical model is the well-known endogeneity issue related
to SNAP participation. People may self-select into SNAP for reasons such as a stronger taste for food
consumption (Hoynes and Schanzenbach, 2009). In our case, the error term of the model subsumes
such unobservable taste factor and is potentially correlated with SNAP participation. Our empirical
strategy is to use instruments to control for SNAP endogeneity.
Following a study by Ratcliffe, McKernan, and Zhang (2011) on how SNAP participation affects
food security, we use three instrumental variables for SNAP participation. These are three state-level
dummy variables that capture variation in SNAP eligibility requirements and administrative options,
including the use of biometric technology (fingerprint scan) for identity verification, adoption of
simplified reporting, and SNAP outreach spending (federal, state, and grant combined). Biometric
testing is negatively correlated with SNAP participation because it imposes a transaction cost on the108 January 2019 Journal of Agricultural and Resource Economics
Table 3. Average (Food-at-Home) FAH and Food-Away-from-Home (FAFH) Expenditures by
Food Sales Tax Rates
Sort by Grocery Tax Sort by Restaurant Tax
Cash FAH Total FAH FAFH
Tax Rates N Expenditures Expenditures N Expenditures
0 3,307 $100.29 $117.02
(99.95) (107.06)
>0 to < 2% 53 $72.30 $86.34
(67.82) (73.75)
2% to < 4% 232 $93.05 $107.16
(97.10) (103.16)
4% to < 6% 174 $89.81 $102.57 405 $57.22
(80.17) (82.02) (60.03)
6% to < 8% 229 $88.55 $103.01 2,135 $58.34
(74.24) (86.13) (65.20)
8% to < 10% 1,056 $65.50
(91.21)
Notes: Numbers in parentheses are standard deviations.
Table 4. Tests on Instrument Validity
Null Hypothesis Test Statistics
F-test of excluded instruments Parameters for excluded instruments are 0 15.87
(Cragg–Donald F-statistic) (p < 0.01)
Stock–Yogo weak identification test Excluded instruments are weak 13.91
critical valuea
Kleibergen–Paap rk LM statistic Underidentification 46.34
(p < 0.01)
Hansen J statistic Instruments are valid 4.80
(p = 0.09)
Hall–Peixe redundancy test on fingerprint Instrument is redundant 9.21
(p < 0.01)
Report simple Instrument is redundant 28.67
(p < 0.01)
Outreach Instrument is redundant 3.01
(p = 0.08)
Durbin–Wu–Hausman endogeneity test on SNAP participation is endogenous 2.85
SNAP participation (p = 0.09)Zheng et al. Grocery and Restaurant Food Sales Taxes 109
application and reduces the probability of cheating the system. Simplified reporting eliminates the
requirement that participants regularly report changes in income and living conditions, and outreach
spending measures the amount of money spent spreading awareness about the program. Both
policies encourage participation and are therefore positively correlated with SNAP participation. In
addition, they satisfy the exclusion restriction assumption because, while they affect participation,
they do not impact FAH or FAFH expenditure. These variables are obtained from the USDA’s SNAP
Policy Database and are for the year of 2010, which is the most recent year of data available. Since
these policy changes do not vary much over time, we do not expect it to be an issue combining it
with the more recent FoodAPS data.
Table 4 presents a battery of tests on the instrument validity based on our primary FAH equation.
While we also run these tests for the FAFH equation, we suppress the results here since they
are almost identical to those for the FAH equation. The F-test in the first-stage regression on
the excluded three instruments yields a test statistic of 15.87, which exceeds the critical value of
the Stock–Yogo test statistic (13.91 for 5% maximal relative bias), suggesting the instruments are
not weak. The Kleibergen–Paap test on under-identification rejects the null hypothesis of under-
identification.7 We further conduct Hall–Peixe redundancy tests on the three instruments and reject
the null hypothesis that any instrument is redundant at the 10% significance level or better. Finally, a
Durbin–Wu–Hausman endogeneity test on SNAP participation shows that we cannot reject the null
hypothesis of endogeneity at the 10% level. We focus our discussion on the results using instruments
while presenting the results using the ordinary least squares (OLS) as well.
FAH Equation
Table 5 presents the estimated results for the FAH equation. We use robust standard errors for all
specifications in this paper.8 Column 1 presents the OLS (noninstrumented) results, where all the
core variables have the expected signs (note that SNAP participation is expected to decrease cash
FAH expenditures) and are statistically significant at the 10% level or better. Column 2 shows OLS
results for the model with full control variables. Column 3 reports two-stage-least-square (2SLS)
estimates for both stages. Because program participation is a dummy variable, column 4 differs from
column 3 in that the first stage is estimated using the logit model following the method suggested
by Wooldridge (2010, p. 622) for treating a dummy endogenous variable. Therefore, column 4
becomes our preferred specification. In the first stage, all instruments have the correct signs and
are statistically significant at the 10% level or better.
Focusing on the preferred specification in column 4 of Table 5, we find that a 1-percentage-
point increase (e.g., the tax rate changes from 5% to 6%) in grocery tax leads to a $2.06 decrease
in household weekly (cash) FAH expenditures (a 2.1% decrease) and a 1-percentage-point change
in the restaurant tax leads to a $3.31 increase in weekly FAH spending (a 5.5% increase). Such
numbers, though small at first glance, can easily aggregate to around $40 a month for a 5% tax
imposition (i.e., $2.06 × 5 × 4).
SNAP participation reduces FAH cash spending by $65.10, consistent with the summary
statistics presented in Table 2. As shown in Table 2, the average SNAP EBT payment is $93.81.
Therefore, the net impact of SNAP participation is an increase of $28.71 (i.e., 93.81 − 65.10) in
total FAH expenditure. The basket food price has a negative effect, consistent with Gregory and
Coleman-Jensen’s (2013) finding that food prices reduce food security. Both household size and
income positively affect FAH expenditures.
7 While the Hansen J statistic shows that the p-value for overidentification restrictions here is 0.09, the p-value for
overidentification restrictions when including a few additional control variables later (last specification in Table 7) is 0.17.
8 We did not include state dummy variables because all the instruments used are at the state level; including state dummies
will lead to collinearity problem between the instruments and the state dummies.110 January 2019 Journal of Agricultural and Resource Economics
N = 3, 995)
Table 5. Impacts of Food Sales Taxes on Food-at-Home (FAH) Expenditures (N
2SLS, First-Stage Linear 2SLS, First-Stage Logit
OLS Core OLS Full Second Stage First Stage Second Stage First Stage
1 2 3 4
Grocery tax −187.68∗∗∗ −185.03∗∗∗ −224.48∗∗∗ −0.87∗∗ −205.82∗∗∗ −6.10∗∗
(67.91) (68.58) (77.28) (0.38) (69.93) (2.58)
Restaurant tax 214.42∗ 341.89∗∗∗ 321.09∗∗∗ 1.79∗∗ 330.93∗∗∗ 11.36∗∗
(123.08) (122.80) (123.20) (0.82) (123.49) (5.25)
SNAP participation −48.71∗∗∗ −37.95∗∗∗ −89.46∗∗∗ −65.10∗∗∗
(3.07) (3.02) (33.70) (12.58)
Basket price −0.06∗∗ −0.06∗ −0.07∗∗ −0.0002 −0.06∗∗ −0.002∗
(0.03) (0.03) (0.03) (0.00) (0.03) (0.001)
Household size 13.72∗∗∗ 13.72∗∗∗ 17.02∗∗∗ 0.07∗∗∗ 15.46∗∗∗ 0.46∗∗∗
(1.01) (1.17) (2.48) (0.005) (1.48) (0.03)
Household income 4.50∗∗∗ 3.41∗∗∗ 2.35∗∗∗ −0.02∗∗∗ 2.85∗∗∗ −0.37∗∗∗
(0.62) (0.59) (0.83) (0.002) (0.63) (0.02)
(Head) age 0.31∗∗∗ 0.23∗∗ −0.002∗∗∗ 0.27∗∗∗ −0.01∗∗∗
(0.08) (0.10) (0.0004) (0.09) (0.003)
Education 2.85∗∗∗ 1.83∗∗ −0.02∗∗∗ 2.31∗∗∗ −0.11∗∗∗
(0.51) (0.83) (0.003) (0.56) (0.02)
Married 20.78∗∗∗ 11.18 −0.19∗∗∗ 15.72∗∗∗ −1.06∗∗∗
(3.21) (6.81) (0.01) (4.04) (0.10)
Black −27.96∗∗∗ −22.62∗∗∗ 0.09∗∗∗ −25.15∗∗∗ 0.41∗∗∗
(3.26) (4.86) (0.02) (3.54) (0.11)
Native American −5.37 0.28 0.11∗∗ −2.39 0.50∗
(6.32) (7.54) (0.05) (6.48) (0.26)
Asian −21.26∗∗∗ −26.54∗∗∗ −0.09∗∗∗ −24.04∗∗∗ −1.21∗∗∗
(6.71) (7.89) (0.03) (6.86) (0.30)
Hispanic −9.97 −10.73 0.00 −10.37 0.12
(18.03) (16.95) (0.08) (17.32) (0.56)
Travel time 0.52∗∗∗ 0.64∗∗∗ 0.002∗∗∗ 0.58∗∗∗ 0.01∗∗∗
(0.16) (0.19) (0.001) (0.17) (0.005)
No. SNAP retailers −0.01∗ −0.01 −0.00002 −0.01 −0.0001
(0.01) (0.01) (0.00003) (0.01) (0.0002)
No. fast food rest. −0.12∗∗∗ −0.13∗∗∗ 0.0003 −0.13∗∗∗ 0.003∗∗
(0.04) (0.04) (0.0002) (0.04) (0.001)
No. non-fast food rest. 0.02∗∗∗ 0.02∗∗∗ −0.00001 0.02∗∗∗ −0.0002
(0.01) (0.01) (0.00003) (0.01) (0.0003)
Any dieting 8.30∗∗∗ 9.40∗∗∗ 0.02 8.88∗∗∗ 0.20∗∗
(3.10) (3.21) (0.01) (3.14) (0.09)
Food pantry −5.21 4.67 0.19∗∗∗ 0.00 0.79∗∗∗
(5.65) (8.83) (0.03) (6.27) (0.17)
USDA foods −4.20 3.41 0.14∗∗∗ −0.19 0.67∗∗∗
(6.66) (8.89) (0.05) (7.07) (0.23)
Meal delivery −13.45 −11.41 0.04 −12.38 0.13
(8.44) (9.79) (0.07) (8.93) (0.35)
Meal facility −19.57∗∗∗ −20.68∗∗∗ −0.02 −20.15∗∗∗ −0.13
(6.85) (7.40) (0.04) (7.03) (0.27)
Fingerprint −0.08∗∗∗ −0.58∗∗∗
(0.03) (0.15)
Report simple 0.17∗∗∗ 1.24∗∗∗
(0.03) (0.22)
Outreach 0.0001∗ 0.001∗∗
(0.0001) (0.0005)
R2 0.16 0.20 0.16 0.23 0.19 0.25
Notes: Single, double, and triple asterisks (*, **, ***) indicate significance at the 10%, 5%, and 1% level. Standard errors are in parentheses.Zheng et al. Grocery and Restaurant Food Sales Taxes 111
Table 6. Impacts of Food Sales Taxes on Food-Away-from-Home (FAFH) Expenditures
N = 3, 596)
(N
Second Stage of 2SLS Second Stage of 2SLS
OLS Core OLS Full (First-Stage Linear) (First-Stage Logit)
1 2 3 4
Grocery tax 102.37 162.94∗∗ 125.54 145.85∗
(70.59) (74.07) (78.41) (75.83)
Restaurant tax 133.78 −62.95 −80.70 −71.07
(101.08) (100.05) (102.64) (100.37)
SNAP participation −16.34∗∗∗ −12.24∗∗∗ −51.48∗∗ −30.18∗∗
(2.72) (2.55) (25.19) (12.48)
Basket price 0.03 0.02 0.01 0.02
(0.02) (0.02) (0.02) (0.02)
Household size 5.93∗∗∗ 6.02∗∗∗ 8.62∗∗∗ 7.21∗∗∗
(0.80) (0.90) (1.95) (1.38)
Household income 3.66∗∗∗ 3.25∗∗∗ 2.43∗∗∗ 2.88∗∗∗
(0.55) (0.56) (0.75) (0.68)
R2 0.09 0.11 0.06 0.10
Notes: Single, double, and triple asterisks (*, **, ***) indicate significance at the 10%, 5%, and 1% level. Standard errors are in parentheses.
Effects of demographics, etc., are suppressed.
Regarding demographic effects, we find that older age, higher education, and being married
lead to higher FAH expenditure, while African Americans and Asians have lower FAH expenditures
compared with Caucasians. As to food access, longer travel time to the primary food store increases
FAH spending, possibly because shoppers with a longer distance shop less frequently and spend
more for each trip. The number of fast food restaurants within 5 miles of a household decreases
FAH expenditure, while the opposite is found to be true for the number of non–fast food restaurant
within the same radius. The availability of fast food restaurants might induce households to allocate
a smaller proportion of their food budgets to FAH.
FAFH Equation
Table 6 displays results for the FAFH equation. The first-stage results and results for the noncore
variables are suppressed to conserve space. The preferred specification in column 4 shows that a
1-percentage-point increase in the grocery tax leads to a $1.46 increase in weekly FAFH spending,
but the restaurant tax does not have a statistically significant effect on FAFH spending (though
the coefficient has the correct negative sign). Consistent with Wilde, Troy, and Rogers (2009),
SNAP participation is found to reduce FAFH expenditures. Though not presented in Table 6,
other noteworthy findings include the fact that African Americans and Asians have lower FAFH
expenditures compared with Caucasians, the number of non–fast food restaurants increases FAFH
expenditure, and—surprisingly—a household member on any kind of food diet leads to higher FAH
and FAFH expenditures. This may be due to healthier food, which often costs more than less healthy
food.Table 7. Additional Specifications
Food at Home Food Away from Home
Interaction Interaction Interaction SNAP County Interaction Interaction SNAP County
w/ Income w/ Border w/ SNAP Eligible Income w/ Income w/ SNAP Eligible Income
112 January 2019
1 2 3 4 5 6 7 8 9
Grocery tax −137.24 −269.56∗∗ −194.20∗∗∗ −181.88 −142.89∗∗ 166.59 51.44 −32.65 171.03∗∗
(90.08) (106.93) (70.93) (182.94) (69.05) (102.99) (91.14) (155.89) (76.38)
Restaurant tax 326.70∗∗∗ 324.33∗∗∗ 342.30∗∗∗ 306.89∗∗ 301.12∗∗ −72.01 −79.86 −17.61 −74.25
(123.14) (123.54) (125.89) (134.75) (124.79) (100.96) (101.94) (114.99) (99.94)
SNAP participation −65.22∗∗∗ −66.60∗∗∗ −64.51∗∗∗ −56.57∗∗∗ −57.21∗∗∗ −29.32∗∗ −31.19∗∗ −29.45∗∗ −27.56∗∗
(12.63) (12.95) (12.48) (20.98) (12.82) (12.42) (12.64) (14.48) (12.51)
Basket price −0.06∗∗ −0.06∗∗ −0.07∗∗ −0.06∗ −0.07∗∗ 0.02 0.02 −0.01 0.02
(0.03) (0.03) (0.03) (0.04) (0.03) (0.02) (0.02) (0.03) (0.02)
Household size 15.47∗∗∗ 15.44∗∗∗ 15.41∗∗∗ 13.90∗∗∗ 14.74∗∗∗ 7.16∗∗∗ 7.11∗∗∗ 6.29∗∗∗ 6.88∗∗∗
(1.48) (1.48) (1.47) (1.99) (1.47) (1.38) (1.37) (1.31) (1.38)
Household income 2.97∗∗∗ 2.85∗∗∗ 2.86∗∗∗ −3.33 2.59∗∗∗ 2.93∗∗∗ 2.90∗∗∗ −1.59 2.83∗∗∗
(0.68) (0.63) (0.63) (2.61) (0.61) (0.72) (0.68) (1.71) (0.67)
Grocery tax × income −19.55 −5.37
(20.96) (18.54)
Grocery tax × border −139.45
(185.94)
Grocery tax × SNAP 236.07 64.40 349.96 425.79
(266.90) (370.02) (299.59) (356.39)
County income 0.0001∗∗∗ 0.0003
(0.0003) (0.0002)
No. of obs. 3,995 3,995 3,995 2,257 3,995 3,596 3,596 1,997 3,596
R2 0.19 0.19 0.19 0.18 0.21 0.10 0.10 0.04 0.10
Notes: Single, double, and triple asterisks (*, **, ***) indicate significance at the 10%, 5%, and 1% level. Standard errors are in parentheses. Effects of demographics, etc., are suppressed.
Journal of Agricultural and Resource EconomicsZheng et al. Grocery and Restaurant Food Sales Taxes 113
Additional Specifications
This subsection describes a few additional specifications that explore whether taxes have differential
impacts with income, SNAP participation, and others, and how robust the results are when additional
control variables are included. Table 7 reports the results. The first specification stems from the
consideration that food sales taxes could be regressive by disproportionately affecting lower-income
households. Columns 1 and 6 show the results with an interaction term between grocery tax and
income, based on the preferred specifications in Tables 5 and 6. The interaction effect is not
statistically significant. Hence, our results do not support the contention that food sales taxes
disproportionately impact those with lower incomes.
Second, previous studies show some evidence that consumers might cross a state border to shop
for food (e.g., Walsh and Jones, 1988; Tosun and Skidmore, 2007) and cigarettes (Harding, Leibtag,
and Lovenheim, 2012) when there is a sizeable tax difference. We therefore create a dummy variable,
Border, to indicate counties that tax groceries (a positive combined state and county tax rate) and
share borders with counties that exempt groceries. The interaction of grocery taxes and the border
effect again is not significant (column 2 of Table 7), possibly because only 148 households fit this
category.
Third, based on the conceptual framework, we test whether grocery taxes have a less pronounced
effect on SNAP recipients by adding an interaction between SNAP participation and grocery taxes.
We find an insignificant interaction effect (columns 3 and 7 of Table 7). Several things could possibly
explain this finding: First, the tax impact depends on where a consumer is located on the initial
budget constraint (different locations of the white dot in Figure 2). The tax impact will be larger
for consumers with higher preferences for FAH. Second, each consumer’s degree of substitution
between FAH and the other good could be different (i.e., different gray or different black dots in
Figure 2). Third, current tax rates might be too small to make a discernable difference (i.e., difference
between the black and gray dots may be too small). Fourth, even SNAP recipients generally still need
to cover most of their FAH need with their cash. It is possible that SNAP recipients are aware of
the grocery tax on their cash receipts but do not notice the missing sales tax from their receipts for
SNAP purchases.9 To explore the first two reasons further, we reduce consumer heterogeneity by
restricting the analysis to only households that are eligible to receive SNAP benefits using the 185%
poverty rate as the threshold. Results (columns 4 and 8) still show an insignificant grocery tax effect,
providing more support for the other reasons.
Finally, we present the results obtained from including several additional controls in columns
5 and 9 of Table 7. One is county-level per capita income. We already include household income.
However, one potential concern is that if county-level taxes are correlated with county-level income,
then leaving out county income could result in a biased estimate of tax effect. Second, we include
how often the household uses nutrition facts panel and three other dummy variables related to
shopping behavior, indicating whether in the past 30 days the household shopped for food at i) a
convenience store, ii) a discount (big box) store, or iii) a wholesale club. Our results remain robust,
with the tax impacts becoming somewhat smaller for the FAH equation and larger for the FAFH
equation. For shopping behavior, we find that consumers who shopped for food at a wholesale club
recently or consumers with more frequent use of nutrition facts panel have higher FAH expenditures.
Conclusions
This study provides the first empirical examination of consumers’ eating behaviors in response
to grocery and restaurant taxes. The focus of the research is on two important policy questions,
namely i) Do food sales taxes affect consumers’ expenditures on grocery food and restaurant food?
and ii) Are food expenditures of government food assistance program participants less sensitive to
9 We thank an anonymous reviewer for suggesting this explanation.114 January 2019 Journal of Agricultural and Resource Economics
food sales taxes? The analysis is based on food sales tax data at the county level combined with
the USDA’s new National Household Food Acquisition and Purchase Survey (FoodAPS), the first
nationally representative survey of American households on food purchases and acquisitions, which
provides a rich dataset on consumer behavior.
The results indicate that a 1-percentage-point increase in grocery tax leads to a $2.06 decrease
in weekly (cash) FAH spending and a $1.46 increase in weekly FAFH spending. This suggests that
consumers respond to grocery taxes even though this tax is added at the register and therefore not
reflected in the shelf price. We also find that a 1-percentage-point increase in restaurant tax leads to
a $3.31 increase in weekly FAH spending but does not affect FAFH spending.
Several findings may have important policy implications. First, the grocery tax changes
consumers’ allocation of food dollars between FAH and FAFH because it changes their relative
prices. Considering that many state and local governments use grocery taxes as a means of
generating revenue, we find an unintended consequence of the grocery tax, which might have
further health implications considering that restaurant meals may be nutritionally poorer than meals
prepared at home. Furthermore, we find that a restaurant tax increases consumers’ FAH spending,
suggesting that a tax on fast food might effectively encourage consumers to eat more at home.
Second, we do not find any differential impacts of food sales taxes by consumers’ income or
SNAP participation status. These two results suggest that, overall, food sales taxes are not regressive.
However, this result may be due to the fact that FoodAPS oversampled low-income households;
the under-representation of wealthier households may have caused the lack of significance in the
grocery tax–income interaction term. Third, we do not find evidence that consumers might cross a
state border to shop for food when there is sizeable food tax difference. However, this result may be
due to the fact that only 148 households in the survey fit this category.
Our findings that consumers respond to food sales taxes also contribute to the growing literature
of tax salience. Although both grocery taxes and restaurant taxes are generally not posted on the
shelf or on menus and are only added after checking out, our results show that many consumers
are still attentive to food sales taxes (under the conventional assumption of one-to-one tax pass-
through). This result is consistent with other sales tax studies on specific products, such as bottled
water (Berck et al., 2016).
Finally, these results should be interpreted with some caution since only 1 year of data were used
due to the unavailability of historical county-level food sales tax data. Powell et al. (2013) point out
that cross-sectional studies tend to overestimate the association between fast food prices and weight
outcomes by about 25% compared with longitudinal estimates. In this respect, our results likely
should be properly interpreted as an upper bound on food sales tax impacts.
[Received January 2018; final revision received April 2018.]You can also read