Fiscal policies and taxation incentives for improved public bus systems in India - A product of WRI Ross Center for Sustainable Cities
←
→
Page content transcription
If your browser does not render page correctly, please read the page content below
Fiscal policies and taxation
      incentives for improved public
      bus systems in India

A product of WRI Ross Center for Sustainable Cities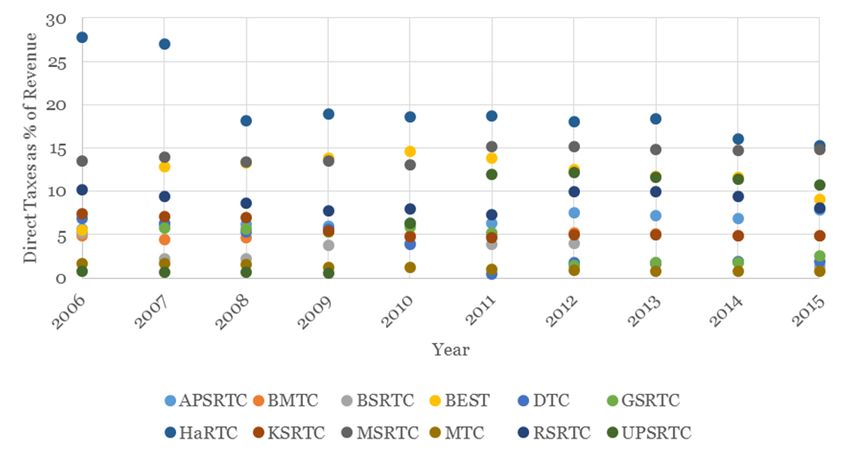
About Shakti:

Shakti Sustainable Energy Foundation works to strengthen the energy security of India by
aiding the design and implementation of policies that support renewable energy, energy
efficiency and the adoption of sustainable transport solutions.

Disclaimer:

The views/analysis expressed in this report/document do not necessarily reflect the views of
Shakti Sustainable Energy Foundation. The Foundation also does not guarantee the accuracy
of any data included in this publication nor does it accept any responsibility for the
consequences of its use.

*For private circulation only.

                                                                       1 | www.WRIcitiesIndia.org
EXECUTIVE SUMMARY
Unprecedented vehicular growth in India has resulted in chronic congestion across most
urban centres. Traditional measures to mitigate congestion – through road-widening and the
construction of flyovers – have failed to solve the problem. In this context, the Government
of India recognised the importance of using road space more efficiently by releasing the
National Urban Transport Policies (NUTP) in 2006 and 2014; policies aiming to prioritise
public transport.
In India, buses form the mainstay of intra and intercity public transport, catering to almost
75% of total trips. However, the poor financial condition of the numerous State Road
Transport Undertakings (SRTUs) providing bus-based public transport in India is cause for
concern. The extent of their loss-making precludes the ability to constantly invest in
improving the quality and frequency of bus services. With no significant improvements in
bus services, commuters have little incentive to move to – or remain using – public buses,
exacerbating the trend of private vehicles clogging Indian roads.
A major cause of SRTU loss-making is the extant tax framework prevailing at both the state
and union level. High taxes on both inputs and revenues push SRTUs into losses, and
funding for improving bus-based public transport is erratic. This appears to contradict the
NUTP in many ways.
This paper analyses recent trends in both direct and indirect taxes on SRTUs, noting that
many state SRTUs would report a state of financial autonomy in the absence of direct levies.
Variations in the rate and computation of direct taxes such as Motor Vehicle Tax across
states result in little parity in SRTU taxation across India. The rates of Motor Vehicle Tax
per SRTU bus on a lifetime basis are far higher than for private two or four wheelers,
indicating a bias against public transport. Increases in Excise Duty on diesel have also
resulted in a higher tax component of inputs being reported by SRTUs in recent years.
Unlike several countries across the world, India does not use fuel taxation as instrument to
promote public transport; rather, taxing both SRTUs and private users at the same rate.
This paper also finds that despite carrying the bulk of public transport passengers, SRTUs do
not receive the numerous tax exemptions granted to other mass-rapid transit systems such
as metro rail networks.
As such, with current fiscal policy actually favouring private transport, there is a need to
institute a friendlier tax environment for SRTUs to keep bus fares constant and modernise
bus facilities. As SRTU contributions to Excise Duty form a relatively small component of
total Excise collections on fuel, this paper advocates a reduction in fuel taxes for SRTUs. It
also advocates the simplification and harmonising of Motor Vehicle Tax computations for
SRTUs across states, and recommends the use of direct tax rebates linked to improvements
in SRTU performance, reducing the need for SRTUs to request grants from state and central
governments.
2 | www.WRIcitiesIndia.orgCONTENTS
Sl. Section Page
Context and Problem Setting 5
1 1.1 Vehicular Growth, Congestion and Public Transport in India 5
1.2 SRTU Financial Positions 5
The Current Tax Framework for SRTUs 8
2.1 Taxes Levied 8
2.2 Direct Taxation and SRTU Financial Instability 9
2.3 Variations in Direct Tax across States 10
2
2.4 Motor Vehicle Tax – Private and Public Vehicles 12
2.5 Trends in Indirect Taxation 13
2.6 Fuel Tax – Private and Public Vehicles 16
2.7 The Tax Framework: Buses and Other Mass Transit 16
Policy Alternatives 18
3.1 Feasibility of Alternative Fiscal Policy Options 18
3
3.2 Fuel Taxes 18
3.3 Direct Taxes 20
4 Policy Recommendations 22
5 Conclusion 24
6 Appendix 25
7 References 30
3 | www.WRIcitiesIndia.orgABBREVIATIONS USED
Abbreviation Full Form
AMRUT Atal Mission for Rejuvenation and Urban Transformation
APSRTC Andhra Pradesh State Road Transport Corporation
ASRTU Association of State Road Transport Undertakings
BEST Brihanmumbai Electric Supply and Transport
BMTC Bangalore Metropolitan Transport Corporation
CIRT Central Institute of Road Transport (Pune)
CSTC Calcutta State Transport Corporation
DTC Delhi Transport Corporation
GSRTC Gujarat State Road Transport Corporation
GST Goods and Service Tax
JnNURM Jawaharlal Nehru National Urban Renewal Mission
KSRTC Karnataka State Road Transport Corporation
MoPNG Ministry of Petroleum and Natural Gases
MORTH Ministry of Road Transport and Highways
MTC Metropolitan Transport Corporation, Chennai
NUTP National Urban Transport Policy
PPAC Petroleum Planning and Analysis Cell
RSRTC Rajasthan State Road Transport Corporation
UPSRTC Uttar Pradesh State Road Transport Corporation
VAT Value Added Tax
4 | www.WRIcitiesIndia.org1. CONTEXT AND PROBLEM SETTING
1.1 VEHICULAR GROWTH, CONGESTION, AND PUBLIC
TRANSPORT IN INDIA
Exponential vehicular growth in India – a 6.2-fold increase1 in two decades, driven primarily
by increases in private vehicles – has resulted in reduced traffic speeds and endemic
congestion across most urban areas2 in the country. The economic cost of freight transport
delays alone as a result of congestion has been estimated at INR 1,384 billion3 annually,
without accounting for the loss of productivity of citizens delayed in traffic, the health costs
of increased vehicular emissions, or the cost of lives lost in increasing road accidents.
Across the world, it has been recognised that congestion cannot be alleviated by widening
roads or constructing flyovers and underpasses; that the optimal approach to combat
congestion combines improving urban public transport and discouraging private vehicle
use4. Indian policy announcements in the past decade appear to have followed this context.
The National Urban Transport Policies (NUTP) of 2006 and 2014 have prioritised public
transport on Indian roads5. Both the erstwhile Jawaharlal Nehru National Urban Renewal
Mission and current Atal Mission for Rejuvenation and Urban Transformation include urban
public transport as a focus area 6, and an important component of a ‘smart city’ in the recent
Smart Cities Mission is sustainable public transport and last-mile connectivity 7 .
Indian public transport thus will have to play a critical role in containing urban traffic
congestion. Historically and currently, public transport in India has been bus-based. As of
2014-15, public bus operators ferried an estimated 74% of total passenger-trips by formal
public transport in India, detailed in Table A of the appendix. The majority of formal bus
public transport in India is provided by a total of 62 government-owned Road Transport
Corporations8, referred to as State Road Transport Undertakings (SRTUs) in this paper.
Larger cities have recently begun to introduce rail-based modes of mass transit such as metro
rail systems. While these ferry a higher number of passengers per kilometre of network than
public buses, they are extremely capital-intensive and require high passenger demand along
their corridors to remain viable. It is impossible for mass rapid rail transport systems to
effectively serve all areas of a city, requiring a feeder transit service to effectively broaden their
reach. As of today, it is estimated that around 64% of public transport trips in Delhi – the city
with the country’s most extensive metro rail network – are made by bus, and that close to 38%
of metro trips involve buses as first and/or last-mile connectivity 9. Buses thus play – and will
continue to play – the most important role in Indian public transport, and in this context, the
poor financial position of most SRTUs in recent years is particularly worrisome.
1.2 SRTU FINANCIAL POSITIONS
Table 1.2.1 below highlights the financial position of 42 reporting SRTUs for the years 2012-
15. SRTUs have been divided into city-specific and state-wide (intercity and intra-city)
operators for the purpose of this paper, given the different operating conditions faced
(congestion, frequency of stops) by the two.
5 | www.WRIcitiesIndia.orgTable 1.2.1: SRTU Financial Positions 2012-1510, 11, 12
Sl. Year Operator Type Percentage of Reporting Operators
Declaring Declaring Declaring
Surplus/ Losses of INR
Breaking Even 1 Billion 1 Billion
City SRTU 0.00% 33.33% 66.67%
1 2012-13
State SRTU 12.12% 66.67% 21.21%
City SRTU 0.00% 33.33% 66.67%
2 2013-14
State SRTU 2.94% 55.88% 41.18%
City SRTU 0.00% 44.45% 55.55%
3 2014-15
State SRTU 11.76% 50.00% 38.24%
As this table indicates, most SRTUs have reported heavy losses in recent years, with at least
half of all city operators declaring losses in excess of INR 1 billion a year. Financially
unstable SRTUs usually lack the resources to invest in enhancing bus services, improving
customer service, or augmenting fleet; leading to insufficient bus frequencies, poor
maintenance, and the plying of ageing, uncomfortable and unsafe buses. This serves as a
poor incentive to switch to public transport; rather, it incentivises moving from public
transport to two wheelers or other private vehicles. In this context, it is not particularly
surprising that the mode-share of bus-based public transport has begun to decline since the
early 2000s1 3, an unhealthy trend especially when juxtaposed with the growth in private
vehicles.
There are multiple reasons for this precarious financial condition. As SRTUs have not been
established with a purely commercial aim, they are not free to set their own fares; these fares
determined by the relevant state government – often at levels significantly below cost
recovery. SRTUs also need to fulfil various social obligations such as operating on low -
demand, uneconomical routes and providing a wide range of concessions to different
vulnerable groups1 4. Steep increases in the cost of operations, combined with the inability to
raise fares, have placed most SRTUs in an unstable financial position.
A noticeable drain on SRTU revenues, however, are multiple direct taxes levied by the state
and central governments on bus operations. Given that the cost of many critical inputs for
SRTUs also includes a tax component, taxation on SRTUs both inflates operating costs and
reduces revenues. In 2008, Kharola & Tiwari concluded that government levies, in the form
of various taxes, comprised close to 20% of the average SRTU’s cost1 5. In essence, this
appears a policy contradiction – while the NUTP emphasises the need to
prioritise public transport on roads, the current fiscal environment for public
buses curtails their finances, hampering the process of service enhancement
and augmentation. While SRTUs can apply for funding from central schemes, Urban
Transport Funds or budgetary grants from the state, such funding is never guaranteed and
varies widely across years and political climates, making it difficult to prepare long-term
plans for fleet enhancement based on such grants1 6.
6 | www.WRIcitiesIndia.orgThe following section discusses the current tax policy framework for bus services in India.
Based on available data, it focusses on the extent to which taxes exacerbate the financial
instability of SRTUs. It then compares the tax environment for buses with that of (a) private
vehicles and (b) other forms of mass transit, thus evaluating whether the existing fiscal
policy encourages bus transport use. Policy alternatives are then discussed, along with
recommendations for tax reform.
7 | www.WRIcitiesIndia.org2. THE CURRENT TAX FRAMEWORK FOR SRTUs
2.1 TAXES LEVIED
SRTUs are liable for a multitude of taxes on capital assets as well as operations. Both the
central and state governments levy taxes on SRTU operations. However, as transport is a
State Subject of the Indian Constitution17 , the majority of taxes faced by SRTUs are levied by
the state.
It is also necessary to distinguish between direct and indirect taxes levied on SRTUs. Direct
taxes are usually levied on SRTU revenues (from transporting passengers, or revenue gained
from advertising). Indirect taxes are taxes built into inputs consumed by SRTUs as part of
regular operations, for example, diesel and spare parts.
Table 2.1.1 below classifies taxes paid by SRTUs into direct, indirect, central and state taxes.
A more detailed table of taxes and their descriptions is provided in the appendix. Taxes that
are levied on employee incomes – such as professional and income tax – are not included in
the analysis as they neither affect SRTU revenues nor are passed on to commuters.
Table 2.1.1: Taxes Levied on SRTUs18
State Tax Central Tax
(1) Motor Vehicle Tax (11) Service Tax 19
(2) Passenger Tax
Direct Tax (3) Advertisement Tax
(4) Stamp Duty
(5) Property Tax
(6) Municipal Levies
(7) Value Added Tax/Sales Tax (12) Customs Duty
Indirect Tax (8) Entry Tax (13) Central Excise Duty
(9) Octroi
(10) Labour Cess
Given the complexity involved in estimating indirect taxes – which are not accounted for
separately by SRTUs, this paper will focus on the following five forms of taxes, which form
the majority of SRTU tax payments:
Motor Vehicle Tax and Passenger Tax which form the bulk of direct taxes on most
operators, and for which data is available;
Central Excise Duty, Entry Tax, Sales Tax/VAT on fuel, the most significant taxable
commodity consumed by operators. While Customs Duty also serves as a levy on fuel
purchases, the timing of the levy – before it is sold to the dealer – makes any suggestion
for changes in this duty for fuel consumed by SRTUs difficult. As the other duties are
levied after fuel is received by the dealer, it is significantly more feasible on the accounting
front to recommend policy changes.
A total of ten SRTUs have been selected for this analysis. Of these ten, five are city bus
operators, each operating in one of India’s most populated cities (Bengaluru, Chennai, Delhi,
8 | www.WRIcitiesIndia.orgKolkata and Mumbai). The remaining five operators (Andhra Pradesh State Road Transport
Corporation, Gujarat State Road Transport Corporation, Karnataka State Road Transport
Corporation, Rajasthan State Road Transport Corporation, and Uttar Pradesh State Road
Transport Corporation) are state operators running a combination of urban and rural
services. In distributing cases of city and state operators equally, this research sought to
understand whether city operators face a different tax regime from state-wide providers20 .
2.2 DIRECT TAXATION AND SRTU FINANCIAL INSTABILITY
The most significant direct tax levied on SRTUs is Motor Vehicle Tax, a state tax levied to
meet the costs of construction and maintenance of roadways21 . With the exception of
Calcutta State Transport Corporation (which is exempted from Motor Vehicle Tax in the
state of West Bengal), all SRTUs are liable to pay Motor Vehicle Tax. Certain states also levy
a Passenger Tax on revenue earned from ferrying passengers. These taxes, combined, form
the bulk of direct tax payments.
Previous research up to 2011 highlighted the increase in direct taxes as a prime cause for
SRTU fiscal losses. In this context, data from 2010 to 2015 is analysed below to ascertain
whether the same trend has continued.
In analysing ‘increasing’ direct taxes, solely evaluating whether SRTUs have paid higher tax
in 2014-15 than in 2010-11 is disingenuous. Direct taxes, in general, are correlated with
changes in the revenue of SRTUs; increases in total direct taxes paid could simply reflect
higher SRTU revenues over the years. A more accurate indicator of the ‘burden’ of direct
taxes on SRTUs is whether direct taxes have been increasing at a higher rate than revenue
increases of SRTUs, thus leaving less revenue available for the SRTU to invest in operations
and improvements. This is expressed as the tax/revenue ratio, illustrated (as a percentage)
in figures 2.2.1 and 2.2.2 below:
Figure 2.2.1 Tax/Revenue Ratio (City SRTUs)22
9 | www.WRIcitiesIndia.orgFigure 2.2.2 Tax/Revenue Ratio (State SRTUs)23
While trends vary across SRTUs, the general observation is that – barring DTC and APSRTC
– the direct tax environment has not become significantly more restrictive since 2010-11;
that revenues have risen faster than direct tax collections. It is however important to note
that direct taxes were already extremely high for state operators in 2010-11, and that as of
2015, four out of the five state SRTUs surveyed in this research forego close to 10% of their
revenue in direct taxes alone. While city SRTUs are liable for a relatively lower rate of direct
taxes than their state counterparts, they are also subject to significantly more difficult service
conditions that result in higher operating costs. In this context, the impact of any loss in
revenue due to direct taxes is far more severe.
Direct taxes thus reduce SRTU revenues, increasing financial instability. However, distinct
variation exists across city and state operators. For most state operators surveyed in this
research, their direct tax arrears are greater than their yearly losses, indicating that a simple
reduction in direct taxes could provide them a degree of financial autonomy. City operators’
tax-to-losses proportion – barring BMTC – do not usually exceed 10% of their yearly losses,
which suggests a multi-pronged approach to improve their financial viability will need to be
taken. The detailed tables (E and F) are provided in the appendix.
2.3 VARIATIONS IN DIRECT TAX ACROSS STATES
As Motor Vehicle Tax – the most significant direct tax – is a state tax, both the rate of tax as
well as the method of computation varies widely across states. While different states can
present different operating climates and revenue earning prospects for SRTUs, the extent of
variation in Motor Vehicle Tax across states far exceeds any conceivable variation in either of
1 0 | www.WRIcitiesIndia.orgthese parameters across states. Broadly speaking, the method of Motor Vehicle Tax
computation can be classified into four categories:
Table 2.3.1: Methods of Computing Motor Vehicle Tax23
Sl. Method Description
1 Revenue - As a percentage of traffic revenue of the SRTU;
2 Capacity - Based on the total number of bus seats being offered by the SRTU;
- Based on the total capacity (seats + standees) offered by the SRTU;
3 Route type - As a function of the type of route being served (city, suburban, ghat,
‘A’ class, ‘B’ class etc);
- As a function of the total distance of the route;
4 Bus type - Taxation derived from t he class of service being operated (ordinary,
deluxe, express etc);
- Taxation based on whether the bus is intended for regular operation
or is a spare.
Some states follow a combination of several of these methods. For example, in Tamil Nadu,
Motor Vehicle Tax is levied based on the total seating capacity of each bus, with different
rates for buses operating on ‘city’, ‘mofussil’, ‘town’ and ‘ghat’ routes. Added to this, spare
buses are charged at a lower rate than regular buses. Details are provided in the appendix.
Apart from being complicated, the current MV Tax structure results in an extremely
heterogeneous tax environment for SRTUs across the country. This is exacerbated by the
fact that certain states charge a Passenger Tax on revenue earned from passenger transport
by SRTUs, whereas others do not. Figure 2.3.1 below depicts the variations in direct tax
rates (as a percentage of revenue) for 12 SRTUs over a period of 10 years:
Figure 2.3.1: Variations in Direct Tax Rates (As Percentage of Revenue)24
1 1 | www.WRIcitiesIndia.orgEach dot in the figure above indicates the effective rate of direct tax paid by an SRTU for a
particular year. As is visible, the range of rates from the lowest to highest tax rate for a year
is not insignificant – for example, Haryana Road Transport Corporation (HaRTC)’s effective
direct tax rate for 2006, at 28%, was 28 times that of the rate faced by the Uttar Pradesh
State Road Transport Corporation (UPSRTC) – which effectively paid 1% of its revenue in
direct taxes. There is little justification for such high variance in tax rates or methods of
computing such tax.
2.4 MOTOR VEHICLE TAX – PRIVATE AND PUBLIC
VEHICLES
Unlike private vehicles, SRTUs do not pay Motor Vehicle Tax as a one-time payment on the
value of buses purchased by them; rather, they are levied Motor Vehicle Taxes on a quarterly
or annual basis depending on the state in question. As such, SRTUs pay a significantly
higher rate of tax on a per-vehicle basis than private users in most Indian states.
Table 2.4.1 compares the effective rate of tax paid over the lifetime of a bus in four states:
Gujarat, Karnataka, Maharashtra and Punjab, with a mix of city and state SRTUs. For this
calculation, the lifespan of a bus is taken as 8 years, and the cost of a new, UBS-II compliant
bus is taken as INR 3.5 million. For simplicity, the effective Motor Vehicle Tax per bus is
held constant for 8 years, based on 2014-15 tax rates:
Table 2.4.1: Effective Motor Vehicle Tax Rate for SRTU Buses 25
Total Motor Fleet Tax/Bus Tax/Bus % Value of
State SRTU Vehicle Tax Size (INR) (Lifetime) Bus
2014-15 (INR) (INR)
Gujarat GSRTC 2607.8 million 7765 335,840.3 2.69 million 76.76%
Karnataka KSRTC 1579.1 million 8321 189,772.9 1.52 million 43.38%
Maharashtra BEST 383.55 million 4247 90,310.8 0.72 million 20.64%
Punjab PUNBUS 856.2 million 1242 689,329.3 5.51 million 157.56%
The effective lifetime tax rates for private vehicles in the following states are as follows:
Table 2.4.2: Motor Vehicle Tax Rates for Two and Four Wheelers
State Two Wheeler Tax Rate Four Wheeler Tax Rate
Gujarat 26 6% of vehicle value 6% of vehicle value
Karnataka27, 28 10-12% of vehicle value 13-18% of vehicle value
Maharashtra29 7% of vehicle value 7% of vehicle value
Punjab30 1.5-3% of vehicle value 2% of vehicle value
Figure 2.4.1 on the following page compares the lifetime rate of taxation for private vehicles
and SRTU buses. While not every state exhibits the extent of variation seen in Punjab, none
of the surveyed states tax SRTU buses at a lower effective rate than private vehicles. It could
be argued that SRTU buses, as transport vehicles, earn revenue during their service, thus
justifying this higher rate of taxation. There are two flaws with this argument; first, certain
1 2 | www.WRIcitiesIndia.orgstates already tax passenger revenue through Passenger Tax, making the imposition of
higher rates of Motor Vehicle Tax a case of dual taxation. Even in states that do not levy
Passenger Tax, if SRTUs were allowed to function on purely commercial lines, this line of
argument might be sustained. However, given their constraints on fare-setting, the
numerous concessions granted, and their requirement to operate not just on profitable
routes renders their service far from strictly commercial, and does not support the
proposition to tax them on commercial grounds.
Figure 2.4.1: Comparison of Lifetime Tax Rates for Private Vehicles and SRTU
Buses
2.5 TRENDS IN INDIRECT TAXATION
For the analysis of indirect taxes levied on SRTUs, this paper focusses on fuel taxes. The two
major components of fuel tax are Excise Duty (a central tax) and Sales Tax or VAT at the
state level. As crude oil prices declined sharply post-2014, the government decided to
increase Excise Duty rates on fuel to increase revenue, rather than passing on the benefit to
consumers. This steep increase in duty is visible in figure 2.5.1 on the following page.
As the government increased Excise Duty at a time when crude oil prices were falling
sharply, this increase in taxes does not translate to a significant increase in overall fuel
expenditure by operators. However, the tax component of fuel has increased substantially,
especially since 2015.
Unlike the case of direct taxes, all operators have witnessed a higher fuel tax-to-revenue ratio
in 2014-15 compared to 2012-13 (Figures 2.5.2 and 2.5.3), indicating an increasing burden of
fuel taxation. Unfortunately, insufficient data is available post 2015 to estimate precise
expenditure on fuel taxes; however, given the increase in Excise Duty, it is certain that SRTU
expenditure on fuel taxes has increased substantially.
1 3 | www.WRIcitiesIndia.orgFigure 2.5.1: Excise Duty Revisions31
Figure 2.5.2: Tax/Revenue Ratio (City SRTUs)32
1 4 | www.WRIcitiesIndia.orgFigure 2.5.3 Tax/Revenue Ratio (State SRTUs)33
Unlike the nominal impact of direct taxes on SRTU losses for city operators, the effect of fuel
taxes is stark; lowered fuel taxes could greatly reduce financial losses. For state operators,
the impact of fuel taxes is similar to that of direct taxes. Tables J and K in the appendix
detail this impact. Fuel taxes, thus, impact city operators more than their state counterparts:
Figure 2.5.4 Composition of Taxes (City SRTUs) Figure 2.5.5 Composition of Taxes (State SRTUs)
The greater impact of fuel taxes for city operators can be attributed to their lower fuel
efficiency, given city traffic conditions. This suggests that interventions in fuel
taxation will yield significantly greater impact for city operators than their
state-level counterparts.
1 5 | www.WRIcitiesIndia.org2.6 FUEL TAX: PRIVATE AND PUBLIC VEHICLES
As of today in India, there exists no difference in fuel tax rates for retail consumers and
SRTUs, barring Rajasthan, which offers a VAT discount on fuel supplied to RSRTC. From a
fiscal perspective, there is thus no distinction between private vehicle users and SRTUs in
terms of fuel taxation. However, it is also relevant to briefly analyse the ‘dual-pricing’
scheme for fuel introduced by the then UPA government in 2013, extant until 2015. Facing
soaring crude oil prices, mounting under-recoveries by Oil Marketing Companies (OMCs)
and a spiralling subsidy bill, the government decided to bring the prices of diesel in India to
market rates. This was carried out using two methods:
(a) Allowing OMCs to increase the price of diesel at retail bunks by INR 0.50 until parity
was reached with market rates;
(b) Entirely removing the subsidy on diesel supplied to bulk consumers34
The subsidy component per litre of High Speed Diesel from 2012 to 2015 was as follows:
Table 2.6.1: Subsidy Component per Litre of High Speed Diesel 2012-1535
Subsidy Component per Litre
Sl Year
of High Speed Diesel (INR)
1 2012-13 11.26
2 2013-14 8.39
3 2014-15 2.70
As prominent bulk consumers include SRTUs and the railways, this scheme effectively
amounted to subsidising retail consumers – consumers with their own vehicles – at the cost
of public transport users. Thus, rather than using fuel fiscal policy as an instrument to
incentivise public transport – by increasing taxes or reducing subsidies on fuel for private
vehicle owners – the Government of India has preferred to opt for the reverse policy in the
recent past, primarily due to political expediency.
2.7 THE TAX FRAMEWORK: BUSES AND OTHER MASS
TRANSIT
As mentioned at the outset of this section, SRTUs are liable for up to 13 different taxes, with
few or no tax exemptions. Newer mass transit modes such as metro rail systems have,
however, witnessed a significantly more favourable fiscal climate. The Delhi Metro, for
example, is exempt from all taxes except Wealth Tax and Fringe Benefit Tax, also enjoying
exemptions from electricity duty 36. As of 2014-15, the Delhi Metro was liable for a total tax of
INR 2.53 million on revenue of INR 35.62 billion – i.e. DMRC’s tax liability was less
than 0.0001% of its revenues or costs37. Newer metro projects are also exempted from
most prevailing taxes, though slight differences can apply across states.
Given that 75% of public transport in India is bus-based; and that buses are likely to remain
the mainstay of Indian public transport for several decades more, the lack of fiscal support
for SRTUs is a policy distortion against public transport. While metro rail networks do
provide ‘cleaner’ transit than road-based modes, their lack of flexibility precludes them from
1 6 | www.WRIcitiesIndia.orgbecoming a viable public transport system for cities as a whole. In this context, there is an
urgent need to promote bus-based public transport through all means possible, including
fiscal incentives.
It is thus evident that multiple distortions exist in the current tax framework for bus-based
public transport in India; that SRTUs are subject to higher tax liabilities than both private
vehicles and other forms of mass transit.
1 7 | www.WRIcitiesIndia.org3. POLICY ALTERNATIVES
3.1 FEASIBILITY OF ALTERNATIVE FISCAL POLICY OPTIONS
The previous section has highlighted several distortions in the current tax framework faced
by SRTUs; that taxes often mean the difference between a revenue surplus and significant
loss-making, and that neither direct nor fuel taxes provide any incentive for commuters to
shift to bus-based public transport from private modes; often favouring private transport
instead. In essence, the current fiscal policy contradicts the National Urban Transport Policy
by curbing the ability of SRTUs to innovate, resulting in poorer bus facilities being provided
to the travelling public, and by not providing strong disincentives to private vehicle usage.
In highlighting policy alternatives, it is important to evaluate the extent to which they
achieve the following objectives:
- Reducing the financial instability of SRTUs;
- Allowing SRTUs greater autonomy in fleet augmentation and service quality
enhancement;
- Encouraging public transport usage and discouraging the use of private vehicles.
Any alternative fiscal policy suggestion also needs to be feasible at two levels:
- Financial: While the reduction of taxes on bus-based public transport will lead to
multiple benefits, it is critical to understand the extent to which tax revenues from
SRTUs contribute to overall tax revenues. If the contribution is minor, the revenue
loss from reduced SRTU taxation can easily be offset by marginally raising taxes for
private vehicle users. If, however, the contribution is major, it is significantly more
difficult to offset losses from lower SRTU taxation by increasing taxes on private
users – given that it is rarely politically viable to steeply increase taxes on private
vehicles. This thus necessitates other methods to increase fiscal revenue to
counteract the reduced revenue from SRTUs.
- Implementation: The ability and ease with which any tax reduction for SRTUs can
actually be implemented on the ground, and restricted purely to SRTUs, is an
important aspect of any alternative fiscal policy suggestion. For example, while it
might be financially feasible to reduce taxes on spare parts procured by SRTUs,
preventing arbitrage (reselling) of tax-exempt spare parts sold to SRTUs, or ensuring
that tax-exempt spare parts are sold only to SRTUs is an extremely difficult
endeavour.
The following sections detail alternative policy options for (a) fuel taxes and (b) direct taxes.
3.2 FUEL TAXES
Table 3.2.1 on the following page indicates the contributions of SRTUs to total Excise Duty
collections on fuel for the year 2013-14, the latest year for which data is available. Of 62
SRTUs, data on fuel consumption of the 28 largest operators was reported. Even assuming
an increase in fuel consumption by 75% when including the remaining 34 SRTUs – an
optimistic estimate considering many of the non-reporting SRTUs operate very small fleets –
it is estimated that SRTUs contribute only 3.36% of total Excise revenues on petroleum
products:
1 8 | www.WRIcitiesIndia.orgTable 3.2.1: SRTU Contributions to Excise Duty Collections 38
Sl. Revenue from Revenue from 28 Estimated Revenue % of Revenue from
Excise Duty on Largest SRTUs from 62 SRTUs SRTU Taxes
Petrol and Diesel
1 INR 495.7 billion INR 9.49 billion INR 14.87 billion 3.36%
Given the relatively insignificant contribution of SRTUs to total collections, there is a strong
case to be made for Excise Duty rebates to SRTUs, especially for city operators that manage
lower fuel efficiency due to congestion. Table 3.2.2 below indicates the extra Excise Duty
retail purchasers would need to pay to mitigate revenue losses from concessions to public
transport. As is visible, even with a full rebate on Excise Duty to SRTUs, the increase in
Excise Duty for retail purchasers remains within manageable levels.
Table 3.2.2: Effects of Excise Duty Rebates on Retail Consumers
Sl. Policy Alternative - Revenue Shortfall in Increase in Excise Duty on
Excise Duty Rebate for Excise Duty Retail Purchasers to Cover
SRTU Collections Shortfall
1 0% - business as usual 0% 0
2 25% 0.84% 15 paise/litre
3 50% 1.68% 30 paise/litre
4 75% 2.52% 45 paise/litre
5 100% 3.36% 61 paise/litre
However, a uniform increase in Excise Duty for both petrol and diesel, as illustrated above,
might prove counterproductive, as the price of diesel strongly impacts the freight transport
industry as well. In this context, focussing the majority of Excise Duty increases on petrol to
counteract revenue loss from reduced SRTU taxation is likely to yield a more important
objective – reducing private vehicle utilisation and encouraging public transport.
Research by Agrawal (2012) indicates a long-run price elasticity of petrol of -0.85; that is, a
1% increase in the price of petrol will lead to a 0.85% contraction in petrol consumption in
the long run39. Apart from reducing non-essential travel and decongesting roads, a decline
in petrol consumption will help lessen the outflow of foreign exchange from the central
exchequer. While precise data on SRTU contributions to taxes on fuel at the state level isn’t
currently available, there is already precedent for an Indian state providing VAT rebates on
fuel supplied to SRTUs, as is the case in Rajasthan. Combined fuel tax rebates at both the
central and state level will go a long way in alleviating SRTU financial instability, as Tables J
and K in the appendix illustrate.
In order to prevent arbitrage – along with increasing efficiency, Excise Duty rebates for
SRTUs should be linked with improvements in refuelling practices, ideally through the SRTU
tendering out its refuelling requirements in bulk, a condition of which must include
electronic monitoring of fuelling practices.
1 9 | www.WRIcitiesIndia.org3.3 DIRECT TAXES
Table 3.3.1 below identifies the contribution of SRTUs to the transport department of their
state for the year 2014-15. As was the case with direct tax rates, there are wide variations in
the contributions of SRTUs across states:
Table 3.3.1: SRTU Contributions to Transport Department Revenues40
Sl. State Number of Transport Revenue % of
Reporting Department from SRTU Revenue
SRTUs Revenue Direct Tax from SRTU
(INR Million) (INR Million) Taxes
1 Andhra Pradesh 1 16,991.9 3,789.5 22.30%
2 Gujarat 2 28,175.3 2,620.2 09.30%
3 Karnataka 4 44,562.3 4,157.2 09.33%
4 Maharashtra 6 57,982.2 11,205.2 19.33%
5 NCT (Delhi) 1 13,869.6 213.7 01.54%
6 Rajasthan 1 22,320.3 1,492.6 06.68%
7 Tamil Nadu* 7 38,291.4 1,849.8 04.83%
8 Uttar Pradesh 1 37,969.6 3,520.9 09.27%
9 West Bengal 3 14,823.3 53.3 00.36%
* T he different divisions of the Tamil Nadu State Transport Corporation have been treated separately for this analysis.
It is cause for concern that SRTU taxation accounts for close to a quarter of certain states’
transport department collections. This indicates that the SRTU is regarded more as a source
of revenue than an agent of public mobility. The centrality of SRTU tax receipts to Transport
Department revenue in several of the states mentioned above also makes it extremely
difficult to substitute the burden of SRTU tax reduction to other consumers. Variations in
the importance of SRTU tax receipts across states also make it problematic to suggest
uniform direct tax policy alternatives for the country.
What benefits would arise out of reducing or removing direct taxes for SRTUs? While the
removal of direct taxes would certainly push many SRTUs closer towards financial
autonomy, in the case of certain SRTUs, it would lead to an operational surplus being
generated. In these instances, the impact of reducing or removing direct taxes could be
measured in terms of the number of buses that could be purchased with this surplus, and the
increase in daily passenger capacity generated. Table 3.3.2 below measures this impact for
four of the ten SRTUs surveyed; SRTUs that would have declared a surplus in 2014-15 in the
absence of direct taxes:
Table 3.3.2: Impact of Eliminating Direct Tax in Bus Purchase Terms 41
Sl. SRTU Surplus without Direct Taxes Number of Buses
(INR Million) Obtainable with Surplus*
1 GSRTC 1272.87 363
2 KSRTC 1144.26 326
3 UPSRTC 3545.68 1013
4 BMTC 461.75 131
* T he cost of a bus is assumed at INR 3.5 million.
20 | www.WRIcitiesIndia.orgWith this information, it is also possible to evaluate the impact of direct tax reduction on the
extra passenger capacity an SRTU could offer, were it to invest its surplus thus received into
augmenting fleet. An ordinary bus catering to UBS-II standards offers 42 seats. As of 2014-
15, city and state SRTUs reported an average daily vehicle utilisation of 164.58 and 259.52
kilometres respectively 42. As such, Table 3.3.3 below highlights the extra daily capacity – in
terms of passenger kilometres offered – possible with different levels of reduction in direct
taxes.
Table 3.3.3: Impact of Eliminating Direct Tax in Increased Passenger Carrying
Capacity
Sl. SRTU Increased Daily Passenger Kilometres Offered from Reducing Direct Taxes
0% Tax 25% Tax 50% Tax 75% Tax Removal of
Reduction Reduction Reduction Reduction Direct Taxes
(BAU)
1 GSRTC 0 km 990,990 km 1.98 million km 2.97 million km 3.96 million km
2 KSRTC 0 km 889,980 km 1.78 million km 2.67 million km 3.56 million km
3 UPSRTC 0 km 2.77 million km 5.53 million km 8.30 million km 11.06 million km
4 BMTC 0 km 226,958 km 453,915 km 680,873 km 907,830 km
Thus, for SRTUs that would have reported a surplus in the absence of direct taxes, the effects
of reducing or removing such taxes could be expressed in capacity increase terms, and
treated as a recurring ‘grant’ to augment fleet by the state. However, exact proposals for
changes in direct taxes will need to be taken at the state level, given the wide variations in
SRTU direct tax contributions to the respective state exchequers.
Extant direct tax policies, in charging private vehicle users a lower rate of taxation than
SRTU operators, have created an implicit subsidy towards private transport. While reducing
direct taxes for SRTUs and increasing direct taxes on private vehicles can incentivise the use
of public transport, this fiscal measure is less likely to reduce congestion on roads than fuel
tax measures. This is because it provides no incentive to use personal vehicles less frequently
once purchased. While direct taxes do increase the cost of buying a private vehicle, research
suggests the price elasticity of vehicles to be lower in general than the price elasticity of
fuel43. Reducing direct taxes can however go a long way in improving SRTU financial
autonomy, as indicated by Tables G and H in the appendix.
This section has provided policy alternatives for both fuel and direct taxes on SRTUs,
highlighting both the benefits caused by such alternatives as well as the impact they will have
on the relevant state or central exchequer. The following section sets out policy
recommendations for reform of the existing fiscal policy towards SRTUs.
21 | www.WRIcitiesIndia.org4. POLICY RECOMMENDATIONS
The previous two sections have contrasted the existing tax policy for SRTUs in India with
potential policy alternatives, listing out the costs and benefits of each alternative. Drawing
from these two sections, the following policy changes are recommended:
Using fuel taxation to encourage mode-shifts towards public and bus transport
Fiscal policies around fuel are often used by countries that wish to promote public transport
and greener forms of transit. In the UK, for example, the Bus Operator’s Service Grant
(BSOG) is a subsidy provided by local councils to offset fuel taxes paid by the operator. It
performs the dual objective of helping operators maintain affordable fare levels and enabling
operators to run services that might not otherwise have been profitable, leading to
cancellations44.
In India, however, fiscal policies around fuel have not been used to subsidise public
transport or disincentivise private vehicle use; rather, the dual-pricing scheme prevalent
between 2013 and 2015 effectively subsidised private users at the cost of bus-based public
transport. As previously discussed, the removal of Excise Duty even in its entirety for SRTUs
would not significantly impact Excise Duty collections on fuel, and can be offset by a modest
increase in Excise Duty for retail consumers. This will both drive down retail fuel demand
and facilitate mode-shifts towards buses. In this context, a TERI (2007) report estimates
that increasing the mode-share of buses to 70% could reduce India’s fuel demand by as much
as 18%, saving the exchequer significant foreign exchange 45.
This policy change thus fulfils several objectives; it reduces SRTU costs, also reducing their
dependence on government grants to function; it reduces congestion by making non-
essential commutes by private vehicles uneconomical. It is also financially feasible, and can
be implemented with enough safeguards to prevent arbitrage of tax-exempt fuel sold to
SRTUs.
Gradually eliminating the Motor Vehicle Tax ‘subsidy’ provided to private vehicles
The current state of affairs, wherein several states’ Transport Departments depend heavily
on revenue collected from SRTU taxation, is extremely unsustainable. As of today, the
higher effective rates of Motor Vehicle Tax for SRTU buses than for private vehicles creates a
perverse subsidy towards private vehicle ownership. It is thus necessary to gradually bring
about parity in these rates – by progressively reducing Motor Vehicle Taxes on SRTUs, and
increasing them for private vehicles. Lower Motor Vehicle Tax liabilities by SRTUs reduce
their financial instability, and in some cases, allow them to add capacity to cater to growing
public demand. States can also link reductions in Motor Vehicle Taxes on SRTUs to
improved performance metrics by the operators, thus using fiscal policy to improve SRTU
efficiency within the state.
Reducing the difference in Motor Vehicle Tax rates across states
There is a strong need to reduce the extent of variation in Motor Vehicle Taxation for SRTUs
across states to ensure a level playing field for SRTUs. A single method of computation
should ideally be followed across states. Of the existing methods to compute Motor Vehicle
22 | www.WRIcitiesIndia.orgTax in India, affixing it as a portion of the SRTU’s overall traffic revenue requires the least
amount of administrative work, and is considerably less error-prone than levying it based on
the total capacity offered by the SRTU. However, if this method is followed, care should be
taken to ensure that the ‘effective’ rate of tax paid by an SRTU does not exceed that paid by
private operators, who are usually taxed based on capacity.
Abolishing Passenger Tax for SRTUs
Passenger Tax is levied on SRTUs in certain states – on the revenue gained from
transporting passengers. While private buses, and in some cases, taxis, are also liable for
this tax, the latter two are allowed to operate on commercial principles, which SRTUs by
nature of their operations are not permitted to do. As SRTUs are far from operating on
purely commercial terms, the levy of a tax that treats them as such is not justified. The
revenue lost through abolishing of Passenger Tax on SRTU operations can be offset through
higher taxation on other commercial passenger vehicles in the state.
Providing greater fiscal support to city SRTUs
SRTUs that operate purely within the boundaries of a city face significantly more challenging
operating conditions than state-wide operators. Traffic congestion increases bus idling time,
resulting in lower fuel efficiencies and vehicle productivity, both of which cause operating
costs to rise. City operators thus tend to be significantly less financially stable than other
operators, and thus merit additional financial or fiscal relief from the government.
These five policy recommendations, taken together, can realise the objective of promoting
sustainable public transport in India – by discouraging the use of private vehicles on Indian
roads, and by providing SRTUs greater financial autonomy in augmenting and improving
services. Apart from the benefits of reducing congestion, containing emissions and reducing
traffic fatalities mentioned at the start of this paper, other benefits associated with a
reduction of taxes on SRTUs include:
(a) Reduced administrative work for state governments and faster decision making
Under the current tax framework, many state operators report surpluses before direct taxes
are levied. Post tax payments, they report losses and require subsidy payments from the
state in question. This convoluted flow of money entails significant administrative work for
both the state government as well as the SRTU, wasting numerous man-hours in accounting
and budgeting. Loss-making SRTUs also require government financial assistance even for
relatively minor projects, given their lack of capital. This requires government approvals and
processing, resulting in delays across projects and systemic improvements. Financially
stable SRTUs can unilaterally invest in improving systems, leading to faster, more visible
improvements in the quality of service.
(b) Keeping fares low
Most SRTUs in India base fare revisions on the cost of operations. While SRTUs cannot
raise fares unilaterally, when fare increases are approved, the higher cost of operations
(which includes tax components) is passed on to the commuter. In reducing taxes, requests
for fare increases also decline, allowing fares to remain stable or even reduce. From a
political perspective, keeping fares stable is often welcomed, given the negative press bus
fare increases generate.
23 | www.WRIcitiesIndia.org5. CONCLUSION
The unprecedented growth in demand for personal vehicles in India, prompted by rising
personal income, has resulted in Indian urban road infrastructure being put under heavy
stress. Noting the rising congestion – and the failure of conventional, road infrastructure-
based solutions to such congestion – the Government of India had sought to prioritise public
transport through multiple policy announcements and schemes in the past decade.
As has been discussed, the existing fiscal policy towards bus-based public transport has
contradicted this resolve to improve public transport. The current Motor Vehicle Tax
structure for public buses is significantly higher than for private vehicles. Unlike several
other countries across the world, India does not use fuel taxation as a method to encourage
public transport use. Newer forms of mass transit that serve a much smaller section of
India’s commuting population have been granted extensive tax exemptions, all of which have
been denied to SRTUs.
The current fiscal approach – or business as usual – hampers the speed at which SRTUs can
enhance services. Stagnant service quality further hampers the ability of bus-based public
transport to attract new commuters or retain existing users. Thus, business as usual
exacerbates the problem of increasing private vehicle usage, resulting in further congestion.
This situation, however, is not irreversible. Fiscal policies can be changed to provide greater
financial support to SRTUs, and a more restrictive approach toward private vehicle
ownership and utilisation. These changes, though beneficial in both the short and long -run,
will require great political will to implement.
NOTE ON GST
At the time of publishing this paper, the GST Council is yet to arrive at a conclusive
agreement on the rates of GST as well as its exclusions.
From the point of view of this paper, the subsuming of indirect taxes into GST on buses and
bus spare parts is unlikely to significantly impact the findings of this research. However, if
GST is eventually extended to cover petroleum products, the subsuming of Excise Duty and
Sales Tax/VAT on diesel into GST can affect the financial position of SRTUs. However, it
appears likely that the Central Government will be able to offer fuel tax rebates to SRTUs
even under the GST, allowing for a more favourable taxation policy towards public transport.
24 | www.WRIcitiesIndia.org6. APPENDIX
Table A: Estimated Public Transport (PT) Passenger-trips 2014-15
Sl. Transport Mode Passenger-trips Trips Ferried (As %
2014-15 of Total PT Trips)
1 Bus – Reporting SRTUs 25.43 billion46 74%
2 Rail 8.04 billion47 23%
3 All Metro (Bengaluru, Delhi, 1.16 billion48 03%
Kolkata, Mumbai)
Table B: Taxes Levied on SRTUs49
Sl. Tax Area of Levy
1 Advertisement Tax Revenue from advertisements placed on buses/at stations
2 Central Excise Duty Purchase of new buses and/or chasses
Purchase of spare parts
Diesel consumed
3 Customs Duty Imported buses or spare parts
Diesel consumed
4 Entry Tax Same as (2)
5 Labour Cess On building and construction work carried out by a contractor
6 Motor Vehicle Tax Operation of buses on roads (road tax)
7 Municipal Levies As defined by the municipal body
8 Octroi Same as (2)
9 Passenger Tax Revenue earned from transporting passengers
10 Property Tax Immovable properties owned by the SRTU
11 Service Tax Chartered services
Commercial revenue
12 Stamp Duty Acquisition of land
13 Value Added Tax/Sales Tax Same as (2), also on scrap items and minor civil bills
Figure A: Average Cost Breakup 2014-15: All Reporting Operators50
25 | www.WRIcitiesIndia.orgTable C: Direct Tax Payments: City Operators 51
Direct Tax Payments (INR Million)
Figures in brackets represent direct taxes as
Sl. Operator a percentage of revenue
2010- 2011- 2012- 2013- 2014-
2011 2012 2013 2014 2015
Brihanmumbai Electric Supply and 582.2 192.2 261.6 248.4 383.5
1
Transport (BEST) (5.23%) (1.46%) (1.83%) (1.73%) (2.54%)
Bangalore Metropolitan Transport 666.2 773.5 841.4 983.6 1110.8
2
Corporation (BMTC) (5.01%) (5.21%) (5.07%) (4.88%) (4.92%)
Calcutta State Transport Corporation 0 0 0 0 0
3
(CSTC) (0.00%) (0.00%) (0.00%) (0.00%) (0.00%)
43.1 224.4 216.9 225 213.7
4 Delhi Transport Corporation (DTC)
(0.43%) (1.76%) (1.66%) (1.86%) (1.92%)
Metropolitan Transport Corporation, 97.3 99.2 105.4 107.0 111.8
5
Chennai (MTC) (1.07%) (0.95%) (0.84%) (0.79%) (0.81%)
Table D: Direct Tax as a Percentage of Revenue: (State Operators) 52
Direct Tax Payments (INR Million)
Figures in brackets represent direct taxes as
Sl. Operator a percentage of revenue
2010- 2011- 2012- 2013- 2014-
2011 2012 2013 2014 2015
Andhra Pradesh State Road Transport 3269.1 4320.8 4778.9 5106.2 3789.5
1
Corporation (APSRTC) (6.27%) (7.58%) (7.17%) (6.86%) (7.88%)
Gujarat State Road Transport Corporation 2734.6 2748.7 2914.6 3242.2 2607.8
2
(GSRTC) (13.89%) (12.51%) (11.72%) (11.67%) (9.11%)
Karnataka State Road Transport 975.6 1168.3 1281.3 1454.2 1579.2
3
Corporation (KSRTC) (4.63%) (5.04%) (4.94%) (4.90%) (4.92%)
Rajasthan State Road Transport 897.3 1397.8 1442.3 1508.9 1492.6
4
Corporation (RSRTC) (7.37%) (9.93%) (9.99%) (9.36%) (8.12%)
Uttar Pradesh State Road Transport 2418.5 2770.9 2936.6 3380.1 3520.9
5
Corporation (UPSRTC) (11.93%) (12.14%) (11.61%) (11.38%) (10.74%)
26 | www.WRIcitiesIndia.orgTable E: Direct Tax Contribution to SRTU Losses: City Operators 53
Taxes as % of Losses
Sl. Operator
2010- 2011- 2012- 2013- 2014-
2011 2012 2013 2014 2015
Brihanmumbai Electric Supply and
1 15.27% 5.22% 4.15% 3.32% 4.53%
Transport (BEST)
Bangalore Metropolitan Transport
2 Profit Profit 56.87% 66.65% 171.15%
Corporation (BMTC)
Calcutta State Transport Corporation
3 0% 0% 0% 0% 0%
(CSTC)
4 Delhi Transport Corporation (DTC) 0.18% 0.92% 0.72% 0.65% 0.54%
Metropolitan Transport Corporation,
5 4.23% 4.27% 9.06% 7.54% 5.09%
Chennai (MTC)
Table F: Direct Tax Contribution to SRTU Losses: State Operators 54
Taxes as % of Losses
Sl. Operator
2010- 2011- 2012- 2013- 2014-
2011 2012 2013 2014 2015
Andhra Pradesh State Road Transport
1 121.62% 81.73% 128.7% 56.57% 63.67%
Corporation (APSRTC)
Gujarat State Road Transport Corporation
2 170.38% 68.32% 123.59% 167.6% 195.34%
(GSRTC)
Karnataka State Road Transport
3 Profit Profit Profit 604.71% 720.01%
Corporation (KSRTC)
Rajasthan State Road Transport
4 46.21% 143.18% 22.24% 35.31% 48.06%
Corporation (RSRTC)
Uttar Pradesh State Road Transport
5 499.11% Profit 355.52% 256.97% Profit
Corporation (UPSRTC)
27 | www.WRIcitiesIndia.orgTable G: Estimated Fuel Tax (Excise Duty and VAT) Paid 2012-15 (City Operators)55
Fuel Tax Paid (In Million INR)
Sl. Operator
2012- 2013- 2014-
2013 2014 2015
Brihanmumbai Electric Supply and
1 417.71 487.49 509.02
Transport (BEST)
Bangalore Metropolitan Transport
2 1,236.75 1,469.11 1,985.54
Corporation (BMTC)
Calcutta State Transport Corporation
3 106.51 105.77 114.67
(CSTC)
Metropolitan Transport Corporation,
4 905.82 1,139.21 1,146.32
Chennai (MTC)
Table H: Estimated Fuel Tax (Excise Duty and VAT) Paid 2012-15 (State
Operators)56
Fuel Tax Paid (In Million INR)
Sl. Operator
2012- 2013- 2014-
2013 2014 2015
Andhra Pradesh State Road Transport
1 5,610.00 5,973.00 4,673.03
Corporation (APSRTC)
Gujarat State Road Transport Corporation
2 2,168.43 2,714.71 3,035.31
(GSRTC)
Karnataka State Road Transport
3 2,540.57 3,301.13 3,276.18
Corporation (KSRTC)
Rajasthan State Road Transport
4 977.43 1,395.24 1,666.18
Corporation (RSRTC)
Uttar Pradesh State Road Transport
5 2,607.69 2,625.37 3,404.98
Corporation (UPSRTC)
28 | www.WRIcitiesIndia.orgTable J: Fuel Tax Contribution to SRTU Losses: City Operators 57
Taxes as % of Losses
Sl. Operator
2010- 2011- 2012- 2013- 2014-
2011 2012 2013 2014 2015
Brihanmumbai Electric Supply and No No
1 6.63% 6.51% 6.01%
Transport (BEST) data data
Bangalore Metropolitan Transport No No
2 83.59% 99.54% 305.92%
Corporation (BMTC) data data
Calcutta State Transport Corporation No No
3 7.19% 6.27% 7.19%
(CSTC) data data
Metropolitan Transport Corporation, No No
4 77.92% 80.26% 52.23%
Chennai (MTC) data data
Table K: Fuel Tax Contribution to SRTU Losses: State Operators 58
Taxes as % of Losses
Sl. Operator
2010- 2011- 2012- 2013- 2014-
2011 2012 2013 2014 2015
Andhra Pradesh State Road Transport No No
1 151.08% 66.17% 78.52%
Corporation (APSRTC) data data
Gujarat State Road Transport Corporation No No
2 91.95% 140.33% 227.36%
(GSRTC) data data
Karnataka State Road Transport No No
3 Profit 1373% 1493%
Corporation (KSRTC) data data
Rajasthan State Road Transport No No
4 15.07% 32.65% 53.65%
Corporation (RSRTC) data data
Uttar Pradesh State Road Transport No No
5 315.7% 199.59% Profit
Corporation (UPSRTC) data data
29 | www.WRIcitiesIndia.org7. REFERENCES
1MORTH. (201 6, 03 31 ). Total Number of Registered Motor Vehicles in India (1 951, 1 956, 1 959 -
2015). Retrieved from Indiastat:
http://www.indiastat.com/table/transport/30/registeredvehicles/16443/6121/data.aspx
2Agarwal, O.P. (2006). Urban Transport. In A. Rastogi (Ed.), India Infrastructure Report 2006 (p.
207 ). New Delhi: OUP.
3 Transport Corporation of India, IIM-Calcutta. (201 6, 6 7 ). TCI & IIM Calcutta launch Joint Study
Report on “Operational Efficiency of Freight Transportation by Road in India”. Retrieved from
Transport Corporation of India: http://www.tcil.com/tcil/pdf/press/Press%20ReleaseTCI -
IIMC_Report.pdf
4 Litman, T. (2017 ). Generated Traffic and Induced Travel: Implications for Transport Planning.
V ictoria: V ictoria Transport Policy Institute. Retrieved from http://www.vtpi.org/gentraf.pdf
5Ministry of Urban Dev elopment. (2006, 07 01). National Urban Transport Policy. Retrieved from
Directorate of Urban Land Transport Karnataka:
http://www.urbantransport.kar.gov.in/National%20Urban%20TransportPolicy.pdf
6PricewaterhouseCoopers. (2016, 3). India’s changing urban development agenda. Public Finance
Newsletter, pp. 2-8. Retrieved from http://www.pwc.in/assets/pdfs/pf/archives/public -finance-
quarterly-issue-xi.pdf
7 Government of India. (2017 , 1 1 ). Smart City Features. Retriev ed from Smart Cities Mission:
http://smartcities.gov.in/content/innerpage/smart-city-features.php
8ASRTU. (2015). About ASRTU. Retrieved from Association of State Road Transport Undertakings :
http://www.asrtu.org/about-asrtu
9Goel, R., & Tiwari, G. (2014). Promoting Low Carbon Transport in India; Case Study of Metro
Rails in Indian Cities. New Delhi: Magnum.
10MORTH. (2014, 01 01 ). Rev iew of the Performance of State Road Transport Underta kings (SRTUs)
(Passenger Serv ices for April, 201 2 - March, 2013). Retrieved from Ministry of Road Transport and
Highway s: http://morth.nic.in/showfile.asp?lid=1178
11 MORTH. (201 5, 01 01). Review of the Performance of State Road Transport Undertakings
(Passenger Serv ices) for April 2013 - March 2014. Retrieved from Ministry of Road Transport and
Highway s: http://morth.nic.in/showfile.asp?lid=1724
12 MORTH. (201 6, 01 01). Review of the Performance of State Road Transport Undertakings
(Passenger Serv ices) for April, 201 4 - March, 2015. Retrieved from Ministry of Road Transport and
Highway s: http://morth.nic.in/showfile.asp?lid=2025
13National Transport Development Policy Committee. (2013). Urban Transport. Retrieved 5 1 3, 2016,
from Planning Commission:
http://planningcommission.nic.in/sectors/NTDPC/v oulme3_p2/urban_v3_p2.pdf
1 4 ASRTU. (2005). Rev italization of Passenger Road Transport Sectors. New Delhi: ASRTU.
15Kharola, P. S., & Tiwari, G. (2008). Urban Public Transport Sy stems: Are the Taxation Polic ies
Congenial for Their Surv ival and Growth? Economic and Political Weekly, 41 -47.
16Pucher, J., Korattyswaroppam, N., & Ittyerah, N. (2004). The Crisis of Public Transport in India:
Ov erwhelming Needs but Limited Resources. Journal of Public Transportation, 7 (3), 95 -113.
17 Bakshi, P. (2009). The Constitution of India. New Delhi: Univ ersal Law Publishing. P. 367
30 | www.WRIcitiesIndia.orgYou can also read