Using smartphones and wearable devices to monitor behavioural changes during COVID-19 - arXiv
←
→
Page content transcription
If your browser does not render page correctly, please read the page content below
Original Paper

Using smartphones and wearable devices to monitor
behavioural changes during COVID-19

Shaoxiong Sun1, PhD; Amos A Folarin1,2, PhD; Yatharth Ranjan1, MSc; Zulqarnain
Rashid1, PhD; Pauline Conde1, BSc; Callum Stewart1, MSc; Nicholas Cummins3, PhD;
Faith Matcham4, PhD; Gloria Dalla Costa5, MD; Sara Simblett4,13, PhD, Letizia Leocani5,
MD, PhD; Per Soelberg Sørensen6, MD; Mathias Buron6, MD; Ana Isabel Guerrero7, MSc;
Ana Zabalza7, MD; Brenda WJH Penninx8, PhD; Femke Lamers8, PhD; Sara Siddi9, PhD;
Josep Maria Haro9, MD; Inez Myin-Germeys10, PhD; Aki Rintala10, MSc; Til Wykes4,13,
PhD, Vaibhav A Narayan11, PhD; Giancarlo Comi12, MD; Matthew Hotopf4,13, PhD;
Richard JB Dobson1,2, PhD; RADAR-CNS consortium14

1The  Department of Biostatistics and Health informatics, Institute of Psychiatry, Psychology and
Neuroscience, King’s College London, London, UK
2Institute of Health Informatics, University College London, London, UK
3Chair of Embedded Intelligence for Health Care & Wellbeing, University of Augsburg, Germany
4Institute of Psychiatry, Psychology and Neuroscience, King’s College London, London, UK
5University Vita Salute San Raffaele, Neurorehabilitation Unit and Institute of Experimental Neurology,
IRCCS Ospedale San Raffaele, Milan, Italy
6Danish Multiple Sclerosis Centre, Department of Neurology, Copenhagen University Hospital

Rigshospitalet, Copenhagen, Denmark
7Multiple Sclerosis Centre of Catalonia (Cemcat), Department of Neurology/Neuroimmunology, Hospital
Universitari Vall d’Hebron, Universitat Autònoma de Barcelona, Barcelona, Spain
8Department of Psychiatry, Amsterdam UMC, Vrije Universiteit and GGZinGeest, Amsterdam, The
Netherlands
9Parc Sanitari Sant Joan de Déu, CIBERSAM, Universitat de Barcelona, Sant Boi de Llobregat, Barcelona,
Spain
10Centre for Contextual Psychiatry, Department of Neurosciences, KU Leuven, Leuven, Belgium
11Janssen Research and Development LLC, Titusville, NJ, USA
12Institute of Experimental Neurology, IRCCS Ospedale San Raffaele, Milan, Italy
13South London and Maudsley NHS Foundation Trust, London, UK
14www.radar-cns.org

Corresponding author
Shaoxiong Sun
Email:shaoxiong.sun@kcl.ac.uk
Telephone: +44 (0)20 7848 0951
SGDP Centre, IoPPN
King's College London
Box PO 80
De Crespigny Park, Denmark Hill
London
SE5 8AF
Abstract
Background: In the absence of a vaccine or highly effective treatment for COVID-19,
countries have adopted Non-Pharmaceutical Interventions (NPIs) such as social distancing
and full lockdown. An objective and quantitative means of passively monitoring the impact
and response of these interventions at a local level is urgently required.
Objective: We aimed to explore the utility of the recently developed open-source mobile
health platform RADAR-base as a toolbox to rapidly test the effect and response to NPIs
aimed at limiting the spread of COVID-19.
Methods: We analysed data extracted from smartphone and wearable devices and
managed by the RADAR-base from 1062 participants recruited in Italy, Spain, Denmark,
the UK, and the Netherlands. We derived nine features on a daily basis including time spent
at home, maximum distance travelled from home, maximum number of Bluetooth-enabled
nearby devices (as a proxy for physical distancing), step count, average heart rate, sleep
duration, bedtime, phone unlock duration, and social app use duration. We performed
Kruskal-Wallis tests followed by post-hoc Dunn’s tests to assess differences in these
features among baseline, pre-, and during-lockdown periods. We also studied behavioural
differences by age, gender, body mass index (BMI), and educational background.
Results: We were able to quantify expected changes in time spent at home, distance
travelled, and the number of nearby Bluetooth-enabled devices between pre- and during-
lockdown periods (P < .001 for all five countries). We saw reduced sociality as measured
through mobility features, and increased virtual sociality through phone usage. People were
more active on their phones (P < .001 for Italy, Spain, and the UK), spending more time
using social media apps (P < .001 for Italy, Spain, the UK, and the Netherlands),
particularly around major news events. Furthermore, participants had lower heart rate (P
< .001 for Italy, Spain; P = .02 for Denmark), went to bed later (P < .001 for Italy, Spain,
the UK, and the Netherlands), and slept more (P < .001 for Italy, Spain, and the UK). We
also found that young people had longer homestay than older people during lockdown and
fewer daily steps. Although there was no significant difference between the high and low
BMI groups in time spent at home, the low BMI group walked more.
Conclusions: RADAR-base, a freely deployable data collection platform leveraging data
from wearables and mobile technologies, can be used to rapidly quantify and provide a
holistic view of behavioural changes in response to public health interventions as a result
of infectious outbreaks such as COVID-19. RADAR-base may be a viable approach to
implementing an early warning system for passively assessing the local compliance to
interventions in epi/pandemics and could be particularly vital in helping ease out of
lockdown.

Keywords:
mobile health; COVID-19; behavioural monitoring; smartphones; wearable devices

Introduction
On 11 March 2020, the World Health Organisation (WHO) declared the rapidly spreading
SARS-CoV-2 virus outbreak a pandemic. This novel coronavirus is the cause of a
contagious acute respiratory disease (COVID-19), which was first reported in Wuhan,
Hubei Province, China [1–3]. As of 1 July 2020, it had infected over ten million people
and spread to 213 countries and territories around the world [4]. While precise statistics on
mortality are being determined, COVID-19 can be deadly with an estimated 1% case
fatality rate, and this rate increases dramatically for the elderly and vulnerable who have
underlying health problems [5,6]. The outbreak of COVID-19 has placed an unprecedented
burden on healthcare systems in most-affected countries and has resulted in considerable
economic losses and possible deep global recession [7,8].

To date, there is no vaccine or highly effective treatment. The widely adopted strategy has
been the use of Non-Pharmaceutical Interventions (NPIs) such as social distancing and
even full lockdown in order to control the spread of the virus and ease pressure on health
and care systems [9,10]. NPIs have been implemented in many countries including China,
Italy, Spain, the United Kingdom (UK), and the Netherlands. These measures have been
shown to considerably reduce the new confirmed cases [9]. Key to the success of NPIs is
the timing of these interventions and the response of the population, both of which might
differ among countries, and could necessitate further interventions in the case of low
compliance either nationally or locally. Furthermore, eleven trillion dollars of fiscal
measures have been announced by more than two-thirds of governments across the world
in an attempt to mitigate the fallout from the pandemic and lockdown [11]. Therefore, we
urgently require an objective and quantitative way to monitor population behaviour to
assess the impact and response of such interventions. Additionally, we need to monitor for
the potential effects of a rebound in cases in the winter months as social distancing
measures are relaxed in order to strategise and understand where course corrections are
required. Similarly, understanding potential seasonal forcing of COVID-19 will require a
good understanding of the effects of different NPIs so they can be factored out.

The increasing availability of wide-bandwidth mobile networks, smartphones, and
wearable sensors makes it possible to collect near-real-time high-resolution datasets from
large numbers of participants and greatly facilitates remote monitoring of behavior [12–
14]. By leveraging sensor modalities in smartphones which includes Network/Global
Positioning System (GPS) location tracking, and Fitbit devices which includes step counts
and heart rate, it is possible to access mobility and even wellness for the population. To
manage the data collected from multiple sensor modalities and mobile devices, platforms
such as the open-source RADAR-base (radar-base.org) mobile health platform have been
developed [15]. This platform has been used to enable remote monitoring in a range of use
cases including central nervous system diseases (Major Depressive Disorder (MDD),
epilepsy and Multiple Sclerosis (MS)) as part of the IMI2 RADAR-CNS major programme
(radar-cns.org) [16].

In this paper, we explored the utility of the RADAR-base platform as a toolbox to test the
effect and response of NPIs aimed at limiting the spread of infectious diseases such as
COVID-19 by leveraging participant data already collected from November 2017 onwards
as part of the ongoing RADAR-CNS studies [15–17]. Specifically, we created measures of
mobility (as a proxy of physical distancing), phone usage (as a proxy of virtual sociality),
and functional measures (heart rate and sleep), and compared these features among the
baseline, pre- and during-lockdown periods. Furthermore, we also provided a joint analysis
of these features to provide a holistic view of and interpret these behavioral changes during
COVID-19.

Methods
Data collection
The RADAR-CNS studies were approved by all local ethics committees, and all
participants signed informed consent [17]. We included 1062 participants recruited in five
European countries: Italy, Spain, Denmark, the UK, and the Netherlands. The data have
been collected for the purpose of finding new ways of monitoring MDD (Spain (150), the
Netherlands (103) and the UK (316)) and MS (Milan, Italy (208); Barcelona, Spain (179);
and Copenhagen, Denmark (106)) using wearable devices and smartphone technology to
improve patients’ Quality of Life (QoL), and potentially to change the treatment of these
and other chronic disorders. As we focused on country-level behavioural changes in
response to the NPIs, we aggregated data collected in Spain and did not focus on analysing
differences between participants with MDD and MS. Passive participant data, that is data
that did not require conscious participant engagement, were collected continuously on a
24/7 basis through a smartphone and a Fitbit device, which included location, Bluetooth,
activity, sleep, heart rate and phone usage data. In this study, we used participants' own
Android smartphones where available and provided a participant with a Motorola G5, G6,
or G7 if participants had an iPhone or did not have a smartphone. For Fitbit devices, Fitbit
Charge 2 devices were given to participants and then Fitbit Charge 3 devices were given
to the recently recruited participants when Fitbit Charge 2 devices were no longer available.
We asked participants to wear the device on their non-dominant hand. Although not used
for this study, active data were also collected, which required clinicians or participants to
fill out emailed surveys (e.g. Inventory of Depressive Symptomatology (Self-Report)),
app-delivered questionnaires (e.g. Patient Health Questionnaire), or perform short clinical
tests (e.g. Expanded Disability Status Scale).

The data collection and management were handled by the open-source mHealth platform
RADAR-Base [15]. The platform provides high scalability, interoperability, flexibility and
reliability while allowing the freedom for anyone to deploy. Due to the streaming first
nature of the platform, it is also easy to aggregate, analyse, and provide insights into the
data in real-time, hence making the results of this work potentially deployable for localised
monitoring and targeted interventions.

Feature extraction
To study physical-behavioural changes in response to COVID-19 NPIs, we examined
participants’ mobility by analysing relative location and Bluetooth data from smartphones
and step count data from Fitbit devices. We investigated phone unlock duration and social
app use duration to study online social-behavioural changes. Functional measures such as
sleep and heart rate from Fitbit devices were also analysed to identify possible changes as
a result of lockdown. A full list of features is presented in Table 1. These features were
extracted for each participant every day. The daily features were calculated using the data
from 6 am on the day to 6 am on the next day for all features except total sleep duration
and bedtime, where 8 pm was used as the starting time point and 11 am the finishing. When
no data were found in a data modality for a participant on a day due to the participant not
wearing the Fitbit device or not using the smartphone, we did not calculate the feature
derived from that data modality on that day.

Table 1. A full list of extracted features
 Category     Modality         Features            Extraction
 Mobility     Smartphone Homestay                  The time spent within 200m radius of
              location                             home location (determined using
                                                   DBSCAN)
                              Maximum travelled    The maximum distance travelled
                              distance from home   from home location

            Smartphone        Maximum number       The maximum number of Bluetooth-
            Bluetooth         of nearby devices    enabled nearby devices
            Fitbit step       Step count           Daily total of Fitbit step count
            count
 Functional Fitbit sleep      Sleep duration       Daily total duration of sleep
 measures                                          categories (light, deep, and rem)
                              Bedtime              The first sleep category at night
               Fitbit heart   Average heart rate   The daily average heart rate
               rate
 Phone         Smartphone Unlock duration          The total duration of phone in the
 usage         user                                unlocked state
               interaction
               Smartphone Social app use           The total duration spent on social
               usage event duration                apps (Google Play categories of
                                                   Social, Communication, and Dating)

The smartphone-derived location data were sampled once every five minutes by default,
with longer sampling durations dependent on network connectivity. Spurious location
coordinates were identified and removed if they differed from preceding and following
coordinates by more than five degrees. Home location was determined daily by clustering
location data between 8 pm and 4 am with the mean coordinate of the cluster that the last
coordinate belonged to being used. This choice was made because the largest cluster may
not be the home location for a single night but the last location before phones shut down
had a higher probability to be home location for that night. The clustering was implemented
using Density-Based Spatial Clustering of Applications with Noise (DBSCAN) [18]. A
duration gated by two adjacent coordinates was regarded as a valid homestay duration on
the condition that both coordinates were no further than 200 meters from the home location.
A duration longer than one hour was excluded due to the large proportion of missing data
when compared to the five-minute sampling duration. All valid home stay durations
between 8 am and 11 pm were summed to calculate daily homestay. Daily maximum
distance from home was also computed based on the coordinates in the same period.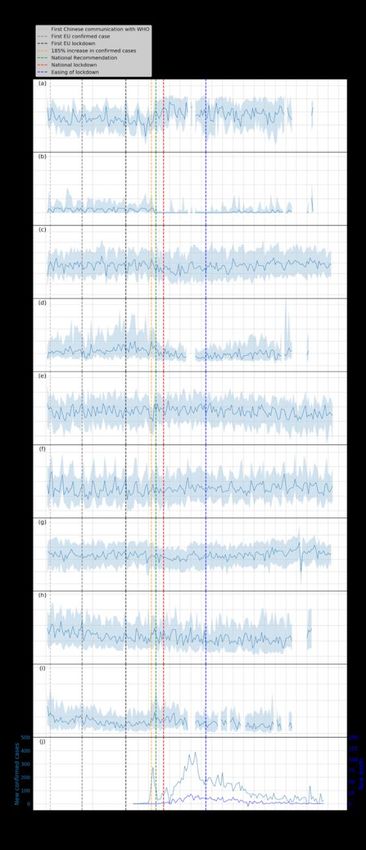
Bluetooth data, including the number of nearby and paired devices, were also collected
from smartphones, which were sampled every hour. The daily maximum number of nearby
devices was used as a mobility feature. An increased number of nearby devices (typically
other phones) detected may indicate more other users’ presence in the vicinity, which
therefore can serve as a proxy of physical distancing.

In addition to mobility features extracted from smartphones, daily step count was taken
from the Fitbit device, which was computed as the total steps a participant walked every
day. Likewise, daily sleep duration was computed as the summation of three Fitbit-output
sleep categories (light, deep, and rem) sampled every 30 seconds for the time interval from
8 pm to 11 am the next day. Bedtime was defined as the time of the first sleep category
reported by Fitbit after 8 pm. Note that the sleep categories referred to the sleep stages
provided by Fitbit API [19], which are not equivalent to the medical sleep stages. Finally,
daily mean heart rate was calculated daily by averaging the Fitbit-output heart rate
readings, sampled every five seconds at best. This sampling interval may be longer
depending on Fitbit proprietary algorithms for quality scoring and network connectivity.

To explore changes in phone usage, daily unlock duration was calculated by summing time
periods starting with the unlocked state and ending with the standby state. Single intervals
longer than four hours were excluded, which might result from a missing standby state or
unintentionally leaving the phone unlocked. App usage was quantified by classifying apps
according to categories listed on Google Play [20]. As we were particularly interested in
cyber social interactions, we focused on the daily use time of social apps, including the
Google Play categories of Social, Communication, and Dating. Among them are Facebook,
Instagram, and WhatsApp.

Data analysis
We plotted how the features evolved over 1.5 years for each country investigated. The
participants’ daily median, 25th percentile, and 75th percentile of each feature were
calculated and then plotted. A minimum of 20 participants’ data points was a prerequisite
for calculation for any given day to reduce variance and noise. To facilitate interpretation,
we also marked time points of public announcements related to lockdown policies [21].

To examine changes in mobility, functional measures, and phone usage induced by the
lockdowns, comparisons among baseline, pre-, and during-lockdown on the daily median
of each feature were carried out using Kruskal-Wallis tests followed by post-hoc Dunn’s
tests [22,23]. For the during-lockdown phase, we chose the entire period of the respective
national lockdown in each country, which ended when NPIs were eased for the first time.
For the pre-lockdown phase, we chose the period immediately prior to the first restrictive
measure with the same length of the entire respective national lockdown. For the baseline
phase, we chose the same period in 2019 as the 2020 national lockdown for countries
starting to collect data earlier than 2019, which included Italy, Spain, and the UK. This was
aimed at suppressing seasonal variability. For Denmark and the Netherlands where
participant recruitment and data collection started much later, we chose the period that
started with the earliest stable date (no considerate missing data or outliers) with the same
length of the entire respective national lockdown. If a significant difference among these
three periods was found after Benjamini–Yekutieli correction for the number of features
(9), post-hoc Dunn’s test was applied with Benjamini–Yekutieli correction for the number
of groups (3) [24]. Boxplots were used to present the results. A P < .05, after Benjamini–
Yekutieli corrections, was deemed statistically significant. It should be noted that we
applied corrections resulting from multiple comparisons and multiple features in each
country.

We also studied factors that might influence the sub-population behavioural features during
the lockdown period. The investigated factors included age, gender, body mass index
(BMI), and educational background. For age groups, we defined the young group below
45 years’ old and the elderly group otherwise. For BMI groups, the low BMI group was
defined as below 25 and the high BMI group otherwise. For education groups, we defined
the degree group as having a bachelor’s degree or above and non-degree group with lower
qualifications. Furthermore, we defined a combined factor group young men, as this
subpopulation was suspected to be less compliant with social distancing measures. Here
we focused on features of homestay and daily step count during the entire period of
lockdown for each country. We performed Wilcoxon signed-rank tests on these two
features to examine statistically significant differences. The P were corrected with the
number of factors (5) and the number of features (2) using Benjamini–Yekutieli correction.

Finally, we investigated the effects of different NPIs, in particular immediately after
respective national lockdowns. This was done by comparing the NPIs implemented in the
five countries within the first two weeks after entering national lockdowns.

Results
Plots showing how the extracted features evolved from 1 February 2019 to 5 July 2020 and
boxplots of these features are shown in Figure 1-5 and in Figure 6 (a-i), respectively.
Detailed test statistics and P values comparing pre- and during-lockdown measures are
presented in Table 2. Figure 7 shows a zoomed-in version of Figure 3 and 4.

Through RADAR-base, we quantified changes in mobility, phone use, and functional
measures as a result of NPIs introduced to control COVID-19. As expected, following
respective national lockdowns, participants in all countries stayed at home for longer,
travelled shorter distances, walked less, and made connections with fewer Bluetooth-
enabled nearby devices.

In contrast to increased physical distancing (reduced sociability) suggested by these
mobility features, higher phone usage suggesting compensatory sociability was observed.
Italy, Spain, and the UK saw longer unlock duration, and these three countries together
with the Netherlands also showed longer social app use duration. Tellingly, both unlock
duration and social app use duration saw peaks around the news of national lockdowns in
all countries.

Concurrent with the changes in mobility and phone usage, changes in functional measures
were observed. Participants in Spain, Italy, and the UK went to bed later and slept more.
Participants in Spain, Italy, and Denmark also had a decrease in heart rate. Although not
statistically significant, an increase in sleep duration and bedtime in Denmark and the
Netherlands and a decrease in heart rate in the UK and Netherlands can be seen in Figure
3 to Figure 5.

The differences across countries existed in the implemented NPIs as well. The requirement
of staying at home except for essential trips and the cancellation of public events were
implemented in all countries but Denmark where they were only recommended. Working
places were required to close for some sectors in Spain, the UK, and Denmark, and were
required to close for all but essential works in the Netherlands and Italy. Public transport
was recommended to close in Italy, Spain, and Denmark. Among all countries, Spain had
the least strict restrictions on gatherings and school closures (only geographically targeted).

We observed that the young group spent more time at home in Italy, Spain, and the UK,
and degree holders in Italy and Denmark. The young group took fewer daily steps in Italy,
the UK, and the Netherlands; the low BMI group in Italy, Spain, Denmark, and the UK;
and the young men group in Italy, the UK, and the Netherlands. Participants educated to
degree level walked more in the UK and the Netherlands, but less in Italy. The detailed
results are presented in Table 3.

Table 2. Results of Posthoc Dunn’s test (after Kruskal-Wallis tests) on the extracted
features between pre- and during-lockdown periods (only statistically significant
differences were reported)
  Features       Tests         Italy        Spain       Denmark         UK         Netherlan
                                                                                      ds

 homestay        z-test        -9.38        -8.98         -5.44        -9.19         -7.33
               statistics
                P-value
nearby P-value
P-value
P-value
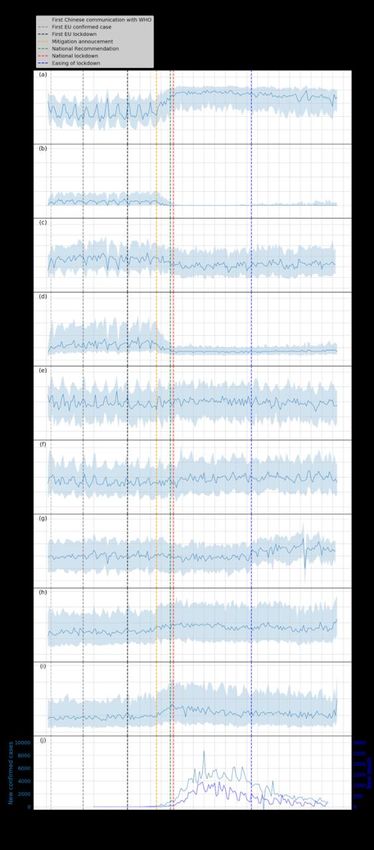
restrictions of working places and public transports but less strict on homestay and public
events [21]. In contrast, Spain was more flexible on restrictions of group gatherings and
school closures. The contrast in the implementation of different NPIs between the two
countries showing distinct behaviours during lockdown shed light on which NPIs might be
more productive in promoting physical distancing. This shows the potential utility of
RADAR-base for remotely monitoring the effect of different NPIs and we also saw
evidence of this in our data with participants beginning to return to pre-lockdown routines
as NPIs being lifted. Future work will compare these differences within a country and
across countries, which may further elaborate on the effect and impact of NPIs on infection
rates and potential second wave.

It is interesting to note that the younger group in general stayed at home more and took
fewer steps than the older group. Since most countries required staying at home except for
essential trips, one reason could be that the elderly, often less experienced in using online
shopping, had to go out for groceries. This conjecture requires future work to investigate.
Those educated to degree level stayed at home for significantly longer in Italy and
Denmark, possibly reflecting higher employment in sectors better able to work from home.
The low BMI group took more steps but retained similar homestay to the high BMI group,
which suggested they may have found other means to exercise locally. This information
helps us understand the effectiveness of the NPIs at a subpopulation level and may be
useful in informed strategies for targeted NPIs.

The ability to simultaneously manage multiple data modalities in RADAR-base facilitates
the joint analysis and interpretation of them together with NPIs. The decrease in heart rate
may be explained by the concurrent reduction in steps, the increase in homestay and total
sleep duration. The reduction in mobility, coupled with an increase in phone usage, could
possibly serve as indicators of physical distancing observance and resultant compensated
social interaction. The delayed bedtime might be related to children homeschooling as a
result of school closure, increased phone usage, and a lack of exercise. As such, RADAR-
base can also be applied to monitor the population health when jointly interpreting features
such as step count, sleep duration, and bedtime, which is vital if the social distancing is
implemented for a longer duration.

Finally, it has been shown that an elevated resting heart rate may suggest acute respiratory
infections [28]. It may be possible to infer one’s infection by continuously monitoring heart
rate, especially when the population remains indoor for a vast majority of the time. Such
monitoring provides the possibility to generate early warning signals for symptomatic or
presymptomatic respiratory infections, thereby aiding timely self-isolation or treatment.
The COVID-19 related symptom and diagnosis questionnaires have been added to the
study and may provide a means to investigate these relationships further.

Media Effects
In addition to changes in trends over longer periods, we also identified interesting findings
in relation to specific events (see Figure 7). A dramatic reduction in total sleep duration
was observed in Denmark around 11 March 2020 which may be related to the
announcement of the pending lockdown on that day and a 185% increase in the confirmed
cases in Denmark on the previous day. Another example can be seen just after the
mitigation phase was announced in the UK on 12 March, in which social distancing was
not strongly recommended, yet we saw a trend towards participants isolating themselves
voluntarily by staying at home for much longer. These observations highlight the potential
role of media and social media in the distribution of information that may precipitate
certain behaviour. This observation may also explain the significant difference between the
baseline and pre-lockdown phases and suggests that people may have acted ahead of further
government restriction. Furthermore, this is accompanied by a marked loss of
weekday/weekend periodic structure pre/during the lockdown period.

Limitations
There are some issues to consider concerning this work. First, the participants included in
this study have different medical conditions (MDD or MS), which led to different baseline
levels across countries. Nevertheless, as the focus of this study is the changes in the pre-,
and during-lockdown phases relative to the baseline, we were still able to identify and
compare the changes induced by lockdowns. We also analysed the data collected in Spain
split into MDD and MS separately. The trends and the statistical differences in all features
remained the same except for total sleep duration. The sleep data from the MDD study in
Spain had significant missing data, which did not meet the analysis prerequisite of 20
participants’ data. Understanding of any artefacts or effects introduced into the RADAR-
CNS data by the NPIs will be crucial in RADAR-CNS being able to deliver its aim of
identifying signals that predict and prevent MDD and MS. Although the medical conditions
of the population in this study might not be fully generalisable to a wider population healthy
or with other conditions, we were able to demonstrate the utility of RADAR-base in
monitoring behavioural changes, which can be readily generalised to other cohorts.

Second, the individual disease status at baseline may be different from that of the during-
lockdown period in each country, which might complicate the comparisons. To mitigate
this, we used the same time period from the previous year to suppress the seasonal
variability. We believe this complication on the population-level was unlikely to be large,
especially compared to the impact of lockdowns.

Third, participants recruited at different times may use different devices for smartphones
and Fitbit depending on the availability and enrollment dates, which might make it difficult
for inter-participant comparisons. Yet, this work focused on the population-level
behavioural changes induced by NPIs where the handset variability was less of a factor.

Fourth, on account of requirements for participants’ privacy in the RADAR-CNS studies,
location data were purposely obfuscated with a participant-specific random value
preventing precise localisation of the participants, which limited use of regional geographic
factors within a country. It would be interesting to examine how specific regions react to
lockdowns when these data are available in future work.

Fifth, limited sample sizes in certain countries and data loss impacted the smoothness of
the plots showing how the extracted features evolved over time. The plots for Denmark
and the Netherlands showed relatively large variance particularly in the early phase as these
sites have only recently begun recruiting. Several dips and spikes in step counts and heart
rate were seen in all countries during July and August. This observation was due to having
data loss due to connectivity issues with the Fitbit server during this time.

Last but not least, we only explored a subset of features that can be derived from
smartphones and Fitbit wearable devices. Future work will investigate whether other
features offer additional information for a more complete description of lifestyle changes.

Conclusions
Using participants’ data from smartphones and wearable devices collected and managed
by RADAR-base over 1.5 years covering the outbreak and subsequent spread of the
COVID-19 pandemic across five European countries, we were able to detect and monitor
the physical-behavioural and social-behavioural changes in response to the NPIs. We found
that as well as expected findings (that validated the data collection platform) relating to
increased time spent at home, less travel, and fewer nearby Bluetooth-enabled devices,
participants were more active on their phone, in particular, interacting with others using
social apps, particularly around major news events suggesting physical rather than social
distancing. Furthermore, we found that participants had lower heart rates, slept more, and
went to bed later. We demonstrated different responses across countries with Denmark
showing attenuated responses to NPIs compared to other countries, which may be
associated with their different focus of implementation NPIs. We found that the young
stayed at home for longer yet walked less compared to the elderly and that the people with
lower BMI remained more active during lockdown while having comparable homestay
compared to their counterparts with higher BMI. Joint analysis of the extracted features is
important for evaluating aspects of NPIs performance during their introduction and any
subsequent relaxation of these measures. This work demonstrates the value of RADAR-
base for collecting data from wearables and mobile technologies in order to understand the
effect and response of public health interventions implemented in response to infectious
outbreaks such as COVID-19. This ability to monitor response to interventions, in near real
time, will be particularly important in understanding behaviour as social distancing
measures are relaxed as part of any COVID-19 exit strategy. Future work will include
utilising participants responses to COVID-19 related questionnaires, together with an
expanded feature set to gain more specific understandings into the relationship between
mobile devices derived features and the COVID-19 symptoms.
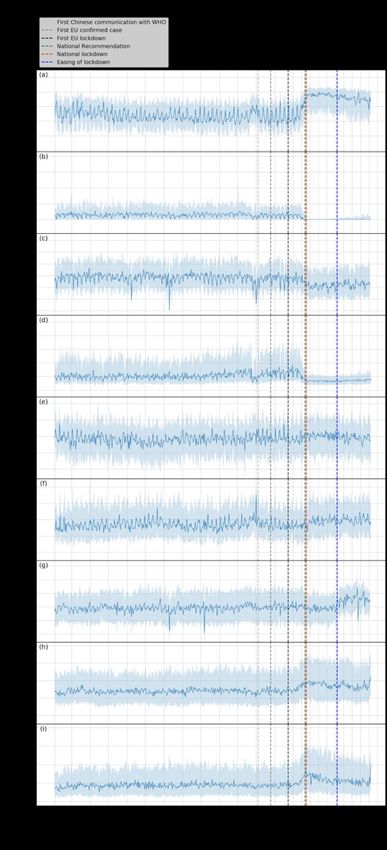
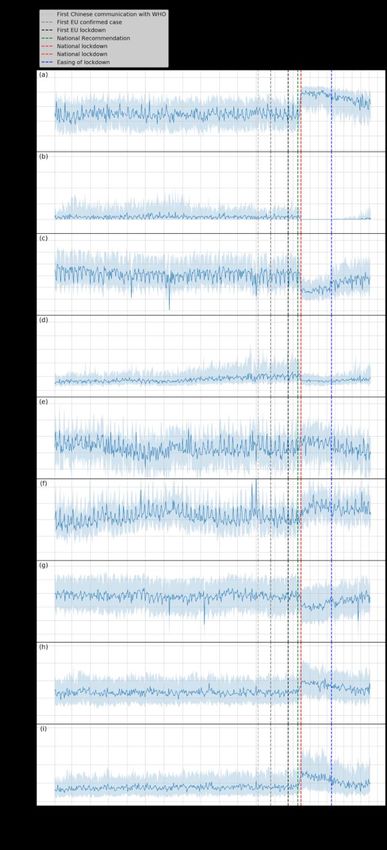
Figure 1. Behavioural changes for Milan, Italy (208 participants). (a): homestay duration,
(b): maximum distance from home, (c): Fitbit step count, (d): maximum number of nearby
devices, (e): total sleep duration, (f): bedtime, (g): heart rate, (h): unlock duration, (i): social
app duration. Solid line: median, shade: 25th percentile to 75th percentile
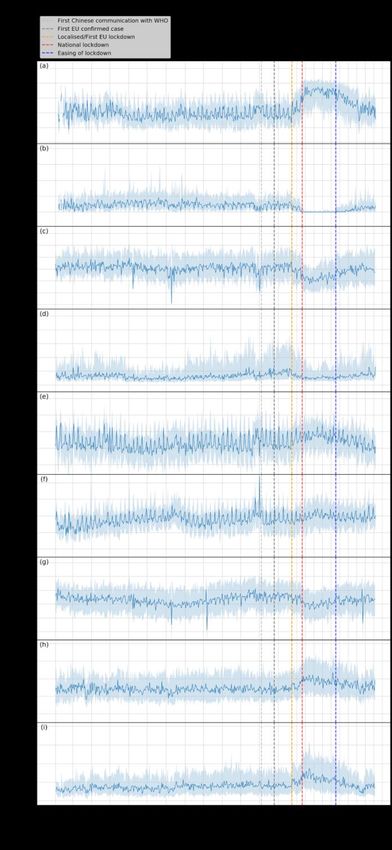
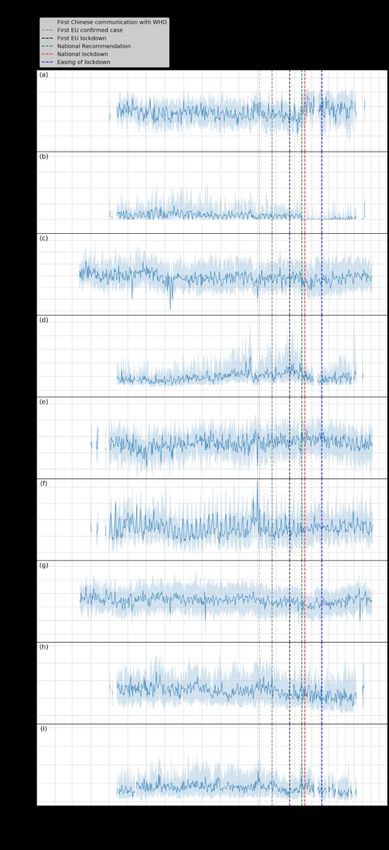
Figure 2. Behavioural changes for Spain (329 participants). (a): homestay duration, (b):
maximum distance from home, (c): Fitbit step count, (d): maximum number of nearby
devices. (e): total sleep duration, (f): bedtime, (g): heart rate, (h): unlock duration, (i): social
app duration. Solid line: median, shade: 25th percentile to 75th percentile
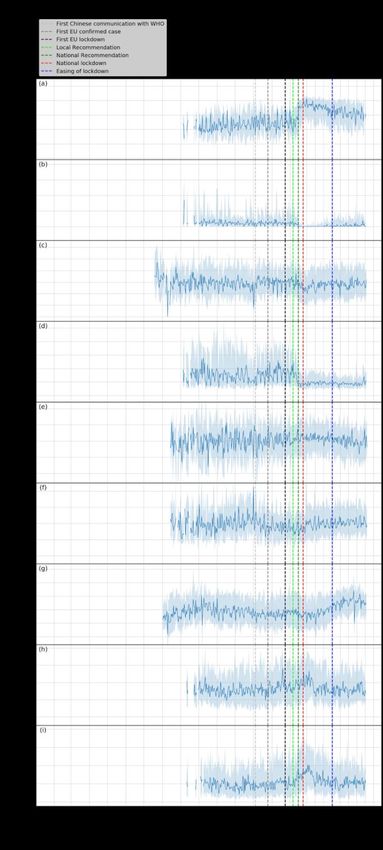
Figure 3. Behavioural changes for Copenhagen, Denmark (106 participants). (a):
homestay duration, (b): maximum distance from home, (c): Fitbit step count, (d): maximum
number of nearby devices. (e): total sleep duration, (f): bedtime, (g): heart rate, (h): unlock
duration, (i): social app duration. Solid line: median, shade: 25th percentile to 75th
percentile
Figure 4. Behavioural changes for London, the United Kingdom (316 participants). (a):
homestay duration, (b): maximum distance from home, (c): Fitbit step count, (d): maximum
number of nearby devices. (e): total sleep duration, (f): bedtime, (g): heart rate, (h): unlock
duration, (i): social app duration. Solid line: median, shade: 25th percentile to 75th
percentile
Figure 5. Behavioural changes for Amsterdam, the Netherlands (103 participants). (a):
homestay duration, (b): maximum distance from home, (c): Fitbit step count, (d): maximum
number of nearby devices. (e): total sleep duration, (f): bedtime, (g): heart rate, (h): unlock
duration, (i): social app duration. Solid line: median, shade: 25th percentile to 75th
percentile
(a)     (b)

  (c)   (d)

 (e)    (f)
(g)                                            (h)

                     (i)

Figure 6. Boxplots for comparisons among baseline, pre- and during-lockdown phases for
different features. * means p < 0.05, ** means p < 0.01, ** means p < 0.001. (a): homestay
duration, (b): maximum distance from home, (c): Fitbit step count, (d): maximum number
of nearby devices. (e): total sleep duration, (f): bedtime, (g): heart rate, (h): unlock duration,
(i): social app duration.
Figure 7. Zoomed-in plots for Copenhagen, Denmark and the UK. (a): homestay duration, (b): maximum distance from home, (c): Fitbit step count, (d): maximum number of nearby devices. (e): total sleep duration, (f): bedtime, (g): heart rate, (h): unlock duration, (i): social app duration. (j): COVID-19 confirmed and death cases. Solid line: median, shade: 25th percentile to 75th percentile Acknowledgements This study was supported by National Institute for Health Research (NIHR) Biomedical Research Centre at South London and Maudsley NHS Foundation Trust, King’s College London, and EU/EFPIA IMI Joint Undertaking 2 (RADAR-CNS grant No 115902). This communication reflects the views of the RADAR-CNS consortium, and neither IMI nor
the European Union and EFPIA are liable for any use that may be made of the information
contained herein. Participant recruitment in Amsterdam, the Netherlands was partially
accomplished through Hersenonderzoek.nl, the Dutch online registry that facilitates
participant recruitment for neuroscience studies (www.hersenonderzoek.nl).
Hersenonderzoek.nl is funded by ZonMw-Memorabel (project no. 73305095003), a project
in the context of the Dutch Deltaplan Dementie, Gieskes-Strijbis Foundation, the
Alzheimer’s Society in the Netherlands (Alzheimer Nederland) and Brain Foundation
Netherlands (Hersenstichting). This study has also received support from Health Data
Research UK (funded by the UK Medical Research Council), Engineering and Physical
Sciences Research Council, Economic and Social Research Council, Department of Health
and Social Care (England), Chief Scientist Office of the Scottish Government Health and
Social Care Directorates, Health and Social Care Research and Development Division
(Welsh Government), Public Health Agency (Northern Ireland), British Heart Foundation
and Wellcome Trust, and The National Institute for Health Research University College
London Hospitals Biomedical Research Centre.

Authors’ Contributions
SS, AAF, and RJBD contributed to the study design. SS contributed to the data analysis,
Figures drawing, and manuscript writing. AAF, NC, TW, VAN, GC, MH and RJBD
contributed to the critical revision of the manuscript. AAF, YR, ZR, PC, CS, and RJBD
contributed to the platform design and implementation. AAF, IMG, AR, TW, VAN, GC,
MH, and RJBD contributed to the administrative, technical and clinical support of the
study. FM, GDC, SS, LL, ALG, AZ, BWJHP, FL, SS, JMH contributed to data collection.

Conflicts of Interest
VAN is an employee of Janssen Research & Development LLC and may own equity in the
company.

Abbreviations
NPIs: Non-Pharmaceutical Interventions
WHO: World Health Organisation
GPS: Global Positioning System
MDD: Major Depressive Disorder
MS: Multiple Sclerosis
QoL: Quality of Life

References
1       Bai Y, Yao L, Wei T, Tian F, Jin DY, Chen L, et al. Presumed Asymptomatic
Carrier Transmission of COVID-19. JAMA 2020;323(4):1406–7. [doi:
10.1001/jama.2020.2565]
2       Xu Z, Shi L, Wang Y, Zhang J, Huang L, Zhang C, et al. Pathological findings of
COVID-19 associated with acute respiratory distress syndrome. Lancet Respir Med
2020;8(4):420–2. [doi: 10.1016/S2213-2600(20)30076-X]
3       Liu Y, Gayle AA, Wilder-Smith A, Rocklöv J. The reproductive number of
COVID-19 is higher compared to SARS coronavirus. J Travel Med. 2020; published
online Feb 13. [doi: 10.1093/jtm/taaa021]
4       WHO Coronavirus Disease (COVID-19) Dashboard https://covid19.who.int/
(accessed July 1, 2020)
5       Huang C, Wang Y, Li X, Ren L, Zhao J, Hu Y, et al. Clinical features of patients
infected with 2019 novel coronavirus in Wuhan, China. Lancet 2020;395(10223):497–
506. [doi: 10.1016/S0140-6736(20)30183-5]
6       Chan JFW, Yuan S, Kok KH, To KKW, Chu H, Yang J, et al. A familial cluster
of pneumonia associated with the 2019 novel coronavirus indicating person-to-person
transmission: a study of a family cluster. Lancet 2020;395(10223):514–23. [doi:
10.1093/infdis/jiaa077]
7       Guan W-J, Ni Z-Y, Hu Y, Liang W-H, Ou C-Q, He J-X, et al. Clinical
Characteristics of Coronavirus Disease 2019 in China. N Engl J Med 2020; published
online Feb 28. [doi:10.1056/NEJMoa2002032]
8       Wu Z, McGoogan JM. Characteristics of and Important Lessons From the
Coronavirus Disease 2019 (COVID-19) Outbreak in China. JAMA 2020; 323(13):1239–
42. [doi: 10.1001/jama.2020.2648]
9       Lau H, Khosrawipour V, Kocbach P, Mikolajczyk A, Schubert J, Bania J, et al.
The positive impact of lockdown in Wuhan on containing the COVID-19 outbreak in
China. J Travel Med 2020; published online 17 March 2020. [doi: 10.1093/jtm/taaa037]
10      Lazzerini M, Putoto G. COVID-19 in Italy: momentous decisions and many
uncertainties. Lancet Glob Heal 2020; published online March 18. [doi: 10.1016/S2214-
109X(20)30110-8]
11       World economic outlook update
https://www.imf.org/~/media/Files/Publications/WEO/2020/Update/June/English/WEOE
NG202006.ashx?la=en (accessed July 18, 2020)
12      Pandian PS, Mohanavelu K, Safeer KP, Kotresh TM, Shakunthala DT, Gopal P,
et al. Smart Vest: Wearable multi-parameter remote physiological monitoring system.
Med Eng Phys 2008;30(4):466–77. [doi: 10.1016/j.medengphy.2007.05.014]
13      Cancela J, Pastorino M, Tzallas AT, Tsipouras MG, Rigas G, Arredondo MT, et
al. Wearability assessment of a wearable system for Parkinson’s disease remote
monitoring based on a body area network of sensors. Sensors (Basel) 2014;14(9):17235–
55. [doi: 10.3390/s140917235]
14      Paradiso R, Alonso A, Cianflone D, Milsis A, Vavouras T, Malliopoulos C.
Remote health monitoring with wearable non-invasive mobile system: The HealthWear
project. In: Conf Proc IEEE Eng Med Biol Soc; 2008 Aug 20-25 p. 1699–702;
Vancouver, BC, Canada
15      Ranjan Y, Rashid Z, Stewart C, Conde P, Begale M, Verbeeck D, et al. RADAR-
base: Open source mobile health platform for collecting, monitoring, and analyzing data
using sensors, wearables, and mobile devices. JMIR Mhealth Uhealth 2019; 7(8):e11734.
[doi: 10.2196/11734]
16      Stewart CL, Rashid Z, Ranjan Y, Sun S, Dobson RJB, Folarin AA. RADAR-base:
Major depressive disorder and epilepsy case studies. In: UbiComp/ISWC; 2018 Oct 8-10
p. 1735–43; Singapore, Singapore
17      Matcham F, Barattieri di San Pietro C, Bulgari V, de Girolamo G, Dobson R,
Eriksson H, et al. Remote assessment of disease and relapse in major depressive disorder
(RADAR-MDD): a multi-centre prospective cohort study protocol. BMC Psychiatry
2019;19(1):72 [doi: 10.1186/s12888-019-2049-z]
18      Ester M, Kriegel H-P, Sander J, Xu X. A Density-Based Algorithm for
Discovering Clusters in Large Spatial Databases with Noise. In: Proc 2nd Int Conf
Knowledge Discovery and Data Mining (KDD’96); 1996 Aug 2-4 p.226–31; Portland,
Oregon, USA
19      Fitbit sleep API
https://dev.fitbit.com/build/reference/web-api/sleep/ (accessed July 18, 2020)
20      Google play category
https://play.google.com/store/apps/category/COMMUNICATION?hl=en_GB (accessed
July 18, 2020)
21      Hale T, Webster S, Petherick A, Phillips T, Kira K. Oxford COVID-19
Government Response Tracker, Blavatnik School of Government. Data use policy:
Creative Commons Attribution CC BY standard 2020.
https://www.bsg.ox.ac.uk/research/research-projects/coronavirus-government-response-
tracker (accessed April 16, 2020)
22      Ostertagová E, Ostertag O, Kováč J. Methodology and application of the Kruskal-
Wallis Test. Appl Mech Mater 2014;611:115–20.
23      Dinno A. Nonparametric pairwise multiple comparisons in independent groups
using Dunn’s Test. Stata J 2015;15(1):292–300. [doi: 10.1177/1536867X1501500117]
24      Benjamini Y, Yekutieli D. The control of the false discovery rate in multiple
testing under dependency. Ann Stat. 2001;29(4):1165–88.
25      Mobile phone users worldwide
https://www.statista.com/statistics/274774/forecast-of-mobile-phone-users-worldwide/
(accessed July 18, 2020)
26      Wearable devices worldwide
        https://www.statista.com/statistics/490231/wearable-devices-worldwide-by-
region/ (accessed July 18, 2020)
27      Google community mobility reports https://www.google.com/covid19/mobility/
(accessed July 18, 2020)
28      Radin JM, Wineinger NE, Topol EJ, Steinhubl SR. Harnessing wearable device
data to improve state-level real-time surveillance of influenza-like illness in the USA: a
population-based study. Lancet Digit Heal 2020;2(2):e85–93. [doi: 10.1016/S2589-
7500(19)30222-5]
You can also read