A Computational Framework for Search, Discovery, and Trending of Patient Health in Radiology Reports
←
→
Page content transcription
If your browser does not render page correctly, please read the page content below
A Computational Framework for Search, Discovery, and Trending of Patient
                           Health in Radiology Reports
                      Robert M. Patton, Carlos C. Rojas, Barbara G. Beckerman, Thomas E. Potok
                                       Computational Sciences and Engineering Division
                                                 Oak Ridge National Laboratory
                                                      Oak Ridge, TN, USA
                                      {pattonrm, rojascc, beckermanbg, potokte}@ornl.gov

Abstract— The healthcare industry as a whole lags far behind other industries in terms of knowledge discovery capabilities. There
are many piece-wise approaches to analysis of patient records. Unfortunately, there are few approaches that enable a completely
automated approach that supports not just search, but also discovery and prediction of patient health. The work
presented here describes a computational framework that provides near complete automation of the discovery and
trending of patient characteristics.   This approach has been successfully applied to the domain of mammography, but
could be applied to other domains of radiology with minimal effort.

   Keywords-information retrieval; genetic algorithm; wavelets;
radiology

                     I.    INTRODUCTION
    The transition from original digital patient data to an infrastructure for patient health knowledge discovery proves to be
a challenging process. Different data formats (e.g., images vs. text), variation in the level of structure (e.g., a database vs.
plain files), or data quality (e.g., transcription errors) can complicate the creation of a useful data repository. In
particular, the process of anonymizing patient data can inadvertently remove the connections that keep together different
portions of the data.
   Despite these challenges, the systematic collection and
use of health-related data has been a growing trend in recent years, promoted by actors from the government [6], private
companies [7], and the medical and research communities [5]. In particular, large data warehouses are considered a
necessary step towards patient-centric and evidence-based public health. That is, the importance of collecting and
maintaining health related data goes beyond data management issues; it creates the opportunity for large-scale data
analysis, e.g., [8].
    Providers are only just beginning to recognize the value of data mining as a tool to analyze patient care and clinical
outcomes [35]. Other work is being done in the medical environment to use automated software tools to extract
knowledge from unstructured radiology reports [4][36]. Preliminary findings demonstrate that automated tools can be used
to validate clinically important findings and recommendations for subsequent action from unstructured

radiology reports. Commercially available software is also being tested to automate a method for the categorization of
narrative text radiology reports, in this case dealing with the spine and extremities [4].
    A remaining challenge is the lack of a complete framework for ingesting raw data and providing a full
analysis of the patient’s health. Individual pieces of data may be analyzed separately, however, there is a need to have an
understanding of the patient’s characteristics and how they may change over time in relation to their health. For example,
metabolic syndrome is a group of risk factors that occur together and help identify if a patient is at higher risk for type-2
diabetes. These risk factors must be monitored over time and must be monitored as a group, not individually.
Another challenge is the ability to analyze groups of patients, and understand how individual patients differ from the group
characteristics. Finally, much of the data pertaining to patients is in the form of human language. This poses significant
challenges in that each area of medicine may have its own language (i.e., a set of words and phrases that are unique to that
domain). To address this, many approaches will develop custom ontologies or parsers to capture the uniqueness of the
language. This can be quite a time consuming process as well as limit the flexibility of the approach to other domains.
    These challenges necessitate a computational framework
that can support search, discovery, and trending of patient characteristics in order to rapidly transition from data
collection to an understanding of a patient’s health trajectory (e.g., the patient’s health is good but is declining, or the
patient’s health is bad but is improving). This work presents initial research into the development and application of such a
framework as applied to the domain of mammography and the corresponding radiology reports. The future goal is to
supplement this work with additional image and numeric processing techniques to further enhance the computational
framework as well as apply it to other domains.
    The following sections will provide a brief background, and a description of the search, discovery, and trending
capabilities of the framework.

                     II.   BACKGROUND
    The following sections provide background information to several areas that are key components of the proposed
framework as well as the domain in which it is applied.
A. Mammography Data
Mammography is the procedure of using low-dose X- rays to examine the human breast for the purposes of
identifying breast cancer or other abnormalities. Each patient that undergoes a mammogram has at least one X-ray image
and one textual report written by a radiologist. In the report, the radiologist describes the features or structures that they see or do
not see in the image. Essentially, this report is meta-data that is written by a human subject matter expert about the image.
Unfortunately, little work has been done to utilize and maximize the knowledge potential that exists in these reports.
This work uses unstructured mammography reports
consisting of 12,809 patients studied over a 5-year period. There are approximately 61,000 reports in this set. Each report
generally consists of two sections. The first section describes what features the radiologist does or does not see in the image.
The second section provides the radiologist’s formal opinion as to whether or not there are suspicious features that may
suggest malignancy (i.e., or the possibility that the patient has cancer). The set of reports also includes a number of reports that
simply state that the patient canceled their appointment.
As discussed in [12] using a subset of this data, these reports vary in length. Some radiologists use more words than
others when describing the same features. For example, in patients that do not exhibit any suspicious features, there are some
reports that very simply state that there are no suspicious features. However, for the same patient in a different year, a
different radiologist will provide a much more lengthy report that describes all of the suspicious features that did not
exist.
To provide a better perspective of the challenge of mining these reports, consider the following question. Given a
database of these reports, how does one retrieve those reports that represent abnormalities in the patient? In
mammography, most patient reports will represent “normal” conditions in the patient. Consequently, the reports with
“abnormal” conditions are rare (defining the difference between what is “normal” and “abnormal” is beyond the scope
of this paper). As discussed in [12], abnormal reports tend to have a richer vocabulary than normal reports. In addition,
normal reports tend to have a higher number of “negation” phrases. These are phrases that begin with the word “no” such
as in the phrase “no findings suggestive of malignancy.” Performing a cluster of these reports, most of the normal reports
would cluster together while the abnormal reports would not form a cluster. This is because “abnormal” conditions
tend to be very unique and very specific to a patient while “normal” conditions are much more generic and broad as
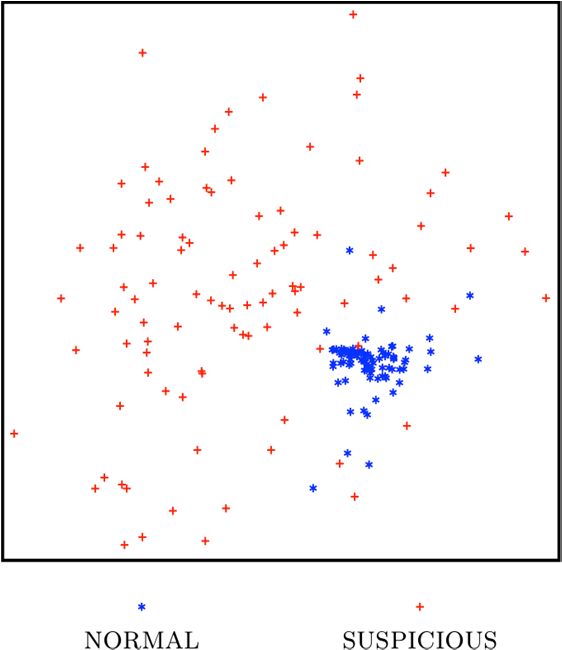
shown in Fig. 1. Even if clustering provided value, clustering a very large database of these reports is exceptionally
computationally expensive. Categorizing would be faster, however, the challenge
remains of determining the appropriate categories, and even then, the abnormal reports may not categorize correctly.
B. Skip Grams
To accommodate the language used in mammography and to help adapt the computational framework to other
domains, this work leverages the use of skip bigrams (s- grams). S-grams are word pairs in their respective sentence order
that allow for arbitrary gaps between the words [13]. A possible s-gram for the phrase “no significant radiographic features of
malignancy” are the words “no” and “malignancy.” This s-gram uniquely identifies a particular semantic in the
language of mammography reports and enables the identification of all possible variations of such phrases. Higher-level
patterns may then be formed from these s-grams. As will be described, s-grams can be grouped together to represent normal
and abnormal conditions.
The use of s-grams enables the computational framework
to sufficiently characterize the reports such that information retrieval becomes both more accurate, simplistic, and robust to
noise in the language while, at the same time, not being computationally intensive.
C. Vector Space Model & Term Weighting
In order to process the raw text of the radiology reports, each report is converted into a collection of terms and
associated weights using the vector space model method. The vector space model (VSM) is a recognized approach to
document content representation [3] in which the text in a document is characterized as a collection (vector) of unique
terms/phrases and their corresponding normalized significance.Figure 1 Text features from radiology reports mapped to a 2- dimensional space using multi-dimensional scaling.
Developing a VSM is a multi-step process. The first step in the VSM process is to create a list of unique terms and
phrases. This involves parsing the text and analyzing each term/phrase individually for uniqueness. The weight
associated with each unique term/phrase is the degree of significance that the term or phrase has, relative to the other
terms/phrases. For example, if the term “plan” is common across all or most documents, it will have a low significance, or
weight value. Conversely, if “strategic” is a fairly unique term across the set of documents, it will have a higher weight value.
The VSM for any document is the combination of the unique term/phrase and its associated weight as defined by a term
weighting scheme.
In our approach, the term frequency-inverse corpus frequency (TF-ICF) is used as the term weighting scheme [2].
Over the last three decades, numerous term weighting schemes have been proposed and compared
[15][16][17][18][20][21]. The primary advantage of using TF-ICF is the ability to process documents in O(N) time
rather than O(N2) like many term weighting schemes, while also maintaining a high level of accuracy. For convenience,
the TF-ICF equation is provided here:
N +1
III. SEARCH
Faceted search complements keyword search by incorporating a fixed set of non-exclusive conceptual
dimensions to the data, called facets [9]. Facets may have only a few values (e.g., brands, price ranges) and every
document may have one or more values in some of the facets. Thus, faceted search provides a middle ground
between the full openness of the keyword search and the rigidity of a hierarchy. For example, article databases usually
provide faceted search: one can search by author, title, or full content.
In order to effectively access the knowledge contained within 61,000 written reports, the Solr search platform was used,
which is an open-source search platform that implements faceted search [14]. It provides flexible mechanisms
to preprocess and index complex documents containing free text, dates, numerical data, and categorical at- tributes. Solr
supports, among others, sorting, search by fields, proximity search, and wildcard search. It runs as a web server, and thus
both indexing and searching are done using HTTP calls. Search results can be returned in XML format, which facilitates
automated analysis. The definition of fields, their data types, whether they should be treated as facets, their lexical analysis at
indexing and query time can
wij = log(1 + fij ) ! log(
)
n j +1
(1)be defined via a XML schema.
Solr enables this computational framework to leverage a machine–readable search engine that can be tailored as
In this equation, fij represents the frequency of occurrence of a term j in document i. The variable N represents the total
number of documents in the static corpus of documents, and nj represents the number of documents in which term j
occurs in that static corpus. For a given frequency fij, the weight, wij, increases as the value of n decreases, and vice
versa. Terms with a very high weight will have a high frequency fij, and a low value of n.
For this work, the entire corpus of approximately 61,000
radiology reports was used for the ICF table, however this
can be altered according to the application. In the ICF table, we store N, which is the total number of documents in the
corpus. Also, for each unique term j, after removing the stop words and applying Porter’s Stemming Algorithm [19], we store
nj, which is the number documents in the corpus where term j occurred one or more times. As a result, the task of generating
a weighted document vector for a document in a dynamic data stream is as simple as one table lookup. The computational
complexity of processing N documents is therefore, O(N).
Once a vector representation is created for each
document, similarity comparisons can be made. In our approach, a cosine similarity is used to compare two vectors A
and B, as shown in (2).
Similarity = (A . B) / (||A|| ||B||) (2)
Similarity values ranges between 0 and 1, inclusive. A value of 1 means that vectors A and B are identical; while a
value of 0 means that they are not alike at all.
appropriate to the data. At a minimum, the reports can simply be added to the search platform. However, with
minimal effort, additional tailoring can be performed to enhance the capabilities. This section describes the
additional metadata that was used for each report.
The individual report was set as the document unit for indexing. Table 1 shows the data features that were mapped to
fields, their source, and whether they were treated as facets. A multivalued Tag field was created to incorporate
annotations. These annotations consist of: redundant report file names, i.e., reports with the same content; whether the report
had a mammogram assigned; whether the report was labeled as normal or suspicious.
Feature/Field Faceted
Exam Col 3 Exam entry
Exam Col 4 Exam entry
Exam Exam entry
Exam Description Exam entry
Exam Insurance Info Exam entry
Exam Index Exam entry
Exam Exam entry
Key [Report File name]
Mammogram Date Mammogram
Mammogram File name Mammogram
Patient Report/Exam list
Metadata
SGram Count Metadata
Metadata
Raw
Exam entry + Report
TABLE I. FEATURES INCLUDED IN THE INDEX
Finally, the multivalued SGram field contains the list of s-grams that were found in the report, and the field
SGramCount stores how many of them were found. To actually determine the reports that have a particular s-gram, two-
phase indexing is used. The first phase indexed the reports without s-gram information. In the second phase, this index was
queried with each of the available s-grams using a proximity query. The reports that matched the query were then updated with
this information. When all s-grams were queried, a new index was created with the report information updated.
For most of the text, Solr tokenizers and analyzers were used with the default options, i.e., create tokens by splitting on
spaces and case changes and ignore stop words. Because of the value of the negations, we did not treat ‘no’ and ‘not’ as stop
words. With the exception of the RawText field, we also used Porter’s Stemming Algorithm [19]. More information on
the search and indexing of this approach is provided in [10].
A. Faceted Search for Automated Analytics
Solr’s machine-readable query results facilitate reading and analyzing them in an automated fashion. We describe two
usage modes of this functionality, with examples.One usage mode is the retrieval of large numbers of results as one step in a data analysis process. For example, we
queried for all labeled reports, obtained their s-grams, computed a measure of distance among them, and projected those
distances to a 2-dimensional space. Each patient’s report was represented in the vector space model (VSM). The measure
of distance was based on the cosine similarity. The 2-dimensional projected space was obtained using multidimensional
scaling. Fig. 1 shows the results of this transformation. Reports labeled as normal (blue stars) appear very close (i.e.,
similar) to each other, while reports labeled as suspicious (red crosses) appear dissimilar to the normal ones and among
themselves. This is consistent with the fact that most normal reports tend to be shorter with many negation phrases, hence
sharing large commonalities, while suspicious reports are longer and have a more specific vocabulary.
Another distinct automated usage is a succession of queries, the specific parameters of each being dependent on the
preceding. These can be seen as small-scale versions of APIs and programming utilities for certain specialized search engines,
such as Entrez [11]. For example, to find mammograms that seemed to have triggered a subsequent biopsy, we
first searched for exams whose description contains the word “Biopsy”, collected the patient identifiers and the dates, and
searched again for reports from the same patients within one month of the biopsy reports.
IV. DISCOVERY
Once the search platform is established, it is then used to find “interesting” patients in order to discover characteristics that
are both shared between and unique to patients. The problem lies in defining what “interesting” means. It is easy and
possibly tempting to focus on a particular known characteristic. However, this can lead to the oversight of
another possibly more important characteristic that is unknown or not obvious. Thus, the discovery process must
facilitate the examination of all possible characteristics.
For this computational framework, the maximum variation sampling technique was used to identify
“interesting” patients without the need for explicitly defining what “interesting” means. Sampling can be divided into two main
categories: probability-based and nonprobability- based. Probability-based sampling is based on probability theory and
the random selection of data points from the dataset. Nonprobability-based sampling is based on purposeful
selection, rather than random selection. The advantage of this form of sampling is that it allows the analyst to look at
data that may not otherwise be visible via the random selection process. Within nonprobability-based sampling, there are
several categories of sampling [1], one of which is maximum variation sampling (MVS) [1]. This particular sampling
method seeks to identify a particular sample of data that will represent the diverse data points in a data set. According to
[1], “This strategy for purposeful sampling aims at capturing and describing the central themes or principle outcomes that cut
across a great deal of [data] variation.” In a large text corpus, this form of sampling provides the ability to quickly
characterize the different topics, or “threads” of information that are available.
When applied to patient records, this approach will identify a sample of patients that are as different from each other
as possible. This enables the identification of mammography specific language that is shared across patient reports as
well as language that makes each patient unique in the sample. In addition, it enables the discovery of language that defines the
boundary between normal and abnormal circumstances.
The maximum variation sampling technique is naturally
implemented as a genetic algorithm (GA), which is a search algorithm based on principles from natural selection and genetic
reproduction [25][23]. GAs have been successfully applied to a wide range of applications, including optimization,
scheduling, and design problems [22][24][26]. Key features that distinguish GAs from other search methods include:
• A population of individuals where each individual represents a potential solution to the problem to be solved.
• A fitness function that evaluates the utility of each individual as a solution.
• A selection function that selects individuals for reproduction based on their fitness.
• Idealized genetic operators that alter selected individuals to create new individuals for further testing.
These operators, e.g. crossover and mutation, attempt to explore the search space without completely losing
information (partial solutions) that is already found.
First the population is initialized, either randomly or with user-defined individuals. The GA then iterates thru an
evaluate-select-reproduce cycle until either a user defined stopping condition is satisfied or the maximum number of
allowed generations is exceeded.
The use of a population allows the GA to perform N N
parallel searches into multiple regions of the solution space. Operators such as crossover allow the GA to combine
discovered partial solutions into more complete solutions [25][23][27]. As a result, the GA is expected to search for small
building blocks in parallel, and then iteratively recombine small building blocks to form larger and larger
F (i) = ! ! ! j + "k + Sim (Gij , Gik )
j= 0 k= j+1
$ || j || '
#
(3)& )
building blocks. In the process, the GA attempts to maintain a balance between exploration for new information and
exploitation of existing information. Over time, the GA is able to evolve populations containing more fit individuals or
"j =e
% 100 (
$ || k || '
(4)
better solutions.
#
%100 (
Genetic algorithms perform very well for large search spaces and are easily scalable to the size of the data set. To
& )
"k = e
(5)
better understand the need for scalability and the size of the search space in this problem domain, consider a set of 10,000
radiology reports. Now, suppose an analyst needs to reduce this data set to 200 representative reports (only 2% of the entire
data set). In that case, there are approximately 1.7 x
10424 different combinations of reports that could be used to create a single sample. Clearly, a brute force approach is
unacceptable. In addition, many of the combinations would consist of duplicate data that would lower the quality of the result for
the analysts.
Two of the most critical components of implementing a
GA are the encoding of the problem domain into the GA population and the fitness function to be used for evaluating
individuals in the population. To encode the data for this particular problem domain, each individual in the population
represents one sample of size N. Each individual consists of N genes where each gene represents one radiology report (each
report is given a unique numeric identifier) in the sample. For example, if the sample size were 10, each individual
would represent one possible sample and consist of 10 genes that represent 10 different reports. This representation is
shown in the following figure.
Figure 2 GA individual representation
The fitness function evaluates each individual according to some predefined set of constraints or goals. In this particular
application, the goal for the fitness function was to achieve a sample that represents the maximum variation of the data set
without applying clustering techniques or without prior knowledge of the population categories. To measure the variation
(or diversity) of our samples, the summation of the similarity between the vector-space models of each document (or gene) in
the sample is calculated as shown in the following equation.
In (3), the Sim function calculates the cosine similarity between the vector space models of gene j and k of the
individual i. This distance value ranges between 0 and 1 with 1 indicating that the two reports are identical and 0
indicating that they are completely different in terms of the words used in that report. Therefore, in order to find a sample
with the maximum variation (3) must be minimized (i.e., lower fitness values are better).
The penalty functions are incorporated into the fitness
function in order to penalize individuals in the population based on the length of the documents they represent. Shorter
documents receive higher penalties while longer documents receive much lower penalties. The penalty functions also return
values that are between 0 and 1, inclusive. As a result of the penalty functions, the cancellation reports will receive the highest
fitness values, while lengthy, abnormal reports will receive the lowest fitness values.
Using this GA implementation, samples of patients can then be extracted. As samples are being evaluated during the GA
execution, s-grams from all the reports represented by each individual are identified and counted. S-grams belonging to
individuals that are selected for reproduction are kept separate from those who are not selected. As a result of the fitnessfunction, individuals that are selected for reproduction tend to have reports that describe abnormalities while those that are not
selected tend to have reports that describe normal conditions. As the GA executes, it learns the most frequently used s-grams
that represent both normal and abnormal conditions. Examples of the most frequent s- grams from failed individuals (i.e., normal
reports) are “no & suspicious” and “no & masses.” Examples of the most frequent s-grams from successful individuals (i.e.,
abnormal reports) are “core & biopsy” and “needle & procedure.” A list of the most frequently used normal and abnormal s-
grams are provided in [33]. Consequently, this approach enables the discovery of the mammography domain language without
the need for the tedious task of developing a complex ontology as well as provides the ability to characterize each
patient’s conditions. This leads to the ability to analyze patient conditions over time.
V. TRENDING
After discovering s-grams that define normal and abnormal conditions, the next objective is to identify trends of the
patient’s health (e.g., the patient’s health is declining and an abnormality may occur in the future). To accomplish this objective,
each patient’s record is analyzed to count the number of s-gram occurrences pertaining to both normal and abnormal conditions
(as found during the discovery process) in each report of the record. Only those patients with more than 12 reports in their
record are used for this analysis, otherwise there is insufficient data.
The normal and abnormal s-gram counts from each report form a temporal sequence for each patient record. Next,
patients are analyzed and compared based on these sequences. Specifically, we want to find patient records where an
abnormality s-gram occurred prior to many abnormality s-grams occur. An example of this is shown in Fig. 3. In this
patient record, a single abnormality-related s- gram occurs in May 1984 followed by many abnormality s- grams. To find
patients with similar patterns, a discrete wavelet transform (DWT) of the temporal sequence of abnormal s-gram counts
is used.
A wavelet transform is a mathematical function that is
used to split another function into separate scale components, thus providing a multi-resolution analysis. The wavelet
transform is analogous to a prism that breaks natural white light into its various spectral colors with each color
representing a different frequency. They are widely used in time-series analysis, as well as other domains such as image
processing. In this particular work, Haar DWT is used to identify temporal patterns in patient records
[28][29][30][31][32]. As patients are observed, the data are recorded in discrete time manner, thus making DWT the natural
choice for transforming the time sequence.
A critical feature of the DWT is that it will not only identify the frequencies that constitute a temporal sequence, but
also the location in time in which those frequencies occur. It is this feature of the DWT that is exploited here in this work,
as our objective is to find s-grams that occur prior to other s-grams. In addition, a DWT provides the ability to find similar
temporal patterns, allowing for the flexibility of matching patterns despite amplitude and time shifts. Previous work
has shown wavelets to be effective in performing similarity searches of time series [29]. However, the work described here
utilizes a rule-based approached to finding similar temporal patterns using DWT that does not rely on the use of thresholds.
This enables a wider range of temporal patterns to be found that contain the basic temporal characteristics of interest.
As described in [34], the rule-based approach checks for
changes in the slope of the waveform across multiple resolutions. The rules are broad, thus allowing for variations in
amplitude and time-shifts. Using this approach, many patient records with patterns similar to Fig. 3 can be found.
Fig. 3 shows the normal and abnormal s-gram counts of a patient record found by this approach where “nodular &
density” was a precursor s-gram. In one of the first reports for this patient record, the radiologist states, “There is
Figure 3 Example patient record
prominent nodular density posteriorly and inferiorly in both breasts on the mediolateral oblique views, left more than right.”
This patient is ultimately diagnosed with a simple cyst. In that report, the radiologist states “Ultrasound directed to the
inferocentral left breast 6 o'clock position demonstrates a 1-cm round, simple cyst.” The report also states that the nodular
density was not previously seen. It is suspected that the radiologist did not review reports in the beginning of the record.It should be noted that the precursor s-gram does not
necessarily provide specific information concerning the abnormality that is ultimately diagnosed. In this example, the
precursor s-gram is related, but it cannot be conclusively determined that it is, in fact, the exact same abnormality that is
ultimately diagnosed. However, what the precursor s- gram does provide is an early warning indication that the
radiologist noted some feature about the patient that seemed unusual, or was noteworthy. The approach described here seeks
to leverage that information, even if it does not ultimately relate to the final diagnosis.
Patient records that match this temporal pattern in the Haar DWT are then selected. For these selected patient
records, all s-grams were extracted from the first report in which the abnormal s-gram count was at least 1 but less than or
equal to the normal s-gram count. This represents a normal report where some potential abnormality was
mentioned. Next, the time elapsed was computed between this first report and the next report where the abnormal s- gram
count was higher than the normal s-gram count. This second report represents an abnormality that was detected and a
diagnostic screening was requested. Finally, the frequency of each extracted s-gram was computed across the selected
patient records along with the corresponding average elapsed time. The results of this analysis are shown in the following
tables.
TABLE II. TOP PRECUSOR S-GRAMS
Occurrences
Occurrences % Occurrence
S-gram in Selected
as Precursor as Precursor
Patients
lymph &
39 71 54.93
node
cm &
12 24 50.00
density
nodular &
51 104 49.04
density
TABLE III. AVERAGE ELAPSED TIME
Average Time Std Dev Skewness /
S-gram
Elapsed (years) (years) Kurtosis
lymph &
4.2 2.9 0.01 / -1.38
node
cm &
1.1 2.2 2.63 / 6.91
density
nodular &
2.9 2.9 0.68 / -0.64
density
TABLE IV. INCREASE IN OCCURRENCE
%
% Occurrence in Occurrence % Increase in
S-gram
All Patients in Selected Occurrence
Patients
lymph &
25.17 57.72 129.34
node
cm &
5.50 19.51 254.51
density
nodular &
31.39 84.55 169.35
density
The second s-gram (cm & density) provides a much more specific window than the other two with an average of just over
one year with a very high positive skewness and kurtosis values. The reason for this is that this s-gram represents
phrase patterns that are very specific about a particular feature that was observed in the patient. A feature significant enough
to be measured. An example phrase that this s-gram would represent is “2.5 cm area of asymmetric density”. Such specificity
by the radiologist suggests that the radiologist is very focused on this feature and is likely to be concerned enough to
request additional diagnostic screenings. Consequently, the average time elapsed for this s-gram is much shorter and has
less variability.
As can be seen in these tables, s-grams do exist that act
as precursors. In addition, these precursors also hold the potential of providing lead times measured in years. This is
potentially very significant, although additional work is needed to investigate this possibility.
VI. CONCLUSION & FUTURE W ORK
This computational framework provides the ability to rapidly transition from data collection to advance analysis of patient
health trajectory as seamlessly and automated as possible. Performing patient data analysis requires a well- defined
representation of the data and efficient mechanisms to search, select, and retrieve portions of the dataset. Once the patient
data has been properly organized and the right platform to satisfy the information needs is in place (both for
small scale uses and collection-wide analytics), the advantages are clear. In this computational framework,
exploratory analysis can be directly performed from the search platform (e.g., obtain age statistics via faceted search) aswell as automated information retrieval, filtering, and advanced data analysis in order to discover important patient
characteristics and trend information.
While this framework provides a significant tool to the medical professional, further enhancements can be made. Future
work will incorporate the use of image analysis to leverage features found in the corresponding image. The image and
text features can then be utilized in a semi- supervised approach [37] that relies on the graph Laplacian from spectral
graph theory [38]. Furthermore, future work will investigate the use of this framework in the domains of abdominal aortic
aneurysms and mild traumatic brain injury.
ACKNOWLEDGMENT
We thank Robert M. Nishikawa, Ph.D., Department of Radiology, University of Chicago, for providing the large dataset
of unstructured mammography reports.
Research sponsored by the Laboratory Directed Research and Development Program of Oak Ridge National
Laboratory, managed by UT-Battelle, LLC, for the U. S. Department of Energy. LDRD #5327.
Prepared by Oak Ridge National Laboratory, P.O. Box
2008, Oak Ridge, Tennessee 37831-6285; managed by UT-
Battelle, LLC, for the U.S. Department of Energy under contract DE-AC05-00OR2225. This manuscript has been
authored by UT-Battelle, LLC, under contract DE-AC05-
00OR22725 for the U.S. Department of Energy. The United
States Government retains and the publisher, by accepting the article for publication, acknowledges that the United States
Government retains non-exclusive, paid-up, irrevocable, worldwide license to publish or reproduce the published form
of this manuscript, or allow others to do so, for United States Government purposes.
REFERENCES
[1] M.Q. Patton, Qualitative Evaluation and Research Methods, Second
Edition. Newbury Park, CA: Sage Publications, Inc., 1990
[2] J.W. Reed, Y. Jiao, T.E. Potok, B.A. Klump, M.T. Elmore, and A.R.
Hurson, TF-ICF: A new term weighting scheme for clustering dynamic data streams, In Proc. of the 5th International Conference on Machine
Learning and Applications (ICMLA’06), pp.258-263, 2006.
[3] G. Salton, A. Wong, and C. S. Yang (1975), "A Vector Space Model for Automatic Indexing," Communications of the ACM, vol. 18, nr.
11, pages 613–620.
[4] Thomas, BJ; Ouellette, H; Halpern, EF; Rosenthal, DI. Automated
Computer-Assisted Categorization of Radiology Reports, AJR: 184,
687-690. February 2005.
[5] North Carolina Medical Journal. Special Issue on Data and Health
Policy, March/April 2008.
[6] C. Howell. Stimulus package contains $19 billion for health care technology spending and adoption of electronic health records.
Wisconsin Technology Network news, February 19 2009. (Retrieved April 29, 2010, at http://wistechnology.com/articles/5523/).
[7] S. Lohr. Tech companies push to digitize patients’ records. New York
Times, September 10 2009.
[8] G. Norn, J. Hopstadius, A. Bate, K. Star, and I. Edwards. Temporal pattern discovery in longitudinal electronic patient records. Data Mining
and Knowledge Discovery, 20:1–27, 2010.
[9] K.-P. Yee, K. Swearingen, K. Li, and M. Hearst. Faceted metadata for image search and browsing. In CHI ’03: Proceedings of the SIGCHI
conference on Human factors in computing systems, pages 401–408, New York, NY, USA, 2003. ACM.
[10] C. C. Rojas, R. M. Patton, and B. G. Beckerman. Characterizing mammography reports for health analytics. In Proceedings of the 1st ACM
International Health Informatics Symposium (IHI '10), Tiffany Veinot (Ed.). ACM, New York, NY, USA, 201-209.
[11] E. Sayers, and D. Wheeler, Building Customized Data Pipelines Using the Entrez Programming Utilities (eUtils), NIH Bookshelf ID:
NBK1058, Current February 2011, http://www.ncbi.nlm.nih.gov/books/NBK1058/
[12] R.M. Patton, B.G., Beckerman, and T.E. Potok, 2008. “Analysis of mammography reports using maximum variation sampling.”
Proceedings of the 4th GECCO Workshop on Medical Applications of Genetic and Evolutionary Computation (MedGEC), Atlanta, USA, July 2008.
ACM Press, New York, NY.
[13] A. Pirkola, H. Keskustalo, E. Leppänen, A. Känsälä, and K. Järvelin,
2002. "Targeted s-gram matching: a novel n-gram matching technique for cross- and monolingual word form variants." Information
Research, 7(2) [Available at http://InformationR.net/ir/7-
2/paper126.html]
[14] Solr, Current February 2011, http://lucene.apache.org/solr/
[15] Buckley, C., Singhal, A., and Mitra, M. New retrieval approaches using SMART. In Proc. of the 4th Text Retrieval conference (TREC-
4), Gaithersburg, 1996.
[16] Hung Chim, and Xiaotie Deng; , "Efficient Phrase-Based Document Similarity for Clustering," Knowledge and Data Engineering, IEEE
Transactions on , vol.20, no.9, pp.1217-1229, Sept. 2008
[17] Jones, K.S. and Willett, P. Readings in Information Retrieval, Chap.
3. Morgan Kaufmann Publishers, San Francisco, CA, 305-312, 1997.
[18] Man Lan; Sam-Yuan Sung; Hwee-Boon Low; Chew-Lim Tan; , "A comparative study on term weighting schemes for text
categorization," Neural Networks, 2005. IJCNN '05. Proceedings.
2005 IEEE International Joint Conference on , vol.1, no., pp. 546-
551 vol. 1, 31 July-4 Aug. 2005
[19] Porter, M.F. An algorithm for suffix stripping. Program, 14(3), 130-
137, 1980.[20] Salton, G. and Buckley, C. Term-weighting approaches in automatic text retrieval. Journal of Information Processing and management,
24(5): 513-523, 1988.
[21] Hongzhi Xu, and Chunping Li, "A Novel Term Weighting Scheme for Automated Text Categorization," Intelligent Systems Design and
Applications, 2007. ISDA 2007. Seventh International Conference on
, vol., no., pp.759-764, 20-24 Oct. 2007
[22] Chambers, L., Ed. (2000), The Practical Handbook of Genetic
Algorithms: Applications, Second Edition, Chapman & Hall / CRC.
[23] Goldberg, D. E., Genetic Algorithms in Search, Optimization, and
Machine Learning. Addison-Wesley, 1989.
[24] Haupt, R. L., and S. E. Haupt (1998), Practical Genetic Algorithms
John Wiley & Sons, Inc. New York, NY.
[25] Holland, J. H. (1975), Adaptation in Natural and Artificial Systems.
University of Michigan Press.
[26] Karr, C. L., and L. M. Freeman, Ed. (1999), Industrial Applications of
Genetic Algorithms, CRC Press, New York, NY.
[27] Mitchell, M. (1996), An Introduction to Genetic Algorithms, MIT Press.
[28] C.S. Burrus, R.A. Gopinath, and H. Guo, Introduction to Wavelets and Wavelet Transforms, A Primer. Prentice Hall, 1997.
[29] F.K.-P., Chan, A.W.-C. Fu, and C. Yu, “Haar wavelets for efficient similarity search of time-series: with and without time warping,” IEEE
Trans. On Knowledge and Data Engineering, Vol. 15, Iss 3, May-June 2003.
[30] T. Edwards, “Discrete Wavelet Transforms: Theory and
Implementation,” technical report, Stanford Univ., 1991.
[31] K. Grochenig, and W.R. Madych, “Multiresolution Analysis, Haar Bases, and Self-Similar Tilings of rn,” IEEE Trans. Information Theory,
vol. 38, no. 2, pp. 556-568, 1992.
[32] D.B., Percival, and A.T. Walden, Wavelet methods for time series analysis, Cambridge University Press, 2000.
[33] R.M. Patton, B.G. Beckerman, J.N. Treadwell, and T.E. Potok, 2009. “A Genetic Algorithm for Learning Significant Phrase Patterns in
Radiology Reports.” Proceedings of the 5th GECCO Workshop on Medical Applications of Genetic and Evolutionary Computation (MedGEC),
Montreal, Canada, July 2009. ACM Press, New York, NY.
[34] R. M. Patton, and T. E. Potok, “Discovering Potential Precursors of Mammography Abnormalities based on Textual Features,
Frequencies, and Sequences”, 10th International Conference on Artificial Intelligence and Soft Computing, June 2010.
[35] Fickenscher, K.M., The New Frontier of Data Mining, Health
Management Technology (26) 10:32-36, October 2005.
[36] Dreyer, K.J., Kalra, K.M., Maher, M.M., et al, Application of Recently Developed Computer Algorithm for Automatic
Classification of Unstructured Radiology Reports: Validation Study, Radiology 324, 2 (Feb. 2005), 323-329.
[37] Chapelle, O., B. Scholkopf, and A. Zien, eds. Semi-Supervised
Learning. 2006, MIT Press: Cambridge, MA.
[38] Chung, F.R.K., Spectral Graph Theory. 1997, Providence, RI: American Mathematical Society.You can also read