SympGraph: A Framework for Mining Clinical Notes through Symptom Relation Graphs
←
→
Page content transcription
If your browser does not render page correctly, please read the page content below
SympGraph: A Framework for Mining Clinical Notes
                through Symptom Relation Graphs

                        Parikshit Sondhi† , Jimeng Sun‡ , Hanghang Tong‡ , ChengXiang Zhai†
                                                               †
                                                                 Univ. of Illinois, Urbana, USA
                                                        ‡
                                                            IBM TJ Watson Research Center, USA
                             sondhi1@illinois.edu, jimeng@us.ibm.com, htong@us.ibm.com, czhai@illinois.edu

ABSTRACT                                                                                    and unstructured formats. For example, diagnosis information such
As an integral part of Electronic Health Records (EHRs), clinical                           as International Classification of Diseases - ICD9 codes1 , medica-
notes pose special challenges for analyzing EHRs due to their un-                           tion information such as generic drug names, and lab results are
structured nature. In this paper, we present a general mining frame-                        commonly stored in structured formats. Such structured EHR data
work SympGraph for modeling and analyzing symptom relation-                                 are readily usable for data mining applications. However, clini-
ships in clinical notes.                                                                    cal notes, arguably the most important part of the patient records,
   A SympGraph has symptoms as nodes and co-occurrence rela-                                are largely unstructured. Despite the standard practice based on
tions between symptoms as edges, and can be constructed automat-                            which physicians write the notes, such as SOAP notes(sec 2.1), by
ically through extracting symptoms over sequences of clinical notes                         and large the information in physician notes remains unstructured,
for a large number of patients. We present an important clinical ap-                        making it a significant challenge to extract and understand clinical
plication of SympGraph: symptom expansion, which can expand a                               concepts both within and across patients. The following example
given set of symptoms to other related symptoms by analyzing the                            illustrates some of the needs and specific challenges in mining clin-
underlying SympGraph structure. We further propose a matrix up-                             ical notes.
date algorithm which provides a significant computational saving                            Clinical motivating example: Congestive Heart failure (CHF), af-
for dynamic updates to the graph. Comprehensive evaluation on                               fecting 1 in 5 US adults, is the single most costly health problem
1 million longitudinal clinical notes over 13K patients shows that                          for Centers for Medicare & Medicaid Services (CMS). With an ag-
static symptom expansion can successfully expand a set of known                             ing population, the individual and societal burden is expected to
symptoms to a disease with high agreement rate with physician in-                           increase. CHF is a complex syndrome with multiple pathophysi-
put (average precision 0.46), a 31% improvement over baseline co-                           ological manifestations that frequently overlap with those of other
occurrence based methods. The experimental results also show that                           diseases, making early diagnosis challenging. Thus it is usually di-
the expanded symptoms can serve as useful features for improving                            agnosed in primary care, often as a late stage disease. In order to
AUC measure for disease diagnosis prediction, thus confirming the                           increase the chance of early diagnosis of CHF, it is important to
potential clinical value of our work.                                                       collect all directly and indirectly relevant symptoms from a patient,
                                                                                            and have a good understanding of the criteria for diagnosis. Unfor-
                                                                                            tunately, the only criteria currently available were published by the
Categories and Subject Descriptors                                                          Framingham investigators in 1971 based on clinical data acquired
H.3 [INFORMATION STORAGE AND RETRIEVAL]: Infor-                                             in the 1950 and 60s [11]. Fortunately, clinical notes are excellent
mation Search and Retrieval                                                                 sources from which we can potentially extract relevant symptoms
                                                                                            to diseases such as CHF.
Keywords                                                                                    Automatic identification of Framingham criteria can greatly en-
                                                                                            hance the understanding of their prevalence as well as incidence
symptom graphs, physician notes,random walk,patient records                                 in a patient population over time. Clinicians are also interested in
                                                                                            understanding in general how all signs and symptoms are related
1.     INTRODUCTION                                                                         to each other in order to possibly expand Framingham criteria to
   Electronic Health Records (EHRs) have become a standard prac-                            a broader set of symptoms that serve as robust signals for early
tice in modern healthcare delivery. Beyond storing patient records,                         detection of CHF. The need for extracting clinical signs and symp-
EHRs are an ever-growing data repository that enables clinical data                         toms from patient records and further analyzing them also exists
mining applications, especially comparative effectiveness research.                         for many other diseases.
Heterogeneous sets of EHR data are available in both structured                                In this paper, we study the following questions: How to cap-
                                                                                            ture the relations among different symptoms extracted from clinical
                                                                                            notes? How to expand a set of known symptoms to other relevant
                                                                                            symptoms? How to efficiently update such symptom expansion
Permission to make digital or hard copies of all or part of this work for                   when the underlying symptom relations change? To the best of
personal or classroom use is granted without fee provided that copies are                   our knowledge, no previous work has systematically studied these
not made or distributed for profit or commercial advantage and that copies                  questions.
bear this notice and the full citation on the first page. To copy otherwise, to                To this end, we present a general mining framework SympGraph,
republish, to post on servers or to redistribute to lists, requires prior specific
permission and/or a fee.
                                                                                            that turns patient encounter notes into a symptom graph to system-
KDD’12, August 12–16, 2012, Beijing, China.                                                 1
Copyright 2012 ACM 978-1-4503-1462-6 /12/08 ...$15.00.                                          http://icd9cm.chrisendres.com/

                                                                                     1167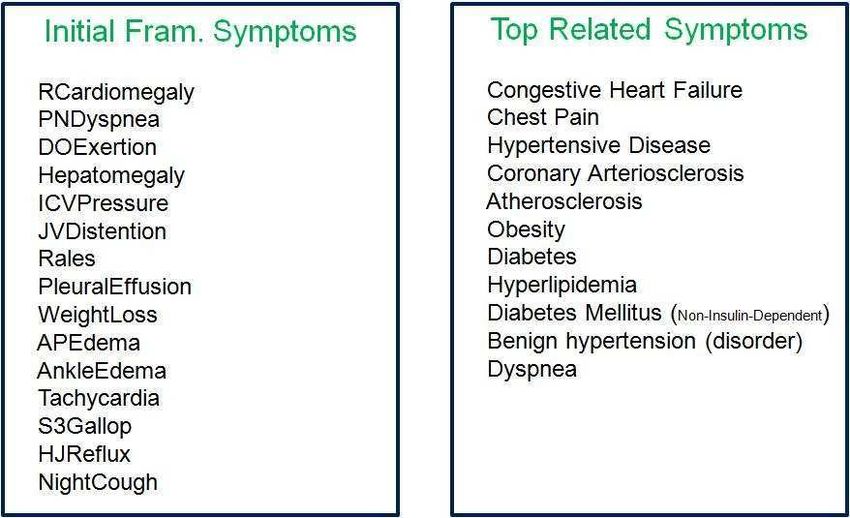
atically reveal all the symptoms and symptom relations buried in
the notes. A SympGraph is a graph with extracted symptoms as
vertices, and the associations of symptoms as edges. It provides
a general representation of symptoms and their relations and helps
support many different mining applications under a unified frame-
work. As an example of the applications enabled by a symptom
graph, we present an important clinical application: symptom ex-
pansion which expands a small initial set of known symptoms to
a bigger set of relevant symptoms. We present two different algo-
rithms for solving symptom expansion in different contexts. When
the underlying symptom graph is static, we propose static symptom
expansion, which adopts a random walk type of algorithm to rank
related symptoms based on their relevance to the initial set. When
the underlying symptom graph changes (e.g., due to addition of
new symptom relations or updating existing ones), we propose dy-
namic symptom expansion, which is based on a novel matrix update
method for low rank approximation of the symptom graph.
   We evaluate the proposed SympGraph framework on a large-
scale real world clinical database with 1 million clinical notes of             Figure 1: A sample clinical note, highlighting the four sections
over 13K patients over 7 years, and the experimental results are
quite promising. We show that SympGraph can successfully ex-
pand a known set of CHF related symptoms with a high agreement
rate compared to physician judgements (average precision 0.46),
providing a 31% improvement over baseline methods that do not
use SympGraph. We further demonstrate that the expanded symp-
toms can help achieve over 10% improvement of area under the
curve (AUC) measure for predicting the onset of CHF. In terms of
the scalability, we compare static and dynamic symptom expan-
sion methods, where interesting workload trade-off is revealed. In
general, dynamic symptom expansion is preferred when multiple
initial symptom sets are present and underlying relation changes
are small.

2.    BACKGROUND
2.1    Clinical Notes
   A clinical note contains unstructured details regarding a patient’s
encounter with a healthcare professional. The content of the note
varies depending upon the type of encounter, and there are many
different types of encounters. For example, a note for a Pharmacy               Figure 2: UIMA pipeline architecture for symptom extraction
Visit, contains information regarding medications and their side ef-
fects, while a Physician Visit contains complete details of patient
symptoms, medications, social history etc. Other example types                  the proposed SympGraph framework, we would use the extracted
of encounters are Laboratory Visit and Case Manager Visit. Of                   symptoms and their statistical relations to constract a graph, which
all these, the most important and abundant are the Physician Visit              can then support various analysis tasks, especially symptom expan-
notes. These are generally loosely organized into four SOAP sec-                sion, an application that we would study in detail in this paper.
tions: Subjective, Objective, Assessment and Plan. Each section                    Since improving the accuracy of symptom mention extraction is
contains a specific kind of information regarding the patient. A                not our focus, we mostly rely on existing techniques and extend
sample is shown in Figure 1.                                                    them systematically to extract symptom mentions. Specifically, we
Subjective: details of a patient’s condition in her own words. Also             use the Apache Unstructured Information Management Architec-
other details such as social history, family history, current medica-           ture (UIMA) toolkit(http://uima.apache.org/) to construct a Natural
tions etc.                                                                      Language Processing (NLP) pipeline for the task. The main idea
Objective: observable information such as findings from physical                behind a UIMA pipeline is to construct a series of annotators. Each
examination, test results, vital signs, age, height, weight etc.                annotator is a program that parses the document text and marks the
Assessment: a list of potential diagnoses.                                      start and end locations for a certain type of entity in the text. We
Plan: information on the subsequent steps of actions of the patient,            adopt the UIMA toolkit as it allows us to efficiently create and in-
such as a treatment plan.                                                       terconnect such annotators. Figure 2 shows the architecture of our
                                                                                UIMA pipeline.
2.2    Symptom Extraction                                                          Word, Sentence Annotator At the lowest level we start with
  Clearly, in order to analyze and mine symptom-related knowl-                  annotators, which identify the word, sentence and SOAP section
edge from clinical notes, we first need to go through a Symptom                 boundaries in the text. These annotations, along with the original
Extraction step, in which we process each encounter to identify the             text are then supplied to the subsequent levels.
symptom mentions present and filter out negated symptoms. In                       Symptom Annotator Symptom annotator annotates all symp-

                                                                         1168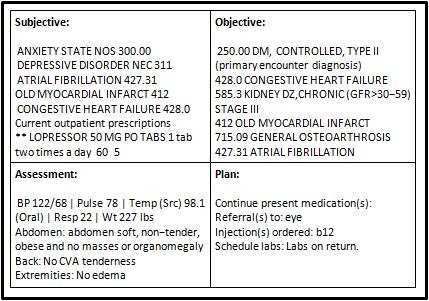
tom mentions present in the text. Symptoms are identified using
MetaMap (http://metamap.nlm.nih.gov/), a tool developed at the
National Library of Medicine, for mapping raw English text to stan-
dardized medical concepts in the Unified Medical Language Sys-
tem (UMLS) metathesaurus(http://www.nlm.nih.gov/research/umls/).
UMLS contains over a million medical and general English con-
cepts, which are further organized under a hierarchy of 134 seman-
tic types. Each concept is assigned one or more high level semantic
types. For example “dsyn” type, contains all concepts belonging to
the category of “Disease or Syndrome”.
   Since MetaMap returns all types of concepts present in the text,
we filter out the returned concepts based on their semantic types.
More specifically, we only keep concepts belonging to the follow-
ing semantic types as symptom concepts:                                              Figure 3: Overview of Multiple levels of SympGraphs
   { sosy, dsyn, neop, fngs, bact, virs, cgab, acab, lbtr, inpo, mobd,
comd, anab }
   Framingham Annotator The general Symptom Annotator de-                      event sequences of a patient into a compact graph representation
scribed above does not accurately identify all mentions of Framing-            named patient (symptom) graph. A patient graph captures symp-
ham Symptoms for heart failure in the text. Since our experiments              tom co-occurrence relations for a given patient. The distance be-
are focused on Congestive Heart Failure (CHF), we also built a                 tween patients can be defined based on the similarity of the un-
separate annotator, which identifies Framingham Symptoms more                  derlying symptom graphs. We can aggregate individual patients’
accurately in the text using a dictionary of symptom mentions and              symptom graphs into a population-level symptom graph.
simple heuristics. The symptom dictionary was built by manually                   A symptom graph G is represented as G = {V, E, w}, where
analyzing clinical records. We used the Framingham Annotator to                every node v ∈ V represents a symptom, the edge e = (v1 , v2 )
extract 15 out of 16 Framingham symptoms in total. One symptom                 represents the relationship between two symptoms v1 and v2 , and
- Weight loss ≥ 4.5 kg in 5 days in response to treatment, needed              weighting function w : e → R+ maps the edge e to a positive value
deeper text analysis and was not extracted.                                    w(e).
   Negation Annotator Presence of a symptom in a clinical note                    For a given patient p, such a symptom graph can be constructed,
does not necessarily imply an Assertion which is its presence in a             where nodes correspond to the symptoms extracted from p’s clin-
patient. The negation annotator looks at the surrounding text of               ical notes, and edges correspond to the relationship of symptoms
each symptom annotation and filters out symptom mentions found                 exhibited in p’s clinical notes.
in negated contexts based on simple heuristics such as presence
of negation related words like “denies”, “without”, and “no”. In               3.2     Graph Construction
principle, negative symptom findings can also indicate interesting                One simple way to construct the graph is to form edge (i, j) in
relationships. However for this work we will only focus on positive            G if symptoms i and j co-occurr in the same encounter note. Or
symptom occurrences.                                                           formally, given a sequence of clinical encounters ci of p over time
                                                                               (1 ≤ i ≤ Cp ), we can construct a symptom to encounter matrix
3.    SYMPGRAPH                                                                Np ∈ RS×Cp , where S is the total number of symptoms and Cp
                                                                               is the number of encounters for patient p, and the element in Np is
   From a medical application perspective, it is very important to             defined as
study clinical signs and symptoms in clinical notes, especially their                          (
relations both within a patient and across patients. Recognizing                          p       1 if symptom i is in encounter note j,
mentions of symptoms in the clinical notes is only the first step;                      Nij =
                                                                                                  0 otherwise.
after recognizing all the mentions of potential symptoms, we also
need to develop methods for further organization, abstraction, and             The i-th row vector Ni: of N corresponds to the patient p’s en-
analysis of the extracted symptoms. A major challenge here is                  counters that contain symptom i. The j-th column vector Np:j
how to support different applications in a general and efficient way.          corresponds to the symptoms extracted from the encounter note j.
To this end, we propose a general symptom mining framework                     With the encounter matrix Np , the symptom co-occurrence matrix
called SympGraph, which provides a general graph representation                G ∈ RS×S is
of symptoms and their relations extracted from the clinical notes.                                        X p
                                                                                                     G=        N · NpT .                    (1)
SympGraph can be regarded as an abstraction of clinical notes from
                                                                                                              p
the perspective of symptom analysis and mining in the sense that it
contains essential and sufficient information about symptoms and               The nonzero elements in G correspond to all the edges of the symp-
their relations required by many different mining applications.                tom graph G. Intuitively, the symptoms extracted from the same
   Below, we first present the overall process of building symptom             encounter note are connected to each other, and form a clique.
graphs for clinical notes and then present the algorithms for con-             All the cliques from different encounter notes of a patient can be
structing and aggregating them.                                                summed together to form the symptom matrix G. The weighting
                                                                               function w(i, j) is exactly the element Gij .
3.1    Overview                                                                   Beyond this simple construction, we also extend the formula-
   The construction of symptoms can be done in a multi-level fash-             tion to a location sensitive construction. The location sensitive idea
ion as shown in Figure 3. At the patient level, clinical notes of              arises out of the intuition that a physician will likely evaluate the
a patient can be modeled as event sequences. The events in this                presence of related symptoms in succession and they will likely
paper are mentions of the symptoms in the clinical notes during                appear closeby in the clinical notes. Thus if two symptoms are far
a specific time interval (e.g., a day). SympGraph summarizes the               away from each other in the encounter note, the edge weight be-

                                                                        1169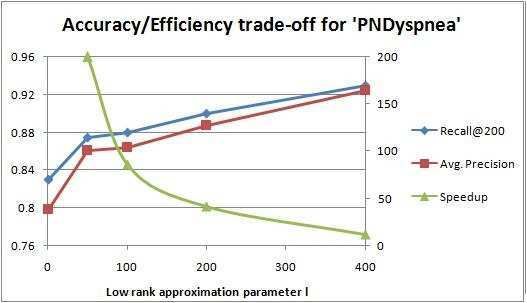
tween them should be small. If they are close, the weight should                   In addition to the immediately co-occurring symptoms, we also
be large. In this paper, we use the inverse of the distance as the              perform the expansion recursively through random walk with restart
weight. Such formulation can still be captured by generalizing the              [20]. Intuitively, random walk with restart (RWR) can be regarded
multiplication operator as u · vT =
                                       P
                                         1≤i≤Cp f (ui , vi ) where              as modeling a random particle that with probability c(0 < c < 1)
f (ui , vi ) = 1/d and d is the location offset in words between                traverses randomly along edges of G, and probability 1 − c jumps
symptom u and v in the encounter i.                                             back to one of the initial symptoms in ES. The recursion of ran-
Graph Normalization: In order to alleviate the problem where                    dom walk with restart is defined as
some symptoms are much more common than others, we further                                            r = cGr + (1 − c)e.                        (2)
normalize a symptom matrix G constructed using a method de-
                                                                                                                                               −1
scribed above through the following                                             The solution to the linear system eq-(2) is r = (1−c)(I −cG) e.
                                                                                Many effective algorithms exist to solve eq-(2) when the underly-
                            G̃ = GD−1                                           ing graph G is fixed. One simple and scalable method for solving
where D is a diagonal matrix with Dii =
                                                 P                              this linear system is to use the power method to iteratively apply
                                                   j Nij . The result-
                                                                                eq-2 with the initialization r = e (referred to as ‘Power-method’).
ing matrix G̃ will be Markovian, namely the column sums to 1.                   Another effective way to solve eq-(2) is to use a low-rank approx-
In this case, the popular symptoms will be penalized since the out-             imation, followed by a matrix inversion of size l × l (where l is
going edges from them will be normalized. Note that the normal-                 the rank of the low-rank approximation) to get all possible rele-
ization does not preserve symmetric property of the original matrix             vance scores. This solution [20], called NB_Lin, is summarized
G. There are other normalization methods that can preserve the                  in Alg. 1 for completeness, where it is divided into two stages:
symmetric property such as the normalized Laplacian normaliza-                  NB_LIN_Pre() and NB_LIN_OQ(). In NB_LIN_Pre() (steps
tion G̃ = D−1/2 GD−1/2 . In this paper, we pick the asymmetric                  1-3), a low-rank approximation is performed for the normalized
normalization because we believe the relations are not always sym-              adjacency matrix A and a matrix inversion Λ (referred to as ‘core
metric. For example, v is a common symptom with many neighbors                  matrix’) is computed. Next, in NB_LIN_OQ() (steps 4-5), only a
including u, but u is only connected to v. In this case, the impor-             small number of matrix-vector multiplications are computed to out-
tance of u to v (i.e., w(v, u)) is small, but the importance of v to u          put the ranking vector. Therefore, NB_Lin is much more efficient
(i.e., w(u, v)) is significant.                                                 for the query response, especially when we have multiple queries.
Aggregation: Finally, given a set of normalized symptom graphs                  (We can view the “seed symptoms” used for symptom expansion
G1 , G2 , . . . , GK , we can also easily combine them into an aggre-           as a “query” and the task of symptom expansion as to “retrieve”
gated symptom graph G by averaging the symptom matrices:                        additional related symptoms to the query.)
                                   1 X
                            G=            Gi .                                  Algorithm 1 NB_Lin (repeated from [20] for completeness)
                                   K i
                                                                                Input: The normalized adjacency matrix G, the query vector e
Since the symptom matrices Gi (1 ≤ i ≤ K) are already normal-                       and c.
ized, the simple averaging will preserve the Markovian property.                Output: The ranking vector for the source node r.
Aggregation provides a general and flexible way to analyze the data              1: Pre-Compute Stage (NB_LIN_Pre())
with different “resolutions”; this in combination with graph anal-               2: do low-rank approximation for G = UV
ysis algorithms naturally supports many different ways to analyze                3: pre-compute and store the core matrix Λ = (I − cVU)−1
and exploit symptoms and their relations in a variety of applica-                4: On-Line Query Stage (NB_LIN_OQ())
tions.                                                                           5: output r = (1 − c)(e + cUΛVe)

4.    STATIC SYMPTOM EXPANSION                                                     In terms of applications, symptom expansion can be used at dif-
   Given a symptom graph, one important clinical application is                 ferent levels of symptom graphs. At the patient level, users like
to automatically explore and expand an existing set of symptoms.                physicians, nurses or even patients themselves can expand the ex-
Such expansion is necessary to improve the diagnosis of diseases                isting set of symptoms from the current encounter to a more general
(one use case is described in Section 1 about extending Framing-                set of symptoms based on the symptom graph built on the patient
ham criteria for CHF diagnosis). To facilitate the discussion, we               history. Those additional symptoms can be used as personalized
define the following notations: Let ES be the set of the exist-                 query suggestions for diagnosis. One can also take the current
ing symptoms that one constructed (e.g., symptoms included in the               symptoms from a patient p and perform symptom expansion based
Framingham criteria). Let vector e ∈ RS be the indicator vector of              on the cluster symptom graph of p to immediately leverage patterns
the existing symptom set, where                                                 extracted from similar patients like p. Finally, at the population
                       (                                                        level, symptom expansion enables understanding of typical symp-
                         1 if symptom i ∈ ES,                                   toms to a disease. “Typical symptoms” as described in medical
                 ei =
                         0 otherwise.                                           books such as Framingham symptoms for CHF are just a small ini-
                                                                                tial set of symptoms for diagnosing a disease such as CHF. Starting
Let r ∈ RS be the relevance score vector of all symptoms with                   from an existing set of symptoms for a given disease, additional
respect to the existing set ES, which we hope to compute.                       sets of symptoms can be obtained based on the population-level
   Intuitively, to perform symptom expansion, we would be inter-                symptom graph using random walk with restart. The expansion set
ested in obtaining symptoms that co-occur frequently with the ex-               of symptoms can then be used as additional features for building
isting set of symptoms. Formally, such co-occurring symptoms can                predictive modeling for that disease, and also potentially enhance
be captured through r = Ge, where highly ranked values in r cor-                knowledge and understanding about the disease. We will present
respond to the most commonly co-occurring symptoms with ES.                     some initial clinical case studies in section 6 to show that the ex-
Mathematically, this can be achieved by a one-step random walk                  pansion set of symptoms discovered using our algorithm are indeed
from the existing set ES based on the symptom graph G.                          helpful for improving the prediction accuracy of the onset of CHF.

                                                                         1170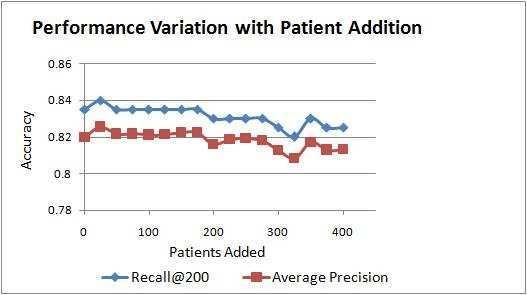
5.    DYNAMIC SYMPTOM EXPANSION                                                  Applying the block matrix inverse lemma [3] to eq-(3), we can
   In this section, we address the challenges in computing symptom             verify that the step 7 in Alg. 2 gives the exact Λ̂ matrix.
expansion when the underlying symptom graph is changing. We                      Then, for the updated ranking vector r, we have
first present our algorithm, and then analyze its accuracy as well as
                                                                                                r   =    (1 − c)(I − cA)−1 e
the efficiency.
                                                                                                    =    (1 − c)(I − cÛV̂)−1 e
5.1    Proposed Algorithm for Dynamic RWR                                                           =    (1 − c)(I + cÛΛ̂V̂)e
   When the underlying symptom graph G changes over time, the
results of symptom expansion would also have to be updated. In                                      =    (1 − c)(e + cÛΛ̂V̂e)                  (4)
the case of very frequent changes, which can happen, e.g., due to                 Notice that the second to the last step is due to the Sherman-
additions of many new patient records daily, updating all the results          Morrison lemma [15]. This completes the proof.                    2
can be computationally expensive. Specifically, let Ĝ indicate the               The efficiency of the proposed Alg. 2 is summarized in Lemma 5.2.
change of the symptom graph (i.e., Ĝ + G is the new normalized                It can be seen that it is much more efficient by (1) avoiding the re-
adjacency matrix). If we still want to apply NB_Lin to update the              computation of the low-rank approximation of the new normalized
corresponding ranking vectors straight-forwardly, we need to re-               adjacency matrix, which takes O(m) time; (2) avoiding directly
compute the low-rank approximation as well as the core matrix. In              updating the new core matrix, which takes O(k + l)3 .
other words, the computational cost in NB_Lin_Pre() now becomes
part of the on-line query cost in the dynamic case, which might be                L EMMA 5.2. Efficiency of Update-RWR. Let m̂ be the non-
too expensive.                                                                 zero elements in Ĝ, the time complexity of Alg. 2 is O(m̂ + nkl),
   Thus an interesting question is: how can we update the ranking              where k and l are the rank of X and U, respectively.
vector efficiently? To address this issue, we propose an efficient
algorithm to update the low rank approximation as well as the core             P ROOF. Step 2 takes O(m̂) time to get the low-rank approximation
matrix. Our key observation is as follows: for the application of              of the matrix Ĝ. Step 3 takes O(nk) time. Step 5 takes O(nk2 +
symptom graph, Ĝ itself can often be written or approximated by               nkl + k3 ) time. Step 6 takes O(nkl + l2 k) time. Step 7 takes
some low-rank approximation with a much lower rank size (say k,                O(l2 k) time. Finally, step 9 takes O(n(k + l) + (k + l)2 ) time.
then k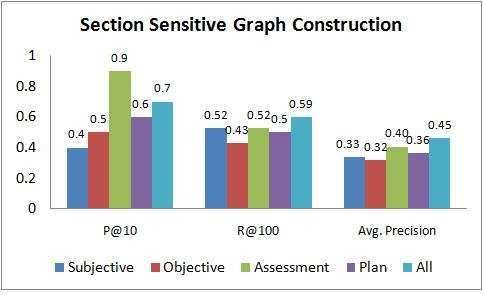
sixth was also built by using all the sections, but with equal symp-
tom weighing (EqRWR). That is, in the sixth graph, if two symp-
toms appeared together in a clinical note, their edge weight was
increased by 1 instead of 1/d, where d is the location offset in
words. The first five allowed us to analyze the utility of different
sections for the task. The last one allowed us to analyze the utility
of location sensitive heuristic itself.
   For evaluating each symptom graph, we started with the 15 Fram-
ingham symptoms as the initial vector and generated a ranked list of
related symptoms using RWR. The accuracy of this ranked list was
then evaluated in two ways - a) by comparing with expert judge-
ments, b) by looking at the usefulness of the related symptoms for             Figure 4: Comparison of location sensitive weighing with other
improving CHF prediction.                                                      baselines (31% improvement in AP over co-occurrence)

6.2.1     Expert Judgment Evaluation

Test Set Construction
The gold standard of related symptoms used for evaluating the
ranked lists was generated via pooling [7], an approach used fre-
quently in information retrieval evaluation. Each symptom graph
provided a single ranked list of symptoms. These ranked lists along
with an additional list obtained via a co-occurrence baseline which
ranked related symptoms based on how frequently they co-occured
with the Framingham symptoms in the clinical notes, were used for
judgements. Top 50 symptoms from each ranked list, a total of 175
unique symptoms, were pooled together and judged by two medi-                    Figure 5: Location sensitive graphs over different sections
cal experts. Finally, the 72 symptoms labeled as relevant by both
experts were deemed as relevant and used for evaluation. The inter-
annotation agreement was 81.8% (32 disagreements out of 175).                  only are symptom graphs useful for the task, but the location sen-
                                                                               sitive heuristic indeed helps improve performance.
Evaluation Metrics                                                                Figure 5 shows the performance comparison of SympGraphs con-
We used three standard information retrieval measures, i.e., Av-               structed over different SOAP sections using the location sensitive
erage Precision, Precision@10 and Recall@100, for quantitative                 heuristic. Performance varies significantly across sections.Graph
evaluation, which are described below.                                         based on Assessment section performed the best. This makes sense
   Average Precision intuitively captures the average of precision             as the Assessment section primarily contains a concise summary of
at every point when a new relevant symptom is retrieved. A higher              asserted symptoms and potential diagnoses. On the other hand, as
AP implies that a greater number of relevant symptoms are being                one would expect, Subjective and Objective graphs did not do so
assigned higher ranks in the ranked list. Suppose for some ranking             well presumably since these sections are usually noisy with a lot of
ri ∈ R , there are ki relevant symptoms. Further let rank(j) be                additional details. In practice, well formed section boundaries may
the rank of the j th relevant symptom and P (rank(j)) be the pre-              not always be available. Therefore inspite of its slightly lower per-
cision at the rank of the j th relevant symptom. Then                          formance, we are still most interested in the graph built using the
                                                                               entire notes, and will continue to use it for subsequent experiments.
                   # Relevant Symptoms T ill rank(j)       j
  P (rank(j)) =                                      = rank(j)
                        # Symptoms T ill rank(j)
                                                    P ki                       6.2.2     CHF Prediction Evaluation
                                                         P (rank(j))
Average precision of ri is then given by: AP (ri ) = j=1 k   i
                                                                     .            In order to further evaluate the utility of related symptoms, we
   Precision@10 is defined as the percentage of relevant symptoms              defined the CHF prediction task. The goal was to analyze a se-
in the top 10 symptoms of the ranked list. Recall@K is computed                quence of patient medical records and predict if a patient was likely
as the ratio of the number of relevant symptoms in the top K re-               to develop CHF in future, using only the list of related symptoms as
trieved list to the total number of all relevant symptoms.                     features. For this task we used the entire dataset of 1M encounters.
                                                                                  For positive examples (i.e., case patients with CHF), we only
Comparison of SympGraph construction methods                                   used the data from clinical notes before a patient was diagnosed
Figure 4 shows the performance comparison of SympGraph with                    with CHF for constructing the feature vector. For negative exam-
location sensitive heuristic (labeled LocSenseRWR) over two dif-               ples (i.e., control patients without CHF), we used all available data.
ferent baselines - symptom co-occurrence and SympGraph with                    Each selected symptom became one feature, and its feature value
equal weighing. All graphs were constructed over the case subset               was the number of occurrences of that symptom in the patient’s
and symptom ranked lists were obtained by using the 15 framing-                records.
ham symptoms as the initial vector for RWR. The location sensi-                   We compared the following methods for selecting features:
tive method (LocSenseRWR) outperforms the baselines in all three               Framingham: Uses 15 Framingham symptoms + 35 randomly se-
metrics. With an average precision of 0.46, it improves over the two           lected symptoms as features
baselines by about 31%. In particular, seven out of top ten symp-              Co-occurrence: Uses 15 Framingham symptoms + 35 additional
toms were found to be relevant and nearly 62% of known relevant                symptoms that most commonly co-occurred with Framingham symp-
symptoms were recovered in top 100. The results suggest that not               toms in the encounters.

                                                                        1172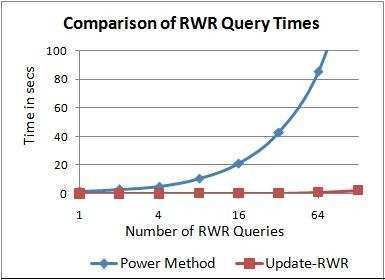
Fram.+Random Fram+Co-Occ. LocSenseRWR 6.3.1 Experimental Design
AUC 0.590(14.24%) 0.649(3.85%) 0.674
Accuracy Analysis: For accuracy evaluation, the top N ranked
Table 1: CHF prediction performance.Parenthesis show im- symptoms generated by the Update-RWR and the baseline methods
provement achieved by LocSenseRWR over the method (Power method) are compared by using the baseline symptoms as
the gold standard. Evaluation metrics used are: Average Precision
(AP), Precision at 50 (P @50), and Recall at N .
Intuitively precision at 50 tells us how many of the top-50 symp-
toms generated by Update-RWR, were found in the gold standard.
Recall at N gives the percentage of gold standard symptoms that
were recovered by Update-RWR. Finally AP takes a high value if
both precision and recall are high.
Efficiency Analysis: Recall that both methods start with an ini-
tial normalized matrix G as their starting point. For the baseline,
adding a new subgraph requires the modified graph matrix to be
renormalized. For Update-RWR we need to calculate the U,V,and
Λ once on the initial normalized matrix and update them whenever
a new subgraph is added (refer to algorithms 1 and 2). As a result
the speedup is evaluated by looking at three different times:
Figure 6: Symptom expansion results Initial one time matrix construction: In case of Update-RWR, this
is the time for constructing the matrices U,V and Λ on the large
LocSenseRWR: Uses the top 50 ranked symptoms obtained from a initial matrix as in algorithm 1. For the baseline this time is 0. This
symptom graph constructed with location sensitive heuristic. will happen only once.
Using the selected features, the model was trained on 90% pa- Matrix update time: For the baseline, this is the time required to
tients and tested on the rest with 10 fold cross validation. Eval- add the new subgraph matrix into the original symptom graph ma-
uation metric used was Area Under the ROC-Curve (AUC). The trix and re-normalize the resulting graph. This is the time for com-
classification model was an SVM classifier with Gaussian kernel: puting the updated Û, V̂ and Λ̂ as in algorithm 2. This will happen
kxi −xj k2
− every time a new subgraph is added.
Kij = e 2(ar̄ 2 ) , (5) Online Query time: This is the time to perform random walk restart.
where xi and xj are data samples and r̄ is the average of pairwise In case of baseline, it is the time taken for applying the power
distances among all the data samples. a is chosen from [2−3 , 2−2 , method. For Update-RWR it is the time for performing the step
2−1 , 1, 21 , 22 , 23 ]. The SVM trade off parameter C is chosen N B_LIN _OQ() in algorithm 1.
from [0.01, 0.1, 1, 10, 100]. We report the best results among all
the combinations of a and C. 6.3.2 Results
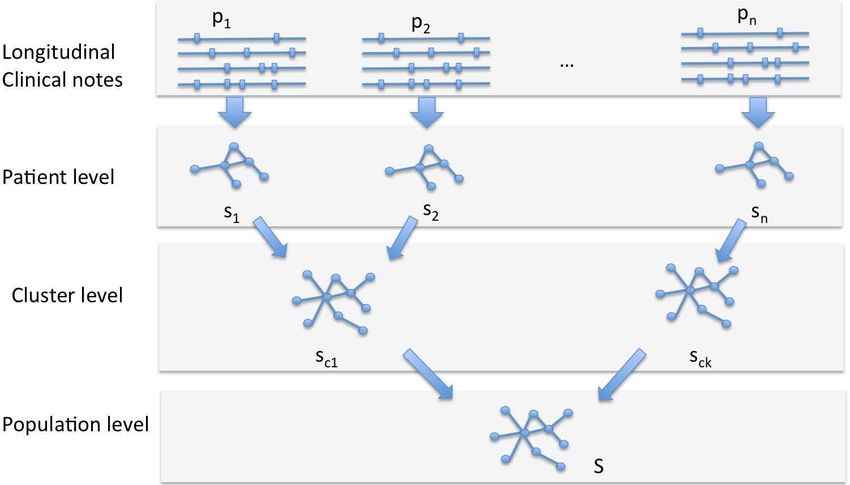
The results from CHF prediction task are shown in Table 1, which Figure 7 presents the results for Symptom Update task for the
corroborate our observations from human judgement evaluation. symptom ’PNDyspnea’. Results for other symptoms were similar.
The location sensitive graph (LocSenseRWR) outperforms the base- The task was simulated by constructing a symptom graph without
lines, suggesting that the expanded symptoms are useful for the one of the Framingham symptom nodes and later updating it with
task. Figure 6 shows some of these top expanded symptoms. In all of missing symptom’s edges. RWR was then run on the updated
particular, coronary arteriosclerosis, hypertension, diabetes etc. are matrix using the new symptom as the initial vector. The accuracy
all very related co-morbidity and risk factors to HF and have been was compared for top N = 200 symptoms (results for other val-
confirmed by clinical experts. ues of N were similar). The low rank approximation parameter
l for the initial normalized matrix G serves to control the trade-
6.3 Dynamic Update Analysis off between efficiency and accuracy of the method. The low rank
In order to evaluate the efficiency of the proposed Update-RWR approximation parameter k for the update matrix Ĝ did not affect
method we defined two real world update tasks: (1) Symptom Ex- the results as much and was empirically set to 2. The low rank
tractor Update: This task assumes that we have just updated our approximations were obtained using the signular value decompo-
UIMA pipeline to extract a new symptoms from clinical notes. As sition (SVD [3]) method. Increasing l results in improved average
a result the existing graph must be updated with a new symptom precision and recall@200, which both tend to 1 as l goes beyond
node and all its edges. (2) Patient Update: This task assumes that 400. On the other hand even for small values eg. l = 50 the perfor-
data for a new patient (a small patient subgraph) has joined and mance is still reasonably good. In particular, we observed a P @50
needs to be incorporated into an existing symptom graph. of 1 for all data points in Figure 7. This implies at all of the top
Both tasks require incorporating a smaller subgraph (represent- 50 ranked symptoms by Update-RWR were found in the top 200
ing new information) into an existing symptom graph. We want baseline symptoms. In addition, 89% symptoms were common in
to evaluate efficiency and effectiveness of Update-RWR algorithm the two lists. Finally AP of 0.88 implies that most of the symptoms
compared to recomputation using the power method. ranked high by Update-RWR were common to both lists.
All dynamic update experiments were carried out on a 32-bit In terms of efficiency, we observe that the speedup reduces as
Windows Vista machine with 3Gb RAM and intel core-2 Duo 2.5 l increases. This is because a higher l implies a matrix multipli-
GHz processor. The initial symptom graph G consisted of 11.8K cation between dense higher dimensional matrices. Assuming l as
symptom nodes and 1.4 million edges. For both patient update and 50 we observe that while the difference in matrix update times is
symptom update tasks, individual patient subgraphs usually con- not that much, Update-RWR outperforms the baseline significantly
tained less than 1000 edges, while for symptom update task, the in online query performance. We do not compare the performance
symptom subgraphs contained up to 2500 edges. of Update-RWR with the original N B_Lin in algorithm 1 as it
1173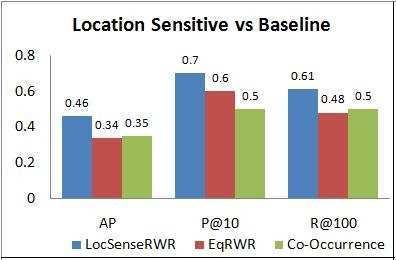
Figure 8: Online RWR query execution times. The scale on
                                                                                     x-axis is logarithmic.
Figure 7: Symptom update results (speed up values are for on-
line query performance)

        Method           Initial Matrix     Avg. Matrix     Avg. Online RWR
                       Construction Time    Update Time       Query Time
      Update-RWR              5.28         3.067(+/-.046)    0.017(+/-.005)
     Baseline(Power)             -         6.705(+/-.094)    1.336(+/-.028)
     Times Speedup               -             2.186              78.59

Table 2: Time comparisons for patient update task. All values
in secs. Averages are over 50 patient additions. Parenthesis
provide standard deviations.

would require us to reconstruct the three U,V,Λ matrices on every
update, and as a result the method would perform far worse than
the other two, making the comparison not interesting.
   Table 2 presents the different time metrics for Update-RWR and                         Figure 9: AP and Recall@200 for patient update task
Power method for adding a new patient subgraph and running RWR.
The time values are averaged over 50 different patient additions.
                                                                                     mining has recently been studied (see e.g., [19]), especially bib-
The value of low rank approximation parameters l and k were fixed
                                                                                     liographical network and social networks. A main difference be-
at 50 and 2, respectively. As expected, our proposed method is over
                                                                                     tween the proposed SympGraph and these graphs lies in that both
78 times faster than the baseline. This improves efficiency dramat-
                                                                                     the nodes and edges in a SympGraph are extracted computation-
ically when multiple RWR queries need to be performed. Figure 8
                                                                                     ally from text data. An immediate consequence of this difference
illustrates this point.
                                                                                     is that we need to address the issue of uncertainty in the edges of a
   Finally, Figure 9 compares the accuracy. Here we update G by
                                                                                     SympGraph, which raises new challenges in designing graph min-
repeatedly adding new patients using Update-RWR i.e. for adding
                                                                                     ing algorithms.
x patients, Update-RWR gets applied x times consecutively. The
                                                                                        Random Walk with Restart (RWR) [20] and related ideas have
accuracy of the updated matrix after say x patient additions, is eval-
                                                                                     been applied to many problems such as Personalized PageRank
uated by comparing against the ideal normalized matrix for those
                                                                                     [5] for Web search and image tagging [1]. Thanks to our graph
additions, i.e. the one we get after adding all x patient subgraphs
                                                                                     viewpoint for the extracted symptoms, we are able to leverage this
to G and renormalizing. We observe that the accuracy continues to
                                                                                     powerful tool to discover related patient symptoms. In terms of
remain high inspite of over 400 consecutive new patient additions.
                                                                                     computation, most of the existing fast algorithms apply to the static
                                                                                     graphs. In [21], the authors proposed an efficient on-line algorithm
7.    RELATED WORK                                                                   for skewed bipartite graphs, which does not apply to the symp-
   Information extraction from clinical records and medical text in                  tom graph. Other remotely related works include dynamic PageR-
general has been studied in the existing work (see, e.g., [4, 12, 23,                ank [14, 17], Fast SimRank [10, 9], etc. Our work can be regarded
18, 16]). In most cases, standard information extraction techniques                  as adding to this line of work a new application of RWR for finding
have been applied or adapted to the medical domain for recogniz-                     related symptoms in graphs of patient symptoms.
ing various entities such as diseases [22] and treatments [2]. We                       Prediction of patient diseases based on patient records has been
however, go beyond symptom extraction to further construct symp-                     studied mostly by using the structured fields in the patient records
tom graphs and study how to leverage such graphs to convert raw                      (see e.g., [6]). Our work aims at tapping into the unstructured text
symptom mentions into more useful knowledge.                                         data in clinical notes to extract symptom information, which can
   Graph representations are frequently used to facilitate data min-                 be used as extra features for prediction in a statistical prediction
ing. In most cases, a graph is naturally constructed based on ob-                    model, thus can be regarded as complementary with the study of
served data where the edges are directly available in an application.                prediction methods. Our experiment results show that the symptom
For example, Web graphs are often constructed with web pages as                      features generated using the proposed SympGraph can be leveraged
nodes and hyperlinks as edges [13, 8]. Also, information network                     to improve the accuracy of prediction of CHF disease.

                                                                              1174
8. CONCLUSIONS Report 5266, Computer Laboratory, University of
In this paper, we present SympGraph, a general mining frame- Cambridge, 1975.
work for extracting and analyzing symptoms in longitudinal clin- [8] J.M. Kleinberg. Authoritative sources in a hyperlinked
ical notes. SympGraph constructs symptom graphs based on co- environment. Journal of the ACM, 46(5):604–632, 1999.
location relations among detected symptom mentions. Within the [9] C. Li, J. Han, G. He, X. Jin, Y. Sun, Y. Yu, and T. Wu. Fast
general formulation of symptom graphs, we present the important computation of simrank for static and dynamic information
clinical mining application of symptom expansion. We also present networks. In EDBT, pages 465–476, 2010.
an efficient dynamic update method to incorporate updates to the [10] D. Lizorkin, P. Velikhov, M.N. Grinev, and D. Turdakov.
underlying symptom graphs. Accuracy estimate and optimization techniques for simrank
Our evaluation on a large-scale real world clinical database with computation. PVLDB, 1(1):422–433, 2008.
1 million clinical notes of over 13K patients revealed an improve- [11] P.A. McKee, W.P. Castelli, P.M. McNamara, and
ment of over 31% for the symptom expansion task and that the W.B. Kannel. The natural history of congestive heart failure:
expanded symptoms were indeed useful for predicting the onset The framingham study. N Engl J Med., 285:1441–1446,
of Congestive Heart Failure. In terms of the scalability we show 1971.
that the proposed dynamic symptom expansion approach is signifi- [12] S. Meystre, G. Savova, K.K. Schuler, and J. Hurdle.
cantly faster than the baseline Power method when multiple online Extracting information from textual documents in the
queries are involved. electronic health record: A review of recent research. IMIA
It is worth noting that although we mainly explored the use of Yearbook of Medical Informatics Methods Inf Med 2008,
the proposed SympGraph for symptom expansion at the population 2008. 47 Suppl 1:128–44.
level. SympGraph can easily support many other mining applica- [13] L. Page, S. Brin, R. Motwani, and T. Winograd. The
tions, particularly due to the possibility of constructing SympGraph pagerank citation ranking: Bringing order to the web.
in multiple resolutions. Indeed, we can construct SympGraphs cor- Technical report, Stanford Digital Library Technologies
responding to any meaningful ways of aggregating patient records Project, 1998.
(e.g., at the level of individual patients, patient groups, or aggre-
[14] A. Pathak, S. Chakrabarti, and M.S. Gupta. Index design for
gation over different time periods or geographic locations). More- dynamic personalized pagerank. In ICDE, pages 1489–1491,
over, in addition to symptom expansion, SympGraph can also nat- 2008.
urally support many other tasks such as patient stratification and
[15] W.W. Piegorsch and G.E. Casella. Inverting a sum of
clustering, comparative analysis of patient groups or mine tempo-
matrices. In SIAM Review, volume 32, pages 470–470, 1990.
ral symptom patterns. Given the importance and promise of apply-
ing text mining to the health domain, we believe that the proposed [16] A.R. Post and J.H. Harrison Jr. Protempa: A method for
SympGraph can serve as a general representation framework for specifying and identifying temporal sequences in
developing sophisticated text mining systems in health domain. retrospective data for patient selection. JAMIA,
14(5):674–683, 2007.
[17] A.D. Sarma, S. Gollapudi, and R. Panigrahy. Estimating
9. ACKNOWLEDGEMENTS pagerank on graph streams. J. ACM, 58(3):13, 2011.
This paper is based upon work supported in part by an IBM faculty [18] G.K. Savova, J.J. Masanz, P.V. Ogren, J. Zheng, S. Sohn,
award. Research was also partly sponsored by the Army Research Labora- K.K. Schuler, and C.G. Chute. Mayo clinical text analysis
tory and was accomplished under Cooperative Agreement Number W911NF- and knowledge extraction system (ctakes): architecture,
09-2-0053. component evaluation and applications. JAMIA,
17(5):507–513, 2010.
10. REFERENCES [19] Y. Sun, Y. Yu, and J. Han. Ranking-based clustering of
[1] T. Bailloeul, C. Zhu, and Y. Xu. Automatic image tagging as heterogeneous information networks with star network
a random walk with priors on the canonical correlation schema. In John F. Elder IV, Françoise Fogelman-Soulié,
subspace. In MIR ’08, pages 75–82, New York, NY, USA, Peter A. Flach, and Mohammed Javeed Zaki, editors, KDD,
2008. ACM. pages 797–806. ACM, 2009.
[2] S. Doan and H. Xu. Recognizing medication related entities [20] H. Tong, C. Faloutsos, and J.Y. Pan. Random walk with
in hospital discharge summaries using support vector restart: fast solutions and applications. Knowl. Inf. Syst.,
machine. In COLING (Posters), pages 259–266, 2010. 14:327–346, March 2008.
[3] G.H. Golub and C.F.V. Loan. Matrix Computation. Johns [21] H. Tong, S. Papadimitriou, P.S. Yu, and C. Faloutsos.
Hopkins, 1996. Proximity tracking on time-evolving bipartite graphs. In
[4] H. Harkema, I. Roberts, R. Gaizauskas, and M. Hepple. SDM, pages 704–715, 2008.
Information extraction from clinical records. In Proceedings [22] Y. Wang. Annotating and recognising named entities in
of the 4th UK e-Science All Hands Meeting, 2005. clinical notes. In ACL/AFNLP (Student Research Workshop),
Nottingham, UK. pages 18–26. The Association for Computer Linguistics,
[5] T.H. Haveliwala. Topic-sensitive pagerank. In WWW, pages 2009.
517–526, 2002. [23] H.Xu, S.P. Stenner, S. Doan, K.B. Johnson, L.R. Waitman,
[6] B.E. Himes, Y. Dai, I.S. Kohane, S.T. Weiss, and M.F. and J.C. Denny. Medex: a medication information extraction
Ramoni. Prediction of chronic obstructive pulmonary disease system for clinical narratives. Journal of American Medical
(copd) in asthma patients using electronic medical records. Informatics Association, 17(1):19–24, Jan-Feb 2010.
JAMIA, 16(3):371–379, 2009.
[7] K. Jones and C.J.V. Rijsbergen. Report on the need for and
provision of an “ideal” information retrieval test collection.
Technical Report British Library Research and Development
1175You can also read