GENERATING LANDMARK NAVIGATION INSTRUC-TIONS FROM MAPS AS A GRAPH-TO-TEXT PROBLEM
←
→
Page content transcription
If your browser does not render page correctly, please read the page content below
Under review as a conference paper at ICLR 2021

G ENERATING L ANDMARK NAVIGATION I NSTRUC -
TIONS FROM M APS AS A G RAPH - TO -T EXT P ROBLEM

 Anonymous authors
 Paper under double-blind review

                                            A BSTRACT

           Car-focused navigation services are based on turns and distances of named streets,
           whereas navigation instructions naturally used by humans are centered around
           physical objects called landmarks. We present a neural model that takes Open-
           StreetMap representations as input and learns to generate navigation instructions
           that contain visible and salient landmarks from human natural language instruc-
           tions. Routes on the map are encoded in a location- and rotation-invariant graph
           representation that is decoded into natural language instructions. Our work is
           based on a novel dataset of 7,672 crowd-sourced instances that have been verified
           by human navigation in Street View. Our evaluation shows that the navigation
           instructions generated by our system have similar properties as human-generated
           instructions, and lead to successful human navigation in Street View.

1       I NTRODUCTION

Current navigation services provided by the automotive industry or by Google Maps generate route
instructions based on turns and distances of named streets. In contrast, humans naturally use an
efficient mode of navigation based on visible and salient physical objects called landmarks. Route
instructions based on landmarks are useful if GPS tracking is poor or not available, and if informa-
tion is inexact regarding distances (e.g., in human estimates) or street names (e.g., for users riding
a bicycle or on a bus). We present a neural model that takes real-world map representations from
OpenStreetMap1 as inputs and learns to generate navigation instructions that contain visible and
salient landmarks from human natural language instructions.
In our framework, routes on the map are learned by discretizing the street layout, connecting street
segments with adjacent points of interest – thus encoding visibility of landmarks, and encoding the
route and surrounding landmarks in a location- and rotation-invariant graph representation. Based on
crowd-sourced natural language instructions for such map representations, a graph-to-text mapping
is learned that decodes graph representations into natural language route instructions that contain
salient landmarks. Our work is accompanied by a dataset of 7,672 instances of routes rendered on
OpenStreetMap and crowd-sourced natural language instructions. The navigation instructions were
generated by workers on the basis of maps including all points of interest, but no street names. They
were verified by different workers who had to follow the natural language instructions on Google
Street View2 .
Experimental results on randomly sampled test routes show that our graph-to-text model produces
landmarks with the same frequency found in human reference instructions, and located mostly at
the end of the navigation instructions, similar to human references. Furthermore, the success rate of
human workers finding the correct goal location on Street View is roughly at 50% of the success rate
of navigation based on human-generated instructions. Since these routes can have a partial overlap
with routes in the training set, we further performed an evaluation on completely unseen routes. The
rate of produced landmarks drops slightly compared to human references, and the success rate is at
40% of the success rate for navigating based on human-generated instructions. While there is still
room for improvement, our results showcase a promising direction of research, with a wide potential
of applications in various existing map applications and navigation systems.
    1
        www.openstreetmap.org
    2
        www.google.com/streetview

                                                   1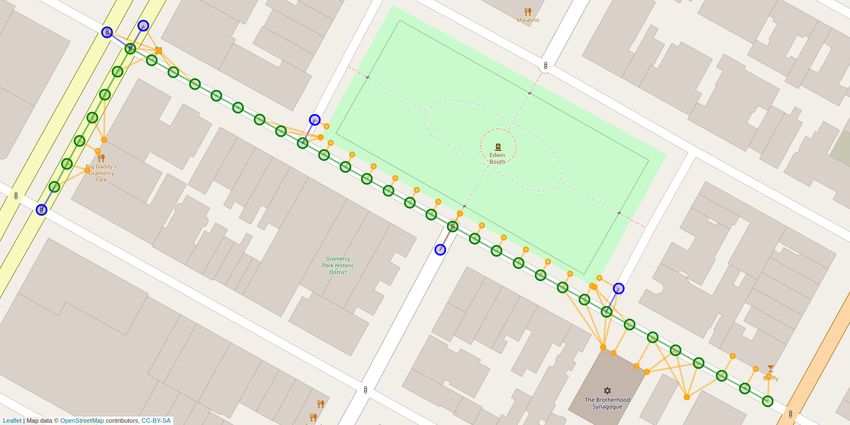
Under review as a conference paper at ICLR 2021

2       R ELATED W ORK AND DATASETS
Mirowski et al. (2018) published a subset of Street View covering parts of New York City and
Pittsburgh. Street View is a navigable environment that is build from real-world 360◦ panoramas.
This data is used by Hermann et al. (2019) to train a visual agent to follow turn-by-turn instructions
generated by Google Maps API. Chen et al. (2019) later published a Street View dataset3 with more
recent and higher resolution panorama images that covers the lower half of Manhattan. They further
introduce the Touchdown task which goal it is to navigate in Street View in order to find a hidden
teddy bear. The data for that task is obtained from human annotators that follow a predefined route
in Street View and write down navigation instructions along the way.
Our work puts the task of natural language navigation upside down by learning to generate human-
like navigation instructions from real-world map data instead of training an agent to follow human
generated instructions. Prior work in this area has used rule-based systems to identify landmarks
(Rousell & Zipf, 2017) or to generate landmark-based navigation instructions (Dräger & Koller,
2012; Cercas Curry et al., 2015). Despite having all points of interest on the map available, our
approach learns to verbalize only those points of interest that have been deemed salient by inclu-
sion in a human navigation instruction. Previous approaches that learn navigation instructions from
data have been confined to simplified grid-based representations of maps for restricted indoor envi-
ronments (Daniele et al., 2017), or failed to succeed in generating human-like landmark navigation
instructions for more complex outdoor environments (de Vries et al., 2018). Other work generates
navigation instructions from indoor panoramas along a path (Fried et al., 2018).

3       TASK
The task addressed in our work is that of automatically generating Natural Language Landmark Nav-
igation Instructions (NLLNI) from real-world open-source geographical data from OpenStreetMap.
Training data for NLLNI was generated by human crowdsourcing workers who were given a route
on an OpenStreetMap rendering of lower Manhattan, with the goal of producing a succinct natu-
ral language instruction that does not use street names or exact distances, but rather is based on
landmarks. Landmarks had to visible on the map and included churches, commercial buildings of
cinemas, banks, or shops, and public amenities such as parks or parking lots. Each generated navi-
gation instruction was validated by another human crowdsourcing worker who had to reach the goal
location by following the instruction on Google Street View.
NLLNI outputs are distinctively different from navigation instructions produced by OpenRouteSer-
vice, Google Maps, or car navigation systems. While these systems rely on stable GPS signals such
that the current location along a grid of streets can be tracked exactly, we aim at use cases where
GPS tracking is not available, and knowledge of distances or street names is inexact, for example,
pedestrians, cyclists, or users of public transportation. The mode of NLLNI is modeled after human
navigation instructions that are naturally based on a small number of distinctive and visible land-
marks in order to be memorizable while still being informative enough to reach the goal. A further
advantage of NLLNI is that they are based on map inputs which are more widely available and less
time dependent than Street View images.

4       DATA C OLLECTION
Because there is no large scale dataset for NLLNI that is generated from map information only, we
collect new data via crowdsourcing. The annotator is shown a route on the map and writes navigation
instructions based on that information (Figure 1, top). We take the approach of Chen et al. (2019)
and determine correctness of navigation instructions by showing them to other annotators that try to
reach the goal location in Street View (Figure 1, bottom).

4.1      R ESOURCES AND P REPARATION

We use the static Street View dataset provided by Chen et al. (2019). This allows to replicate the
experiments in this work. Because the panorama pictures were taken at the end of 2017, we export
    3
        www.streetlearn.cc

                                                  2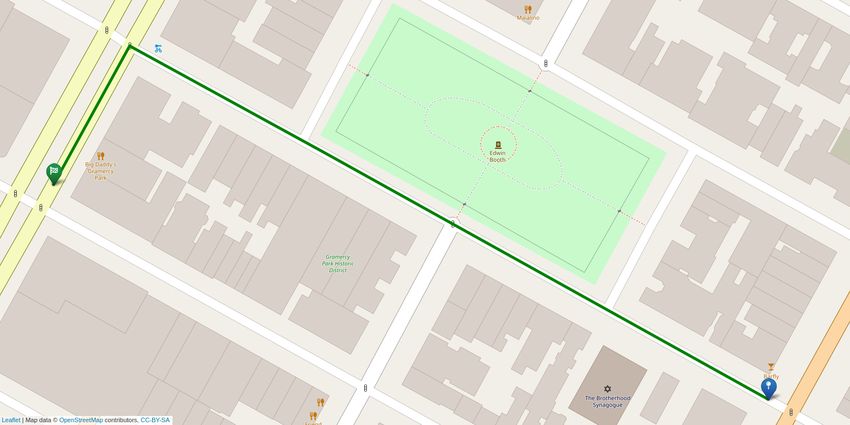
Under review as a conference paper at ICLR 2021
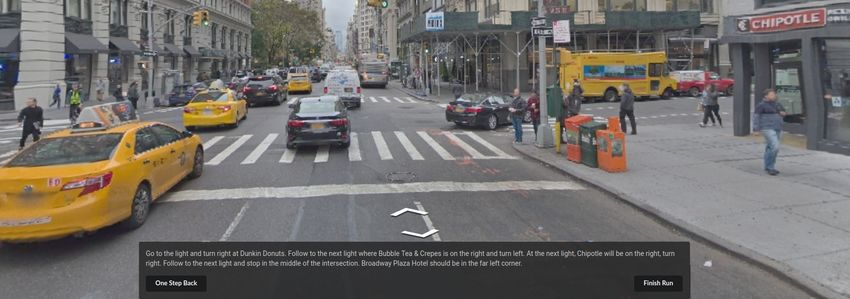
Figure 1: The data collection is split into two tasks. In the navigation instructions task (top) annota-
tors see a rendered map and write instructions to follow the route. The navigation run task (bottom)
is used to validate navigation instructions. A different annotator tries to find the goal location in
Street View.
an OpenStreetMap extract of Manhattan from that time. OpenStreetMap (OSM) is an open source
collection of geodata that can be used to render maps of the world. It features detailed street layouts
and annotations for points of interest (POI) like amenities, infrastructure or land use4 .
We discretize the street layout by creating a node every ten meters along the roads. The resulting
structure is further referenced to as OSM graph which nodes are street segments. Based on that
graph we sample routes of length between 35 and 45 nodes. A route is the shortest path between its
start and end node. It includes a minimum of three intersections (node with more than two edges)
and ends in proximity to a POI. We further assure that it is possible to follow the route in Street View
by looking for an equivalent subgraph in the Street View graph.
4.2 C ROWDSOURCING
We use Amazon Mechanical Turk (AMT)5 to acquire annotators. Before working on the actual
tasks, workers were required to pass a tutorial and qualification test. The tutorial introduces the
tasks, teaches basic mechanics of Street View and explains meaning of map icons. A feature of
AMT and additional IP address lookup ensures that annotators are located in the United States. This
increases the probability of native English speakers and people familiar with US street environments.
We pay $0.35 per navigation instructions task and $0.20 for the navigation run task. We pay a bonus
of $0.15 for successfully reaching the goal location and $0.25 for validated navigation instructions.
The amounts are chosen on the basis of $10/hour.
The annotation procedure involves two phases. First an annotator writes navigation instructions for
a given route. Afterwards, a different annotator uses the instructions to navigate to the goal location.
If one of two annotators does so successfully, the navigation instructions are considered valid.
Navigation Instructions Task As shown in Figure 1 (top) the annotator sees a route on a map
which is rendered without street names. Workers were told to write navigation instructions as if ”a
4
www.openstreetmap.org/wiki/Map_Features
5
www.mturk.com
3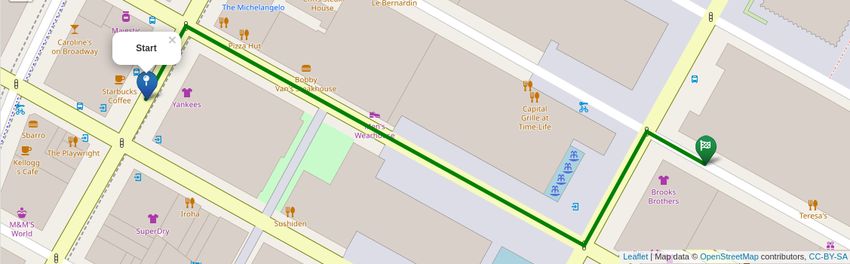
Under review as a conference paper at ICLR 2021

 Dataset            #Instructions   Environment   Data Source            #Nodes     Avg. Length     Vocabulary     Avg. Tokens
 Talk the Walk                786   gridworld     3D rendering               100            6.8            587            34.5
 Room-to-Room              21,567   indoor        panoramas               10,800            6.0          3,156            29.0
 Touchdown                  9,326   outdoor       panoramas               29,641           35.2          4,999            89.6
 Talk2Nav                  10,714   outdoor       panoramas and map       21,233           40.0          5,240            68.8
 Room-X-Room              126,069   indoor        panoramas               10,800            7.0          388K             78.0
 map2seq                    7,672   outdoor       map                     29,641           40.0          3,826            55.1

Table 1: Overview of natural language navigation instructions datasets. The instructions in our
dataset rely solely on information present in OpenStreetMap. Dataset: Talk the Walk (MacMahon
et al., 2006); Room-to-Room (Anderson et al., 2018); Touchdown (Chen et al., 2019); Talk2Nav (Va-
sudevan et al., 2020); Room-X-Room (Ku et al., 2020); map2seq (this work). #Instructions: Num-
ber of instructions in the dataset. Environment: Type of the environment the instructions are written
for. Information Source: Type of information the annotator uses to write the navigation instruc-
tions. #Nodes: Number of nodes in the discretized environment. Avg. Length: Average number of
nodes per route. Vocabulary: Number of unique tokens in the instructions. Avg. Tokens: Number
of tokens per route instruction.

                                 R-to-R   Touchdown   map2seq
       Phenomenon                                                                           Example
                                 c    µ    c     µ     c   µ
 Reference to unique entity     25 3.7    25    9.2   25 6.3    ...   turn right where Dough Boys is on the corner ...
 Coreference                     8 0.5    15    1.1    8  0.5   ...   is a bar, Landmark tavern, stop outside of it ...
 Comparison                      1 0.0    3     0.1    0  0.0   ...   there are two lefts, take the one that is not sharp ...
 Sequencing                      4 0.2    21    1.6   24 1.8    ...   continue straight at the next intersection ...
 Count                           4 0.2    9     0.4   11 0.6    ...   go through the next two lights ...
 Allocentric spatial relation    5 0.2    17    1.2    9  0.5   ...   go through the next light with Citibank at the corner. ...
 Egocentric spatial relation    20 1.2    23    3.6   25 3.2    ...   at the end of the park on your right...
 Imperative                     25 4.0    25    5.2   25 5.3    ...   head down the block and go through the double lights ...
 Direction                      22 2.8    24    3.7   25 3.5    ...   head straight to the light and make a right ...
 Temporal condition              7 0.4    21    1.9    7  0.3   ...   go straight until you come to the end of a garden area ...
 State verification              2 0.1    18    1.5   12 0.6    ...   you should see bike rentals on your right ...

Table 2: Linguistic analysis of 25 randomly sampled navigation instructions. Numbers for Room-
to-Room (Anderson et al., 2018) and Touchdown (Chen et al., 2019) taken from the latter. c is the
number of instructions out of the 25 which contain the phenomenon at least once. µ is the mean
number of times each phenomenon occurs in the 25 instructions.

tourist is asking for directions in a neighborhood you are familiar with” and to ”mention landmarks
to support orientation”. The navigation instructions were written in a text box below the map which
is limited to 330 characters.

Navigation Run Task Figure 1 (bottom) shows the Street View interface with navigation instruc-
tions faded-in at the bottom. It is possible to look around 360◦ and movement is controlled by the
white arrows. In addition there is a button on the bottom left to backtrack which proved to be very
helpful. The initial position is the start of the route with facing in the correct direction. The anno-
tators finish the navigation run with the bottom right button either when they think the goal location
is reached or if they are lost. The task is successful if the annotator stops the run within a 25 meter
radius around the goal location.

Failure Modes A rather common mistake made by instruction writers is to mix up left and right.
They see the map in north orientation and have to mentally rotate the image to figure out the direc-
tion of the next turn. A conceptual error source are landmarks that are not visible in Street View.
This happens due to wrong annotations in OSM, date mismatch between OSM and Street View, or
blocked view, e.g., by a truck.

4.3    DATASET

The data collection resulted in 7,672 navigation instructions that were manually validated in
Street View. For additional 1,059 instructions, the validation failed which amounts to a validation
rate of 88%. Of the validated instructions, 1,033 required a second try in the navigation run task.
On average, instructions are 257 characters long and minimum length is 110 (maximum 330). We
will release the segmented OSM graph, the routes in that graph paired with the collected navigation
instructions, and the data split used in our experiments. Table 1 gives a comparison of different

                                                            4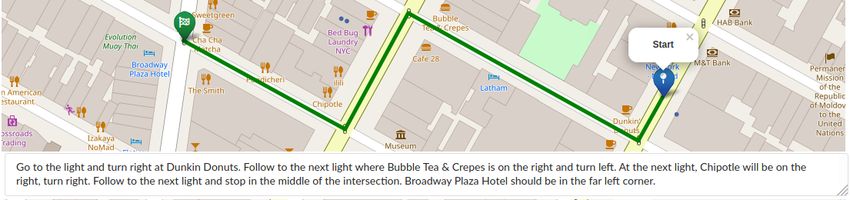
Under review as a conference paper at ICLR 2021
Figure 2: Route rendered on the map (left). Street segmentation and landmark visibility (right).
park node token
node type
leisure Gramercy Park
directed edge
directed edge
90° with angle
90°
270°
91°
133°
88° 90° 90° bar Barfly
90°
6°
35°
0°
271° 359°
0° amenity
332°
Big
1° 89°
359°
214°
3° 90° 63°
0°
amenity
Daddy's
269° 1°
358°
0° 0°
restaurant
219°
270°
321°
amenity place_of_worship
The Brotherhood Synagogue
Figure 3: Graph representation of the route in Figure 2. The encircled middle part is magnified
for readability. Some nodes are left out for sake of clear visualization. Also, node colors are for
visualization only and not encoded in the graph. Green nodes are part of the route. Blue nodes are
neighboring street segments. Orange nodes belong to OSM points of interest. Angles are relative to
route direction and start clockwise at 0◦ which is facing forward.
datasets with natural language landmark navigation instructions. Our dataset is the only one whose
navigation instructions were written from map information only. The advantage of relying solely
on map data is the global availability and longevity of encoded features. In contrast, navigation
instructions written from Street View include temporal features like construction utilities, advertise-
ment or vehicles. Table 2 shows a qualitative linguistic analysis of the navigation instructions of
different datasets. In general, navigation instructions are driven by giving directions in imperative
formulation while referencing to entities along the route. Although the instructions writers in our
setting did not see the route in first person perspective, objects are vastly referenced to in egocentric
manner (egocentric in respect to the navigating agent). This is because the annotator knows the start-
ing direction and can infer the facing direction for the rest of the route. Because the initial facing
direction in Touchdown is random, the first part of their instructions is about rotating the agent. This
explains the higher number of occurrences for the state verification phenomenon. In our dataset,
state verification is usually used to ensure the correct stopping position. The different setting of data
collection is also reflected by the temporal condition phenomenon. Annotators of Touchdown write
down instructions while navigating Street View and thus experience the temporal component first
hand, while our annotators have a time independent look at the route.
5 M ETHOD
The underlying OSM geodata of the rendered map (Figure 2, left) is an XML tree of nodes located in
the latitude-longitude coordinate system. The nodes are composed into ways and polygons6 . These
elements in connection with their annotations are used to render the visual map. In order to train a
6
www.openstreetmap.org/wiki/Elements
5Under review as a conference paper at ICLR 2021
neural model on this kind of data, we need to bring it into a more convenient format. Because road
networks can naturally be expressed as a graph, it is reasonable to incorporate other map features
into that graph. In the next section we propose our approach to represent a route and its surrounding
map features as a graph that includes all necessary information for generating landmark navigation
instructions. The second section describes the neural graph-to-text architecture that is trained to
learn inductive representations of the individual route graphs and to decode navigation instructions
from them.
5.1 M AP - TO -G RAPH R EPRESENTATION
The basis of the graph for a single route is the OSM subgraph (Section 4.1) that includes the actual
route nodes. Further, neighboring street segment nodes are added. This is depicted in Figure 2 (right)
as green and blue circles respectively. In order to decide on the visibility of the POIs, we employ a
technique similar to that of Rousell & Zipf (2017). For each street segment, the POIs in a radius of
30 meters are identified. If a line drawn between the street segment and the POI is not interrupted
by a building polygon, the POI is considered visible from that particular street segment. If the POI
itself is (inside) a polygon, then the line is drawn to the closest point on the POI polygon. The
orange circles in Figure 2 (right) show the results of the visibility check and how they naturally fit
into the graph structure. Each point of interest in OSM has one or more tags in the form of key and
value pairs. They store properties like type or name. Note that we only determine the geometric
visibility of the POIs and do not incorporate any hand-crafted salience scores as to what would be a
good landmark. Saliency of a landmark is implicitly learned from natural language verbalization of
the POI in the human-generated instruction.
An example graph representation of the route in Figure 2 is given in Figure 3. Formally, a route
representation is a directed graph G = (V, E) where V denotes the set of nodes and E the set of
edges. A node v consists of a node type v t and a node token v w . There are V t node types and V w
node tokens. Street segments are of type . A point of interest has the node type . An
OSM tag key has the node type and an OSM tag value has the node type .
The node token further specifies nodes in the graph. Street segments that belong to the route have
a node token according to their sequential position P: . The last route segment has the special
token . Other street segment nodes have the token. The actual key and value
literals of an OSM tag are the node tokens of the respective node. The OSM name tag is split into
multiple nodes with type where N is the word position and the node token is the word
at that position.
All adjacent street segment nodes are connected with an edge in both directions. If a POI is visible
from a particular street segment, there is an edge from the corresponding POI node to that street
segment node. Each POI node is connected with their tag key nodes. A tag value node is connected
to its corresponding tag key node. The name tag nodes of the same POI are connected with each
other. Some edges have a geometric interpretation. This is true for edges connecting a street segment
with either a POI or with another street segment. These edges (u, v) ∈ EA , EA ⊂ E have a label
attached. The label ang(u, v) is the binned angle between the nodes relative to route direction. The
continuous angle [0◦ , 360◦ ) is assigned to one of 12 bins. Each bin covers 30◦ with the first bin
starting at 345◦ . The geometric distance between nodes is not modeled explicitly because street
segments are equidistant and POI visibility is determined with a maximum distance. The proposed
representation of a route and its surroundings as a directed graph with partially geometric edges is
location- and rotation-invariant, which greatly benefits generalization.
5.2 G RAPH - TO -T EXT A RCHITECTURE
By representing a route as a graph, we can frame the generation of NLLNI from maps as a graph-
to-text problem. The encoder learns a neural representation of the input graph and the sequence
decoder generates the corresponding text. The architecture follows the Transformer (Vaswani et al.,
2017) but uses graph attentional layers (Veličković et al., 2018) in the encoder. Graph attention
injects the graph structure by masking (multi-head) self-attention to only attend to nodes that are
first-order neighbors in the input graph. The geometric relations between some nodes are treated
as edge labels which are modeled by distinct feature transformation matrices during node aggrega-
tion (Schlichtkrull et al., 2018).
6Under review as a conference paper at ICLR 2021
The input to a layer of the encoder is a set of node representations, x = {x1 , x2 , . . . , xN }, xi ∈
Rdm , where N is the number of nodes and dm is the model size. Each layer l : Rdm → Rdm
takes x and produces new node representations x0 . The input to the first layer is constructed from
the concatenation of type and token embedding: xi = ReLU (W F [EvTt ||EvWiw ]) where W F ∈
i
R2dm ×dm is a weight matrix, E T ∈ Rdm and E W ∈ Rdm are embedding matrices for node types
and node tokens, respectively.
The output of a single graph attention head is the weighted sum of neighboring node representations:
X
U
x̄i = αij (Wr(i,j) xj ) (1)
j|(vj ,vi )∈E
exp (eij )
The weight coefficient is computed as αij = softmaxj (eij ) = P
exp (eik ) where eij mea-
k|(vk ,vi )∈E
sures the compatibility of two node representations:
eij = LeakyReLU (aT [W V xi ||Wr(i,j)
U
xj ]) (2)
where a ∈ R2dh , W V ∈ Rdm ×dh , dh = dm /h is the attention head dimension and h is the number
U
of heads. In the case of a geometric relation between nodes, the weight matrix Wr(i,j) ∈ Rdm ×dh is
selected according to the angle label between the nodes: r(i, j) = ang(ui , uj ), otherwise r(i, j) =
unlabeled. The output of each head is concatenated and after a skip connection forwarded to the
next encoder layer. The encoder layer is applied L times and the final node representations x∗ are
used in the decoder context attention mechanism. Thus, no modification of the Transformer decoder
is necessary and L decoder layers are used. Further, the decoder can copy node tokens from the
input into the output sequence (See et al., 2017).
The described architecture is able to model all aspects of the input graph. Graph attention models
directed edges. Edge labels model the geometric relation between nodes. Heterogeneous nodes
are represented by their type embedding and token embedding. The sequentiality of the route is
encoded by tokens (, , ...) of the respective nodes. This is analogous to absolute position
embeddings which provide word order information for text encoding (Vaswani et al., 2017; Devlin
et al., 2019).
6 E XPERIMENTS
6.1 BASELINES
We consider two baselines. A heuristic rule based system that constructs instructions by stringing
together all POIs and intersections along the route. An intersection/light is followed by the turning
direction. Similar, POIs are followed by ’left’ or ’right’ depending on which side of the street they
appear. The end of the route is signaled by the ’stop’ token. You can see an example sequence
in Figure 4. The second baseline is a seq2seq (sequence-to-sequence) model that takes those rule
based navigation instructions as input and is trained to generate the corresponding NLLNI from
the dataset. The seq2seq model follows the Transformer architecture with copy mechanism and is
trained with the same hyperparameters as the graph-to-text model.
6.2 E XPERIMENTAL S ETUP
We construct a graph for each route as described above. On average there are 144 nodes in a graph
and 3.4 edges per node. There are 8 different node types and a vocabulary of 3791 node tokens. The
hyperparameter for the graph-to-text architecture are set as follows. The model size is set to 256.
We use six encoder and decoder layers with eight attention heads. Cross entropy loss is optimized
by Adam (Kingma & Ba, 2015) with a learning rate of 0.5 and batch size of 12. The embedding
matrix for node tokens and output tokens is shared. Additionally we experiment with pretraining the
graph-to-text model with above mentioned rule based instructions as target. This teaches the model
sequentiality of route nodes and basic interpretation of the angle labels. We generate 20k instances
for pretraining and further fine tune on the human generated instances. Both models and the seq2seq
7Under review as a conference paper at ICLR 2021
reference: At the light with Fridays on the corner, turn right. Continue down the long street to the next light with Nine West on the right
corner, then turn left. Go to the next light with Brooks Brothers on the right corner, then turn right and stop.
rule based: Starbucks Coffee left subway entrance right Best Buy Mobile left Yankees right bus stop left bus stop left light right The
Michelangelo left TGI Fridays left Pizza Hut left Bobby Van ’s left park right Men ’s Wearhouse left fountain left fountain left subway entrance
left light left Nine West right Rockefeller Center left subway entrance right Brooks Brothers right light right stop
seq2seq: Go straight to the light and make a left. Go straight to the next light and make a left. Go straight to the light and make a right. Stop
one step after turning with Brooks Brothers to your right.
graph2text: Walk to the light with TGI Fridays on the corner and turn right. Walk down the long block to the next light with Nine West on the
left corner, then turn left. Walk to the next light with Brooks Brothers on the far right corner, then turn right.
g2t+pretrain: Turn right at the first set of lights with TGI Fridays on the left corner. Pass a park on the right and turn left at the lights. Pass
the fountain on the right and turn right at the lights. Take two steps and stop. Brooks Brothers is on the right corner.
Figure 4: Route from partially seen test set paired with instructions generated by different systems.
Test Unseen Test Partially Seen
BLEU↑ Landmarks Time↓ ED↓ nDTW↑ SR@25↑ SR@50↑ BLEU↑ Landmarks Time↓ ED↓ nDTW↑ SR@25↑ SR@50↑
200 instances test sets
reference - 2.68 - .112 .770 82.4 86.3 - 2.76 - .132 .769 85.5 91.0
rule based 0.67 10.96 55 .138 .694 47.5 69.0 0.71 12.44 53 .119 .611 41.0 59.0
seq2seq 11.12 1.58 39 .194 .206 7.0 15.0 13.12 1.95 48 .133 .267 14.0 20.0
graph2text 14.07 1.74 41 .123 .495 27.5 47.0 18.60 2.41 43 .115 .607 36.0 61.5
g2t+pretrain 15.64 2.33 44 .147 .506 32.7 51.7 18.81 2.44 48 .123 .607 41.0 58.5
700 instances test sets
reference - 2.69 - .126 .780 84.3 88.9 - 2.72 - .139 .768 86.1 91.0
g2t+pretrain 16.27 2.30 40 .136 .541 36.6 55.7 17.39 2.41 42 .133 .590 41.9 61.7
Table 3: Evaluation of landmark navigation instructions produced by models versus human reference
on unseen and partially seen test routes. The smaller test sets are subsets of the larger ones. For an
explanation of evaluation metrics see Section 6.3.
baseline are trained on 5667 instances of our dataset. The best weights for each model are selected
by token accuracy based early stopping on the 605 development instances.
6.3 E VALUATION M ETRICS
BLEU is a token overlap score and in this work calculated with SacreBLEU (Post, 2018) on lower-
cased and tokenized text. #Landmarks is the number of landmark occurrences per instance. Occur-
rences are identified by (sequence of) token overlap between navigation text and tag values of points
of interest along the route. For example, the count for the instructions in Figure 1 is four: Dunkin’
Donuts, Bubble Tea & Crepes, Chipotle and Broadway Plaza Hotel. Time reports the median time
in seconds a human annotator needs for a successful navigation run. ED is the length normalized
edit distance between the reference sequence of nodes from start to end location, and the traversed
nodes by the human annotator. It is computed as the average over all navigation runs that end within
a radius of 25 meters around the goal location. A lower score means annotators found the goal
location with less detour. nDTW is the normalized Dynamic Time Warping metric (Ilharco et al.,
2019). Distance between two nodes is defined as meters along the shortest path between them and
threshold distance is 25 meters. SR@25 (50) is the first try success rate in the navigation run task.
Success is achieved if the human navigator stops within a radius of 25 (50) meters around the goal.
6.4 E XPERIMENTAL R ESULTS AND A NALYSIS
Results of our experimental evaluation are shown in Table 3. We evaluate our model on unseen data,
i.e., routes without any overlap with routes in the training set, and on partially seen data, i.e., routes
8Under review as a conference paper at ICLR 2021
randomly sampled from the training area with partial overlaps.7 For the baseline models we perform
the human evaluation on a 200 instances subset of each test set. The regular test sets include 700
instances each.
On the latter test set, the graph-to-text models produce nearly as many landmarks as human refer-
ence instructions. The pretraining elevates the success rate of human navigation based on system-
generated instructions to roughly 50% of that of navigation on human-generated instructions and on
par with the rule based system. The results show that the instructions generated by the rule based
system are exact by including all possible landmarks, thus they yield a high success rate, but they do
not resemble natural language and high evaluation time suggests that they are hard to read. When
evaluating the graph-to-text models on unseen parts of the map, the number of landmarks produced
drops significantly without pretraining. The success rate falls below the rule based baseline which
reveals shortcomings in adopting to unseen areas. Despite moderate BLEU scores and reasonable
amount of produced landmarks, the sequence-to-sequence baseline fails to generate useful naviga-
tion instructions. An interesting observation is that BLEU scores of the trained systems correlate
with their navigation success rate.
Test Unseen Test Partially Seen
Reference Model Reference Model
Top OSM tag Score OSM tag Score OSM tag Score OSM tag Score
1 amenity: cinema 0.58 cuisine: juice 0.64 amenity: bank 0.41 amenity: pharmacy 0.39
2 shop: wine 0.53 amenity: pharmacy 0.55 leisure: park 0.35 shop: furniture 0.38
3 shop: computer 0.53 shop: convenience 0.50 amenity: pharmacy 0.32 amenity: bank 0.37
4 amenity: pharmacy 0.51 amenity: cinema 0.46 shop: furniture 0.30 leisure: garden 0.29
5 cuisine: coffee shop 0.49 cuisine: coffee shop 0.46 cuisine: burger 0.29 cuisine: burger 0.28
6 tourism: hotel 0.44 shop: computer 0.45 leisure: garden 0.29 shop: supermarket 0.25
7 shop: convenience 0.42 tourism: hotel 0.41 cuisine: coffee shop 0.26 cuisine: coffee shop 0.25
8 shop: houseware 0.31 shop: pet 0.39 amenity: place of worship 0.25 cuisine: american 0.24
9 shop: supermarket 0.31 shop: beauty 0.38 cuisine: american 0.23 shop: convenience 0.22
10 amenity: bank 0.28 shop: wine 0.38 amenity: bicycle rental 0.23 cuisine: italian 0.21
Table 4: Frequency of OSM tags of landmark occurrences in the instructions, normalized by the
number of occurrences in the input graph.
Table 4 presents a scoring of types of landmarks produced by our pretrained model. A compari-
son of landmarks produced in human-generated reference instructions to those produced in model-
generated instructions shows a large overlap on partially seen data, and ranking is similar to hand-
crafted salient scores used in work in geo-informatics (Rousell & Zipf, 2017). The distribution of
landmarks in the unseen test data is different from the partially seen data. To some extent, the model
is able to adapt to the unseen environment.
An example output for each system together with the input map is shown in Figure 4. The seq2seq
baseline generates navigation instructions that sound human-like and also include landmarks found
on the map. However, the directions are incorrect and unusable for navigation. The graph-to-text
based models get the directions right while producing fluent natural language sentences. They in-
clude landmarks at the correct sequential position but sometimes in incorrect orientation. Depending
on the redundancy in the instructions this can lead to an unsuccessful navigation run. Further quali-
tative evaluation of instructions generated by the graph-to-text models (in the Appendix) shows that
intersections are added or dropped when the route has too many turns or turns in quick succession.
7 C ONCLUSION
We presented a dataset and suitable graph-to-text architecture to generate landmark navigation in-
structions in natural language from OpenStreetMap geographical data. Our neural model includes
novel aspects such as a graphical representation of a route using angle labels. Our dataset consists of
a few thousand navigation instructions that are verified for successful human navigation. The dataset
is large enough to train a neural model to produce navigation instructions that are very similar in
several aspects to human-generated instructions on partially seen test data. However, performance
naturally drops on unseen data including new types of landmarks in new combinations.
7
The data split on the map of lower Manhattan is shown in the Appendix.
9Under review as a conference paper at ICLR 2021
R EFERENCES
Peter Anderson, Qi Wu, Damien Teney, Jake Bruce, Mark Johnson, Niko Sünderhauf, Ian Reid,
Stephen Gould, and Anton van den Hengel. Vision-and-language navigation: Interpreting
visually-grounded navigation instructions in real environments. In Proceedings of the IEEE Con-
ference on Computer Vision and Pattern Recognition (CVPR), June 2018.
Amanda Cercas Curry, Dimitra Gkatzia, and Verena Rieser. Generating and evaluating landmark-
based navigation instructions in virtual environments. In Proceedings of the 15th European
Workshop on Natural Language Generation (ENLG), pp. 90–94, Brighton, UK, September
2015. Association for Computational Linguistics. doi: 10.18653/v1/W15-4715. URL https:
//www.aclweb.org/anthology/W15-4715.
H. Chen, A. Suhr, D. Misra, N. Snavely, and Y. Artzi. Touchdown: Natural language navigation
and spatial reasoning in visual street environments. In 2019 IEEE/CVF Conference on Computer
Vision and Pattern Recognition (CVPR), pp. 12530–12539, 2019.
Andrea F. Daniele, Mohit Bansal, and Matthew R. Walter. Navigational instruction generation as in-
verse reinforcement learning with neural machine translation. 2017 12th ACM/IEEE International
Conference on Human-Robot Interaction (HRI, pp. 109–118, 2017.
Harm de Vries, Kurt Shuster, Dhruv Batra, Devi Parikh, Jason Weston, and Douwe Kiela. Talk the
walk: Navigating new york city through grounded dialogue. CoRR, abs/1807.03367, 2018. URL
http://arxiv.org/abs/1807.03367.
Jacob Devlin, Ming-Wei Chang, Kenton Lee, and Kristina Toutanova. BERT: Pre-training of deep
bidirectional transformers for language understanding. In Proceedings of the 2019 Conference of
the North American Chapter of the Association for Computational Linguistics: Human Language
Technologies, Volume 1 (Long and Short Papers), pp. 4171–4186, Minneapolis, Minnesota, June
2019. Association for Computational Linguistics. doi: 10.18653/v1/N19-1423. URL https:
//www.aclweb.org/anthology/N19-1423.
Markus Dräger and Alexander Koller. Generation of landmark-based navigation instructions from
open-source data. In Proceedings of the 13th Conference of the European Chapter of the Associ-
ation for Computational Linguistics, pp. 757–766, Avignon, France, April 2012. Association for
Computational Linguistics. URL https://www.aclweb.org/anthology/E12-1077.
Daniel Fried, Ronghang Hu, Volkan Cirik, Anna Rohrbach, Jacob Andreas, Louis-
Philippe Morency, Taylor Berg-Kirkpatrick, Kate Saenko, Dan Klein, and Trevor Dar-
rell. Speaker-follower models for vision-and-language navigation. In S. Bengio, H. Wal-
lach, H. Larochelle, K. Grauman, N. Cesa-Bianchi, and R. Garnett (eds.), Advances
in Neural Information Processing Systems, volume 31, pp. 3314–3325. Curran Asso-
ciates, Inc., 2018. URL https://proceedings.neurips.cc/paper/2018/file/
6a81681a7af700c6385d36577ebec359-Paper.pdf.
Karl Moritz Hermann, Mateusz Malinowski, Piotr Mirowski, Andras Banki-Horvath, Keith Ander-
son, and Raia Hadsell. Learning to follow directions in street view. CoRR, abs/1903.00401, 2019.
URL http://arxiv.org/abs/1903.00401.
Gabriel Ilharco, Vihan Jain, Alexander Ku, Eugene Ie, and Jason Baldridge. Effective and general
evaluation for instruction conditioned navigation using dynamic time warping. NeurIPS Visually
Grounded Interaction and Language Workshop, 2019.
Diederik P. Kingma and Jimmy Ba. Adam: A method for stochastic optimization. In ICLR (Poster),
2015. URL http://arxiv.org/abs/1412.6980.
Alexander Ku, Peter Anderson, Roma Patel, Eugene Ie, and Jason Baldridge. Room-Across-Room:
Multilingual vision-and-language navigation with dense spatiotemporal grounding. In Conference
on Empirical Methods for Natural Language Processing (EMNLP), 2020.
Matt MacMahon, Brian Stankiewicz, and Benjamin Kuipers. Walk the talk: Connecting language,
knowledge, and action in route instructions. In Proceedings of the 21st National Conference
on Artificial Intelligence - Volume 2, AAAI’06, pp. 1475–1482. AAAI Press, 2006. ISBN
9781577352815.
10Under review as a conference paper at ICLR 2021
Piotr Mirowski, Matt Grimes, Mateusz Malinowski, Karl Moritz Hermann, Keith Anderson, Denis
Teplyashin, Karen Simonyan, koray kavukcuoglu, Andrew Zisserman, and Raia Hadsell. Learn-
ing to navigate in cities without a map. In S. Bengio, H. Wallach, H. Larochelle, K. Grauman,
N. Cesa-Bianchi, and R. Garnett (eds.), Advances in Neural Information Processing Systems 31,
pp. 2419–2430. Curran Associates, Inc., 2018. URL http://papers.nips.cc/paper/
7509-learning-to-navigate-in-cities-without-a-map.pdf.
Matt Post. A call for clarity in reporting BLEU scores. In Proceedings of the Third Conference
on Machine Translation: Research Papers, pp. 186–191, Belgium, Brussels, October 2018. As-
sociation for Computational Linguistics. URL https://www.aclweb.org/anthology/
W18-6319.
Adam Rousell and Alexander Zipf. Towards a landmark-based pedestrian navigation service using
osm data. ISPRS International Journal of Geo-Information, 6(3):64, Feb 2017. ISSN 2220-9964.
doi: 10.3390/ijgi6030064. URL http://dx.doi.org/10.3390/ijgi6030064.
Michael Schlichtkrull, Thomas N. Kipf, Peter Bloem, Rianne van den Berg, Ivan Titov, and Max
Welling. Modeling relational data with graph convolutional networks. In Aldo Gangemi, Roberto
Navigli, Maria-Esther Vidal, Pascal Hitzler, Raphaël Troncy, Laura Hollink, Anna Tordai, and
Mehwish Alam (eds.), The Semantic Web, pp. 593–607, Cham, 2018. Springer International Pub-
lishing. ISBN 978-3-319-93417-4.
Abigail See, Peter J. Liu, and Christopher D. Manning. Get to the point: Summarization with
pointer-generator networks. In Proceedings of the 55th Annual Meeting of the Association for
Computational Linguistics (Volume 1: Long Papers), pp. 1073–1083, Vancouver, Canada, July
2017. Association for Computational Linguistics. doi: 10.18653/v1/P17-1099. URL https:
//www.aclweb.org/anthology/P17-1099.
Arun Balajee Vasudevan, Dengxin Dai, and Luc Van Gool. Talk2nav: Long-range vision-and-
language navigation with dual attention and spatial memory, 2020.
Ashish Vaswani, Noam Shazeer, Niki Parmar, Jakob Uszkoreit, Llion Jones, Aidan N Gomez,
Ł ukasz Kaiser, and Illia Polosukhin. Attention is all you need. In I. Guyon, U. V. Luxburg,
S. Bengio, H. Wallach, R. Fergus, S. Vishwanathan, and R. Garnett (eds.), Advances in Neu-
ral Information Processing Systems 30, pp. 5998–6008. Curran Associates, Inc., 2017. URL
http://papers.nips.cc/paper/7181-attention-is-all-you-need.pdf.
Petar Veličković, Guillem Cucurull, Arantxa Casanova, Adriana Romero, Pietro Liò, and Yoshua
Bengio. Graph attention networks. In International Conference on Learning Representations,
2018. URL https://openreview.net/forum?id=rJXMpikCZ.
11You can also read