Construction of a high-density genetic map for hexaploid kiwifruit (Actinidia chinensis var. deliciosa) using genotyping by sequencing
←
→
Page content transcription
If your browser does not render page correctly, please read the page content below
2
                                                                                                                                   G3, 2021, 11(7), jkab142
                                                                                                                         DOI: 10.1093/g3journal/jkab142
                                                                                                              Advance Access Publication Date: 1 May 2021
                                                                                                                                            Genome Report

Construction of a high-density genetic map for hexaploid
kiwifruit (Actinidia chinensis var. deliciosa) using
genotyping by sequencing
                     ,1,† Susan J. Thomson,2,† Mareike Knäbel,3,† Jibran Tahir,4 Ross N. Crowhurst,4 Marcus Davy,1,†

                                                                                                                                                                Downloaded from https://academic.oup.com/g3journal/article/11/7/jkab142/6261761 by guest on 19 November 2021
Elizabeth Popowski
Toshi M. Foster, Robert J. Schaffer,5,6 D. Stuart Tustin,7 Andrew C. Allan,4,6 John McCallum,2 and David Chagné3,†,*
                5

1
  The New Zealand Institute for Plant and Food Research Ltd (Plant & Food Research), Te Puke, New Zealand,
2
  Plant & Food Research, Lincoln, New Zealand,
3
  Plant & Food Research, Palmerston North, New Zealand,
4
  Plant & Food Research, Auckland, New Zealand,
5
  Plant & Food Research, Motueka, New Zealand,
6
  School of Biological Sciences, University of Auckland, Auckland, New Zealand and
7
  Plant & Food Research, Havelock North, New Zealand

*Corresponding author: Plant and Food Research, Food Industry Science Centre, Fitzherbert Science Centre, Batchelar Road, Palmerston North 4410, New Zealand.
Email: David.Chagne@plantandfood.co.nz

†
    These authors contributed equally to this work.

Abstract
Commercially grown kiwifruit (genus Actinidia) are generally of two sub-species which have a base haploid genome of 29 chromosomes.
The yellow-fleshed Actinidia chinensis var. chinensis, is either diploid (2n ¼ 2x ¼ 58) or tetraploid (2n ¼ 4x ¼ 116) and the green-fleshed cul-
tivar A. chinensis var. deliciosa “Hayward,” is hexaploid (2n ¼ 6x ¼ 174). Advances in breeding green kiwifruit could be greatly sped up by
the use of molecular resources for more efficient and faster selection, for example using marker-assisted selection (MAS). The key genetic
marker that has been implemented for MAS in hexaploid kiwifruit is for gender testing. The limited marker-trait association has been
reported for other polyploid kiwifruit for fruit and production traits. We have constructed a high-density linkage map for hexaploid green ki-
wifruit using genotyping-by-sequence (GBS). The linkage map obtained consists of 3686 and 3940 markers organized in 183 and 176 link-
age groups for the female and male parents, respectively. Both parental linkage maps are co-linear with the A. chinensis “Red5” reference
genome of kiwifruit. The linkage map was then used for quantitative trait locus (QTL) mapping, and successfully identified QTLs for king
flower number, fruit number and weight, dry matter accumulation, and storage firmness. These are the first QTLs to be reported and dis-
covered for complex traits in hexaploid kiwifruit.

Keywords: polyploid; SNP markers; linkage mapping; QTLs; Ericaceae

Introduction                                                                       fleshed kiwifruit) from the New Zealand breeding program are
                                                                                   hexaploid with six sets of 29 chromosomes (2n ¼ 6x ¼ 174)
Originating in China and Southeast Asia, kiwifruit (genus
                                                                                   (Watanabe et al. 1990).
Actinidia) has been described as a woody, perennial, deciduous
vine, producing cylindrical fleshy fruit (Schmid 1978). In the last                   Polyploid species can be classified as allo- and autopolyploid.
60 years, kiwifruit has become the largest horticultural export                    An allopolyploid is described as being comprised of sub-genomes
item for New Zealand (Ferguson 2004) generating NZD$2.3 billion                    originating from multiple related species and displaying chromo-
in exports in 2019 (https://www.freshfacts.co.nz/). The two most                   somal preferential pairing during meiosis. Notable allopolyploid
commonly exported species are Actinidia chinensis var. deliciosa                   crop species include hexaploid bread wheat (Triticum aestivum)
and A. chinensis var. chinensis. Outside of China, the main A. chi-                and tetraploid canola (Brassica napus). By contrast, an autopoly-
nensis var. deliciosa cultivar is green-fleshed “Hayward,” account-                ploid is created during a genome duplication event and in general
ing for 80% of global kiwifruit production (Ferguson 2015). The                    does not display preferential chromosome pairing. An analysis of
genus Actinidia is very diverse in terms of morphological and                      A. chinensis var. deliciosa using restricted fragment length poly-
genetic variation (Ferguson and Huang 2007). Naturally occurring                   morphism (RFLP) markers proposed A. chinensis var. chinensis as
ploidy levels are diploid, tetraploid, hexaploid, and octoploid                    one progenitor for hexaploid kiwifruit (Atkinson et al. 1997).
(Guijun et al. 1994). The A. chinensis var. deliciosa genotypes (green-            However, additional progenitors contributing to at least two sets

Received: February 11, 2021. Accepted: March 07, 2021
C The Author(s) 2021. Published by Oxford University Press on behalf of Genetics Society of America.
V
This is an Open Access article distributed under the terms of the Creative Commons Attribution License (http://creativecommons.org/licenses/by/4.0/), which
permits unrestricted reuse, distribution, and reproduction in any medium, provided the original work is properly cited.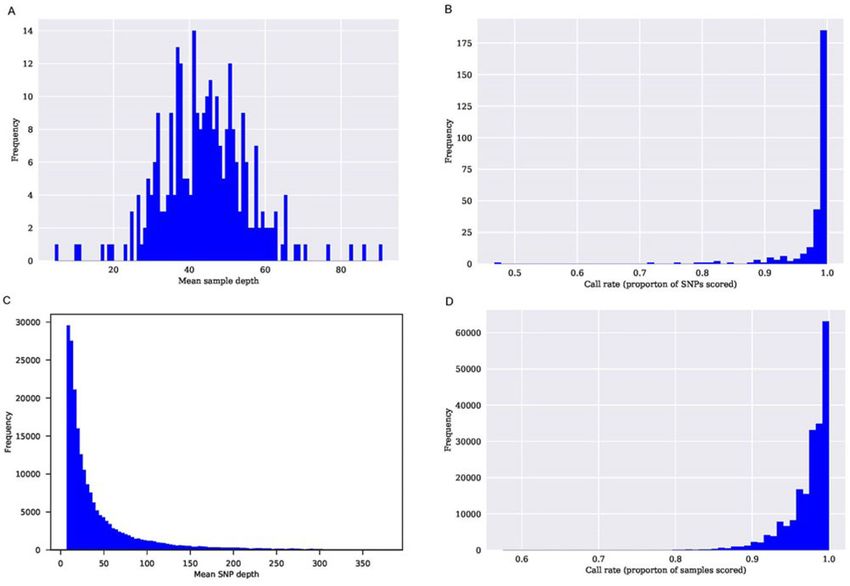
2   |   G3, 2021, Vol. 11, No. 7

of homologs are unknown. Microsatellite markers used to track                   The population was generated by germinating seedlings on
the inheritance of alleles in a hybrid population (A. chinensis var.         which MAS gender testing was performed (Gill et al. 1998) and
deliciosa crossed with A. chinensis var. eriantha) suggested there is        used to identify and reduce the male proportion prior to planting
no preferential pairing between the chromosome homologs                      in the orchard. Thousand one hundred and sixty-eight seedlings
(Mertten et al. 2012). Therefore, A. chinensis var. deliciosa could be       were planted across four different trial blocks at the Plant & Food
classified as an allopolyploid due to its homeologous sub-                   Research, Te Puke Research Center (Table 1) of which 86% of
genomes obtained from several species, but functionally pairing              these were female. Blocks 3 and 52 were planted at a density of
as an autopolyploid. Phenotypically, a significant increase in fruit         10 plants per 6 m bay, with 4 m between rows (4167 plants/Ha)
weight is observed as the ploidy level increases (Li et al. 2013).           while blocks 14 W and 35 were planted with 14 plants (seven
This has been confirmed with the genome doubling of diploid ki-              plants on each side of the row) at a density of seven plants in a
wifruit to autotetraploid using colchicine (Wu et al. 2012).                 6 m bay with a row spacing of 5 m (4667 plants/Ha). Males or
    Reference genome assemblies have been developed for diploid              unidentified gender plants were at a density of one in each bay to

                                                                                                                                                   Downloaded from https://academic.oup.com/g3journal/article/11/7/jkab142/6261761 by guest on 19 November 2021
A. chinensis var. chinensis (Huang et al. 2013; Pilkington et al. 2018;      ensure adequate pollination. Each seedling planted was a unique
Wu et al. 2019), A. eriantha (Tang et al. 2019), and A. rufa (Zhang          genotype.
et al. 2015). Both the A. eriantha and A. chinensis genome v3.0 (Wu
                                                                             Library preparation
et al. 2019) were based on long read sequencing technologies in-
corporating high-throughput chromatin capture (Hi-C) methodol-               For each individual, high molecular weight DNA was extracted
ogies with each genome assembly being assigned to the 29                     from approximately 100 mg of leaf tissue using a standard cetyl
pseudo-chromosomes. An assembly of a diploid A. chinensis selec-             trimethylammonium bromide (CTAB) protocol (Doyle 1987). The
tion (Pilkington et al. 2018), known as Red5, presents an improve-           GBS method of Elshire et al. (2011) was used to obtain reduced
                                                                             representation of the genomes for the two parents and 278 indi-
ment in terms of percentage of the assembly anchored to
                                                                             viduals of their progeny selected for displaying the extremes of
pseudo-chromosomes (only 6 Mb of the assembly were not
                                                                             king flower per winter bud production (high or low) with a small
assigned to chromosomes) and an improved gene annotation
                                                                             number of individuals showing a median king flower production.
compared to the first draft assembly obtained from the cultivar
                                                                             GBS libraries were developed using the ApeKI restriction enzyme
A. chinensis Hongyang: [164 Mb unassigned to chromosomes
                                                                             and set of 96 barcodes. Initial data were generated from GBS li-
(Huang et al. 2013)]. Linkage maps have been constructed for dip-
                                                                             braries from 96 individuals by Macrogen Ltd (https://dna.macro
loid Actinidia (Testolin et al. 2001; Fraser et al. 2009; Scaglione et al.
                                                                             gen.com/eng/), and additional data were generated for these indi-
2015; Liu et al. 2017) using a range of molecular markers including
                                                                             viduals as well as an additional 182 individuals by the Australian
amplified fragment length polymorphisms (AFLPs), simple se-
                                                                             Genome Research Facility (http://www.agrf.org.au/). Samples
quence repeats (SSRs), and genotyping by sequencing (GBS)
                                                                             were run on the Illumina HiSeq2000 (Illumina, San Diego, CA,
(Elshire et al. 2011). GBS has recently been the method of choice
                                                                             USA) generating 100 bp single-end sequences.
for building linkage maps in diploid kiwifruit, including RAD-seq
(Scaglione et al. 2015; Liu et al. 2017), GBS (Tahir et al. 2019), and       Sequencing data analysis
hybridization-based (Liu et al. 2016) approaches. The advantage
                                                                             Data were split by barcode using fastx-multx [ea-utils/1.1.2-806
of GBS is that this method can provide the sequence and haplo-
                                                                             (Aronesty 2013)], where barcode sequences were also trimmed
type data while generating the number of markers to sufficiently             using additional settings (-d 1 -b -m 0 -q 20). Restriction enzyme
saturate all the homologs from a complex ploidy species.                     sites were checked using fastq-multx. Adapter contamination
    Due to A. chinensis var. deliciosa requiring 3–5 years (Testolin         was removed using trim_galore 0.4.3 (https://www.bioinformat
et al. 2016) to establish a canopy before flower/fruit development           ics.babraham.ac.uk/projects/trim_galore/) with default settings
occurs, advances in breeding green kiwifruit are constrained by              but with “–stringency 5 –length 70.”
the long generation time. Marker-assisted selection (MAS) would                 After barcode splitting and trimming, samples with less than
facilitate a more efficient and faster selections, but the high              5,000,000 reads were excluded (one sample). Read counts ranged
ploidy makes this a considerable challenge with only dominant                from 6,641,209 to 22,517,489, with a mean of 13,140,809 and me-
traits such as gender testing (Gill et al. 1998) and the recently de-        dian of 12,437,289; parents were sequenced in triplicate with
veloped vitamin C marker being deployed (McCallum et al. 2019).              depths varying from 11,824,577 to 16,011,240 (Table 2).
The objective of this study was to construct a high-density link-               Reads were aligned to a pre-release version of the A. chinensis
age map for hexaploid green kiwifruit (A. chinensis var. deliciosa)          reference Version 2 using “Red5” (PS1.1.68.5, DOI10.5281/zen-
using GBS to allow more complex traits to be mapped and se-                  odo.1297303) using BWA-MEM v0.7.15 (Gurevich et al. 2013).
lected for using MAS in the future.                                          Alignment files were sorted and indexed with SAMtools 1.7 (Li
                                                                             et al. 2009) and Sample and Read Group IDs were appended to
                                                                             alignment files using Picardtools 2.10.1 (https://broadinstitute.
Materials and methods
                                                                             github.io/picard/).
Plant material
A F1 population from a bi-parental (A. chinensis var. deliciosa) cross       Variant calling and filtering
between a hexaploid female ZE and hexaploid male 28 was used                 Variants were called using Freebayes (Garrison and Marth 2012)
in this study (Supplementary Figure S1). Kiwifruit is dioecious,             with command line options “-p 6 -C 5 -k –min-mapping-quality
the male and female reproductive organs are on separate plants,              10 –genotype-qualities –use-mapping-quality.” Variants that
which promotes outcrossing (allogamy). The cross was com-                    were homozygous for one parent and heterozygous for the other
pleted in November 2007 with the seeds from the resulting ZE28               parent and estimated to be in one single dose (simplex  nulli-
family extracted in April 2008. To test the relatedness of the               plex segregation) based on the allelic ratios in each sample were
parents, the coefficient of coancestry (fXY) was calculated using            selected for further analysis. Raw variants were filtered using
the pedigree structure (Bernardo 2002) and fXY ¼ 0.                          Freebayes based on the proportion of individuals successfully
E. Popowski et al. | 3
Table 1 The total number of ZE28 seedlings planted and the subset of quantitative trait loci (QTL) analysis, including the transplanting
date, by the block, planting date, and number of females ($ ), males (# ), and unidentified-gender seedlings that were established at the
Plant and Food Research Site, Te Puke, New Zealand
Total planted QTL analysis Transplant date
Block Date # Planted #$ ## # Unidentified #$ ## # Unidentified Winter 2015 Winter 2016 Not transplanted
3 2009-12-09 100 90 10 0 1 3 0 0 4 0
14 W 2010-03-03 13 11 0 2 5 2 0 0 7 0
35 2009-12-08 510 468 42 0 110 4 7 87 0 34
52 2010-03-03 545 439 10 96 130 11 5 0 129 17
Total 1168 1008 62 98 246 20 12 87 140 51
Downloaded from https://academic.oup.com/g3journal/article/11/7/jkab142/6261761 by guest on 19 November 2021
Table 2 Summary of the read count range, median, mean, for the male parent 28, the female parent ZE and the ZE28 progeny with the
alignment rate, median, and mean
Group Read count Read count median Read count mean Alignment rate Alignment median Alignment mean
Parent 28 12933898–16011240 12933898 13771759 66.7–69.4 68.0 68.1
Parent ZE 11824577–14396284 12366343 12862401 70.1–84.5 82.2 79.0
All ZE28 progeny 6641209–22517490 12433689 12433690 52.7–93.8 75.1 76.0
scored (call rate > 0.7) and maximum read depth (DP) of 30,000 In evaluating seasons one, two, three, and four, the total num-
(Supplementary Table S1). ber of fruits per vine, the average fruit weight (total bulk fruit
weight/number of fruit weighed), and the dry matter content
Linkage map construction were measured on all fruit-bearing vines. King flowers per winter
Linkage maps for the six homologs of both parents and 29 chro- bud and fruit firmness following 12 weeks of storage were mea-
mosomes were constructed using simplex nulliplex markers sured in season four.
and using the double-pseudo test cross strategy (Grattapaglia Fruit dry matter content was measured by cutting one equato-
R
and Sederoff 1994) adapted to hexaploid. JoinMapV 3.0 (https:// rial slice of approximately 2 mm thickness and drying at 65 for
www.kyazma.nl/) was used to construct the LGs. Grouping of loci 24 hours. The fruit dry matter content was calculated from the fi-
was achieved with a minimum LOD (logarithm of the odds) score nal dry weight and initial wet weight of the slices, recorded as a
of 5 and regression mapping was used for map calculation using percentage of fresh weight. King flowers per winter bud were
the Kosambi mapping function. A first draft of the linkage map assessed in spring of the evaluation season as per the flowering
was developed and then manually checked for the presence of protocol described by Snelgar et al. (1997). Fruit firmness,
double recombinants, due to genotypic errors. During that pro- expressed as kilogram-force (kgf), was recorded 12 weeks post-
cess, genotypic calls that were anomalous and would have mis- harvest using a GUSS penetrometer with a 7.9 mm diameter
placed markers compared to their expected location within the probe traveling at a downward speed of 5 mm/s. Penetrometer
reference genome were manually corrected. The single nucleo- measurements were made on both the flat and round side of the
tide polymorphism (SNP) markers mapped onto the final linkage fruit, at 90-degree angles, and then averaged.
map were named according to their location in the reference A. For QTL detection, the traits were processed yearly (due to the
chinensis genome assembly of “Red5” (PS1.69.0) (Pilkington et al. climatic differences each season and the increase in the seedling
2018). GBS marker locations based on the read mapping done on maturity) and QTL detection with permutation tests were per-
version PS1.68.5 were converted to physical locations in the as- formed using MapQTL v5.0 (https://www.kyazma.nl/) and inter-
sembly version PS1.69.0 using custom perl scripts. val mapping. QTLs were declared significant if their LOD score
was above 3.
Collinearity of the genetic and physical maps and
genome-wide recombination rates Data availability
The markers identified through the construction of the linkage Raw DNA-seq reads are available at NCBI under BioProject num-
map were arranged by their genetic distance (in cM) and physical ber PRJNA721532. Genotypic data for both parents are presented
distance (in Mb) in R version 1.2.5042 using the xyplot function in in Supplementary Table S1. The phenotypic data used for QTL
the lattice library, grouped by each homolog. detection are presented, in the same order at the genotypic data,
in Supplementary Table S2. Supplementary Figure S1 contains
Phenotypic assessment and QTL mapping the pedigree structure of the ZE28 family. Supplementary mate-
Flowering and fruit attributes were measured from the ZE28 rial is available at figshare: https://doi.org/10.25387/g3.13218716.
seedlings in four different flowering/fruiting seasons The authors affirm that all data necessary for confirming the
(Supplementary Table S2). In the Southern Hemisphere, kiwifruit conclusions of the article are present within the article, figures,
flowers mature in November with fruit harvest conducted in and tables.
May. Season one encompassed flowering in November 2013
through fruit harvest in May 2014 and the storage fruit firmness
assessments in August 2014. Season two data were collected Results
from November 2014 through August 2015. November 2015 to Generation of a bi-parental A. deliciosa cross
August 2016 was defined as season three with season four being A large bi-parental cross containing 1168 seedlings that displayed
from November 2017 to August 2018. a wide distribution of yield characters was used in this study4 | G3, 2021, Vol. 11, No. 7
Table 3 Population averages for vine yield [fruit number, king flowers per winter bud, fruit weight (g)] and fruit quality [dry matter
content (%), fruit firmness 12 weeks postharvest (kgf)] traits in the hexaploid ZE28 population that had QTL analysis, compared to
Actinidia chinensis var. deliciosa “Hayward”
Trait Evaluation ZE28 Average Range Standard “Hayward” “Hayward” “Hayward” “Hayward”
season n deviation n average range standard
deviation
Fruit number 1 245 2.5 0–61 5.8 20 18.6 2–68 17.7
Fruit number 2 245 20.3 0–178 25.4 8 14.5 1–27 8.3
Fruit number 3 245 39.6 0–250 53.5 14 6.7 1–33 1.5
Fruit number 4 221 30.6 0–130 27.6 8 15.6 4–42 14.5
King flowers per winter bud 4 221 1.65 0–4.68 1.04 8 1.23 0.45–2.36 0.73
Fruit weight (g) 1 134 55.4 15.9–109.9 16.9 20 92.6 65.3–108.1 9.5
Fruit weight (g) 2 146 72.2 42.4–124.9 14.8 8 99.2 74.4–120.5 13.9
Downloaded from https://academic.oup.com/g3journal/article/11/7/jkab142/6261761 by guest on 19 November 2021
Fruit weight (g) 3 125 74.1 28.9–115.4 16.8 14 97.9 72.2–127.5 18.5
Fruit weight (g) 4 204 72.6 72.6–115.5 16.1 8 108.4 101.0–117.6 5.9
Dry matter content (%) 1 133 18.3 13.5–23.8 1.8 14 17.2 14.6–18.9 1.0
Dry matter content (%) 2 136 19.9 14.7–24.5 1.7 5 17.8 17.1–18.3 0.4
Dry matter content (%) 3 127 18.5 13.4–24.3 1.9 15 17.2 15.1–19.3 0.4
Fruit firmness, 12 weeks PH (kgf) 4 204 0.83 0.23–2.1 0.34 2 1.38 1.04–1.73 0.48
(Table 3). Of particular interest was the variation of numbers of occurring between markers positioned at small physical distance
king flowers per winter bud. In the pedigree structure, the male on the reference genome. After a manual correction of these
parent was an accession from China, while the female was from errors, there were 3686 and 3940 mapped SNP markers across 183
the fourth generation of crossing from an accession originally and 176 LGs in the female and male parents, respectively
imported into New Zealand. Both the female and male parents (Table 4, Figure 2 and Supplemental Figure S3, A and B). In the fe-
had inbreeding levels of 0 and so were unrelated to each other male ZE parent, the map spanned a total of 14,957 cM, with an
(coefficient of ancestry ¼ 0). From this population, 278 individu- average of 81.7 cM per LG, an average marker distance of 4.6 cM,
als were selected for genotyping based on the extremes (high and and a maximum distance between markers of 16.5 cM. For the
low) king flower production. male 28 parents, the map spanned a total of 10,869 cM with an
average LG length of 107.6 cM. The average distance between the
Sequencing data, SNP detection and filtering male parent markers was 5.8 cM, with the largest gap being 39
To select an appropriate restriction enzyme that provides a bal- cM. The marker content and order along the linkage groups (LGs)
ance between coverage depth and fragment length, an in silico di- were consistent with the Red5 genome assembly of A. chinensis,
gestion of the kiwifruit genome was modeled for 5 candidate as demonstrated by the high collinearity between the reference
restriction enzymes (Supplementary Figure S2). The ApeKI restric- genome and the LGs (Figure 3). On average, the female and male
tion enzyme was chosen for DNA fragmentation as it provided a linkage maps covered respectively 63.6% and 75.2% of the ge-
good spread of fragments and was methylation sensitive reducing nome assembly. The male linkage map was more saturated than
the frequency of repetitive DNA represented (Hilario et al. 2015). In the female map, with 25 out of the 29 chromosomes having six
total, 3.5 billion raw sequencing reads were obtained from GBS li- LGs, corresponding to the six expected homologs, and 119 out of
braries of triplicates of both parents and the 278 selected segregat- 176 LGs (67.6%) covering greater than 75% of the chromosome
ing full-sib individuals, and 74.6% of sequencing reads physical length based on the Red5 assembly (PS1.69.0). In the fe-
successfully aligned to the reference genome assembly of A. chi- male map, 17 of the 29 chromosomes had six homologs, and 89
nensis (Table 4). Ten sets of reads from the full sibling seedlings out of 183 LGs (48.6%) covered more than 75% of the chromo-
were ultimately removed due to low read counts and poor map- some length (Figure 2).
ping (E. Popowski et al. | 5
Table 4 Summary of the number of homologs identified per chromosome and the percentage of marker coverage across all
chromosome homologs identified in the linkage maps for the female and male hexaploid kiwifruit parents
Female Male
Chromosome Number of homologs % coverage Number of homologs % coverage
1 6 67.59 6 84.98
2 6 88.29 6 85.29
3 7 50.22 6 87.08
4 6 74.72 6 85.32
5 7 59.63 6 56.89
6 6 71.92 6 87.70
7 6 65.73 6 81.85
8 8 72.79 6 90.06
Downloaded from https://academic.oup.com/g3journal/article/11/7/jkab142/6261761 by guest on 19 November 2021
9 6 79.36 7 74.12
10 4 92.08 6 92.66
11 6 81.83 6 86.56
12 6 60.09 7 74.92
13 6 86.09 6 93.55
14 7 43.45 6 71.66
15 7 42.39 6 79.29
16 6 44.59 6 71.98
17 6 63.87 6 72.48
18 7 62.49 6 59.60
19 8 83.70 6 84.61
20 6 53.62 6 78.55
21 6 71.12 6 76.11
22 6 34.38 6 59.11
23 6 68.13 6 61.28
24 8 38.71 6 59.22
25 6 44.45 6 54.92
26 5 45.85 7 46.99
27 9 37.68 5 61.68
28 4 71.63 6 81.34
29 6 90.09 6 81.74
Total 183 63.67 176 75.23
selected genotyped population showed a spread of 0 to 4.68 king female vines when reporting a QTL for fruit size on chromosome
flowers with an average of 1.68. 6 explaining 41.8% of the variance. Beavis et al. (1994) illustrated
how mapping studies with 100 individuals were subjected to
QTL detection greatly inflated genetic estimates of QTL effect sizes. Our study
Nine QTLs were identified with LOD scores greater than 3.0 using 278 individuals provided QTLs with a lower explained vari-
across the four evaluation seasons, two from the female parent ance, which is probably better estimated than studies using
and seven from the male parent, for the following traits: the smaller progeny sizes. Yield attributes and their associated com-
number of king flowers per winter bud, fruit number, fruit weight ponents (plant height, branching types, root structures, and so
(g), dry matter content (%), fruit firmness 12-weeks post-harvest on) are known to be highly polygenic traits influenced by the en-
(Table 5). QTLs were inherited from both the female and male. vironment. This has been illustrated in multiple crops, with
The variance explained for these QTLs ranged between 5.6 and yield-associated QTLs previously published in tomato (Gur et al.
14.5%. Permutation tests conducted on the QTLs indicated two 2011), wheat (Maccaferri et al. 2008), barley (Von Korff et al. 2008),
were strong and the others were suggestive. and brassica (Shi et al. 2009). The fact that this linkage map was
able to identify QTLs for highly polygenetic traits (yield and fruit
firmness) illustrates its usefulness.
Discussion GBS, as a process, will have errors introduced at each step in
The study demonstrates that it is possible to identify QTLs in a the process, both in the laboratory as well as in the data process-
hexaploid population using a GBS approach. QTLs for king flow- ing. Challenges exist between differentiating what is an error and
ers per winter bud, dry matter content, fruit size, fruit number, what is an accurate sequence read. The most common errors in
and fruit firmness were discovered. These are the first QTLs to be reading the GBS data are missing genotype information due to
reported in hexaploid kiwifruit. QTL detection was possible be- low sequence read depth (Bilton et al. 2018) and making the dis-
cause the progeny size was sufficient for such analysis. It is well tinction between a real double crossover event or a false data
known that the ability to detect significant QTLs is based, among point (Cartwright et al. 2007). A manual process was decided to be
other things, on the population size (Beavis et al. 1994). The popu- appropriate to review the presence of double cross-over events by
lation size in previously published SNP-based diploid kiwifruit ge- taking into account the physical distances between markers. The
netic linkage maps ranged from 94 individuals (Scaglione et al. removal of genotyping errors masked as double crossover events
2015) to 230 individuals (Zhang et al. 2015; Tahir et al. 2019). Such improved the quality of the linkage map. However, in comparison
small population sizes may inflate the estimated QTL effect due to other map construction software (Bilton et al. 2018), JoinMap
to the Beavis effect (Xu 2003). Indeed Scaglione et al. (2015) recog- typically results in an expanded genetic linkage map as well as
nized the challenge of using a small progeny size of only 47 some incorrect marker identification/order.6 | G3, 2021, Vol. 11, No. 7
Downloaded from https://academic.oup.com/g3journal/article/11/7/jkab142/6261761 by guest on 19 November 2021
Figure 1 Statistics of SNP markers obtained by GBS in the hexaploid ZE28 kiwifruit segregating population; (A) frequency of mean sample depth, (B)
frequency of SNP call rate as a proportion of SNPs recorded, (C) frequency of mean SNP read depth, (D) frequency of call rate as a proportion of the
samples scored.
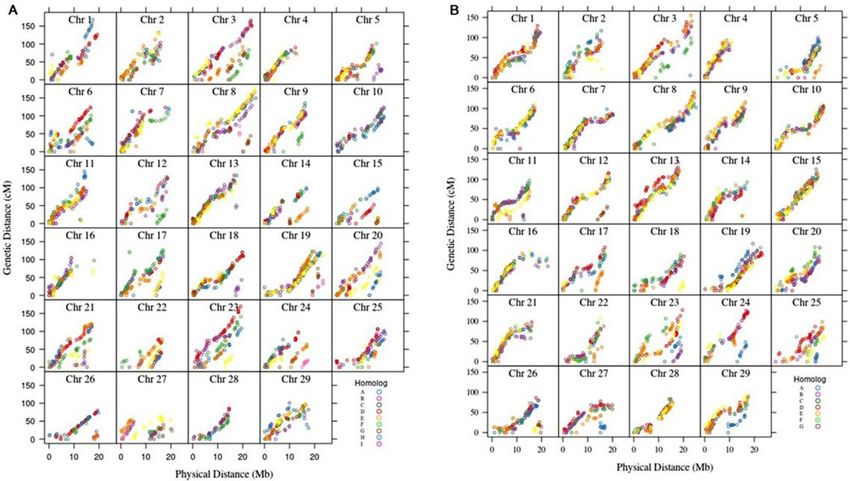
A linkage map was built for both parents of a hexaploid A. chi- monotonically increasing function, but there were exceptions on
nensis var. deliciosa population, using GBS and SNP markers segre- the distal ends of chromosome 6B, 8A, 21D, and 29B for the ZE
gating in a simplex nulliplex fashion. This is the first map for parent and all homologs of chromosome 16, and 2F for parent 28.
hexaploid kiwifruit and a new addition to maps for polyploid The slope of the plots is indicative of the recombination rates
Ericaceae species, as a linkage map of tetraploid blueberry was (Rezvoy et al. 2007). Outside the centromere location, which typi-
published (McCallum et al. 2016). Our linkage map produced a cally has lower rates of recombination, the recombination rates
similar density of markers compared to what is reported in previ- were appropriate for most homologs.
ous SNP and SSR-based maps of diploid kiwifruit (Liu et al. 2017) The strategy to use simplex nulliplex markers may explain
based on the average number of markers per LG (Testolin et al. the lack of full saturation for the ZE map as it may not be possi-
2001; Fraser et al. 2009; Scaglione et al. 2015). As this experiment ble to find such markers segregating for homologs that are fixed.
was a hexaploid progeny and simplex nulliplex markers were A potential solution for saturating the map would be to include
used for building LGs corresponding to homologs, it was encour- other types of marker segregation, such as duplex multiplex,
aging that markers were placed across all 29 chromosomes for simple simplex, and higher dosage ratios. However, it was
each parent. In total, 183 and 176 LGs were built for the female not possible to achieve this using this dataset because the read
and male parent, respectively. Theoretically, 174 (29 chromo- depth obtained (40X) was insufficient to accurately estimate the
somes 6 homologs) LGs were expected. The difference between allelic dosages in the progeny. As the linkage map is based on
the expected and obtained LG numbers can be attributed to the SNP markers aligned to the reference genome of kiwifruit, it was
number of generations of selection in the parents and the inabil- possible to obtain an indication of how much of the genome was
ity to get full map saturation along each homolog. The female covered by markers. Again, the female ZE map is less saturated
parent ZE has had more selection pressure than the male parent than the male 28 maps, possibly because of a higher selection
28 and has a larger number of LGs, including some chromosomes pressure or higher homozygosity between homologs in the fe-
for which up to nine LGs were built. The nine LGs may be a result male. The male linkage map is well saturated with only four
of incomplete coverage of a single homolog resulting in two chromosomes for which the number of LGs is not equal to six.
homologs of unknown order. Future directions would include integrating the dosage effects
The plots of the genetic and physical maps (Figure 3) indicate as reported in chrysanthemum and potato (Hackett et al. 2013;
the markers placed on the physical map were effective. An ac- van Geest et al. 2017) by using other genotyping technologies
ceptable plot is where the markers are defined by a monotoni- such as SNP arrays or hybridization-based sequencing technol-
cally increasing function. Most of the homologs fit the ogy. These technologies are capable of more accurate allelicE. Popowski et al. | 7
Downloaded from https://academic.oup.com/g3journal/article/11/7/jkab142/6261761 by guest on 19 November 2021
Figure 2 Schematic of the marker coverage in the linkage map for the chromosome homologs from the ZE female and 28 male parents comprising the
ZE28 segregating seedling population.8 | G3, 2021, Vol. 11, No. 7
Downloaded from https://academic.oup.com/g3journal/article/11/7/jkab142/6261761 by guest on 19 November 2021
Figure 3 Alignment of the genetic and physical maps obtained from the hexaploid kiwifruit genotyping by sequence (GBS) dataset. (A) ZE female and (B)
28 male parent. Each dot represents the genetic distance (cM) and physical distances (Mb) for an identified marker across the 29 chromosomes. The
different homologs for each chromosome are represented by a unique color within each chromosome panel. The slope of the homolog is representative
of the recombination rates.
Figure 4 Trait distribution for (A) king flowers per winter bud, (B) fruit number, (C) fruit weight (g), (D) dry matter content (%), and (E) fruit firmness (kgf)
across the four evaluation seasons in the ZE28 segregating population.E. Popowski et al. | 9
Table 5 Quantitative trait loci for yield and fruit traits in the hexaploid ZE28 mapping population
Trait Evaluation Linkage Closest Parent LOD Permutation Percent KW KW signifi-
season group marker (95% thresh- variance cance
old) explained levelsa
Fruit number 3 6D LG6:2142758 28 3.45 3.9 6.4 9.1 ****
Fruit number 3 20C LG20:15935274 28 3.10 3.9 5.8 10.04 ****
Fruit number 3 5C LG5:5184121 28 3.02 3.9 5.6 16.52 *******
King flowers per winter bud 4 20E LG20:11756985 28 3.26 4.0 6.5 11.2 *****
Fruit weight (g) 1 5F LG5:3333511 ZE 3.17 4.0 9.5 14.33 ******
Fruit weight (g) 1 13E LG13:74766 28 3.15 3.8 9.5 13.08 ******
Dry matter content (%) 1 24A LG24:16322191 28 3.21 3.9 10.3 14.74 ******
Dry matter content (%) 3 6D LG6:12592191 ZE 4.32 3.6 14.5 16.32 *******
Fruit firmness, 12-weeks postharvest (Kgf) 4 15B LG22:13315746 28 4.38 3.8 9.4 12.74 ******
Downloaded from https://academic.oup.com/g3journal/article/11/7/jkab142/6261761 by guest on 19 November 2021
Traits include fruit number count, king flowers per winter bud, fruit weight (g), dry matter content (%), and fruit firmness measured 12-week postharvest (kgf).
Year is the year of data collections, LG is the chromosome homolog where the quantitative trait locus (QTL) is located, closest marker denotes the marker location
nearest to the QTL based on the Pilkington et al. publication (Pilkington et al. 2018), parent identifies the male parent 28 or the female parent ZE, LOD is the
“logarithm of the odds” for the presence of a QTL at a particular location, the permutation (95% threshold) indicates the LOD when accounting for false positives,
percent variance explained is the contribution the QTL makes to the trait, KW is the Kruskal-Wallis one-way ANOVA on ranks.
a
KW significance levels: *10 | G3, 2021, Vol. 11, No. 7
Li D, Zhong C, Liu Y, Huang H. 2013. Correlation between ploidy level Shi J, Li R, Qiu D, Jiang C, Long Y, et al. 2009. Unraveling the complex
and fruit characters of the main kiwifruit cultivars in china: im- trait of crop yield with quantitative trait loci mapping in Brassica
plication for selection and improvement. NZ J Crop Hortic Sci. 41: napus. Genetics. 182:851–861.
252–252. Snelgar WP, Manson PJ, McPherson HG. 1997. Evaluating winter
Li H, Handsaker B, Wysoker A, Fennell T, Ruan J, et al. 2009. The se- chilling of kiwifruit using excised canes. J Hortic Sci. 72:305–315.
quence alignment/map format and samtools. Bioinformatics. 25: Tahir J, Hoyte S, Bassett H, Brendolise C, Chatterjee A, et al. 2019.
2078–2079. Multiple quantitative trait loci contribute to resistance to bacte-
Liu CY, Li DW, Zhou JH, Zhang Q, Tian H, et al. 2017. Construction of rial canker incited by Pseudomonas syringae pv. actinidiae in kiwi-
a SNP-based genetic linkage map for kiwifruit using next-genera- fruit (Actinidia chinensis). Hortic Res. 6:101.
tion restriction-site-associated DNA sequencing (radseq). Mol Tang W, Sun X, Yue J, Tang X, Jiao C, et al. 2019. Chromosome-scale
Breed. 37:1–7. genome assembly of kiwifruit actinidia eriantha with single-mo-
Liu CY, Zhang Q, Yao XH, Zhong CH, Yan CL, et al. 2016. lecule sequencing and chromatin interaction mapping.
Downloaded from https://academic.oup.com/g3journal/article/11/7/jkab142/6261761 by guest on 19 November 2021
Characterization of genome-wide simple sequence repeats and GigaScience. 8:giz027.
application in interspecific genetic map integration in kiwifruit. Testolin R, Huang H-W, Ferguson AR. 2016. The Kiwifruit Genome.
Tree Genet Genomes. 12:9.
Testolin, Raffaele, Huang, Hong-Wen, Ferguson, Ross (Eds.).
Maccaferri M, Sanguineti MC, Corneti S, Ortega JL, Salem MB, et al.
Springer.
2008. Quantitative trait loci for grain yield and adaptation of du-
Testolin R, Huang WG, Lain O, Messina R, Vecchione A, et al. 2001. A
rum wheat (Triticum durum desf.) across a wide range of water
kiwifruit (Actinidia spp.) linkage map based on microsatellites
availability. Genetics. 178:489–511.
and integrated with AFLP markers. Theor Appl Genet. 103:30–36.
McCallum J, Laing W, Bulley S, Thomson S, Catanach A, et al. 2019.
van Geest G, Bourke PM, Voorrips RE, Marasek-Ciolakowska A, Liao
Molecular characterisation of a supergene conditioning super--
YL, et al. 2017. An ultra-dense integrated linkage map for hexa-
high vitamin c in kiwifruit hybrids. Plants (Basel). 8:237.
ploid chrysanthemum enables multi-allelic QTL analysis. Theor
McCallum S, Graham J, Jorgensen L, Rowland LJ, Bassil NV, et al.
Appl Genet. 130:2527–2541.
2016. Construction of a SNP and SSR linkage map in autotetra-
Von Korff M, Grando S, Del Greco A, This D, Baum M, et al. 2008.
ploid blueberry using genotyping by sequencing. Mol Breed. 36.
Quantitative trait loci associated with adaptation to
Mertten D, Tsang GK, Manako KI, McNeilage MA, Datson PM. 2012.
Meiotic chromosome pairing in Actinidia chinensis var. deliciosa. Mediterranean Dryland conditions in barley. Theor Appl Genet.
Genetica. 140:455–462. 117:653–669.
Pilkington SM, Crowhurst R, Hilario E, Nardozza S, Fraser L, et al. Watanabe K, Takahashi B, Shirat K. 1990. Chromosome numbers in
2018. A manually annotated Actinidia chinensis var. chinensis (ki- kiwifruit (Actinidia deliciosa) and related species. Engei Gakkai
wifruit) genome highlights the challenges associated with draft Zasshi. 58:835–840.
genomes and gene prediction in plants. BMC Genomics. 19: Wu H, Ma T, Kang M, Ai F, Zhang J, et al. 2019. A high-quality Actinidia
257–257. chinensis (kiwifruit) genome. Hortic Res. 6:117.
Rezvoy C, Charif D, Guéguen L, Marais GA. 2007. Mareymap: an Wu JH, Ferguson AR, Murray BG, Jia YL, Datson PM, et al. 2012.
R-based tool with graphical interface for estimating recombina- Induced polyploidy dramatically increases the size and alters the
tion rates. Bioinformatics. 23:2188–2189. shape of fruit in Actinidia chinensis. Ann Bot. 109:169–179.
Scaglione D, Fornasiero A, Pinto C, Cattonaro F, Spadotto A, et al. Xu S. 2003. Theoretical basis of the Beavis effect. Genetics. 165:
2015. A rad-based linkage map of kiwifruit (Actinidia chinensis pl.) 2259–2268.
as a tool to improve the genome assembly and to scan the geno- Zhang Q, Liu CY, Liu YF, VanBuren R, Yao XH, et al. 2015.
mic region of the gender determinant for the marker-assisted High-density interspecific genetic maps of kiwifruit and the iden-
breeding. Tree Genet Genomes. 11. tification of sex-specific markers. DNA Res. 22:367–375.
Schmid R. 1978. Reproductive anatomy of Actinidia chinensis (actini-
diaceae). Bot Jahrb Syst. 100:149–195. Communicating editor R. K. DaweYou can also read