The Party is Over Here: Structure and Content in the 2010 Election
←
→
Page content transcription
If your browser does not render page correctly, please read the page content below
The Party is Over Here: Structure and Content in the 2010 Election
                Avishay Livne1, Matthew P. Simmons2, Eytan Adar1, 2, Lada A. Adamic1,2
                                     1
                                         Computer Science and Engineering, 2School of Information,
                                                   University of Michigan, Ann Arbor
                                                       Ann Arbor, MI, USA, 48109
                                            {avishay, mpsimmon, eadar, ladamic}@umich.edu

                          Abstract                                      victory, reflected the popularity of Twitter in political
  In this work, we study the use of Twitter by House, Senate            messaging. Today it seems as if every self-respecting
  and gubernatorial candidates during the midterm (2010)                campaign must have an online presence and the formula
  elections in the U.S. Our data includes almost 700                    for a successful online campaign is highly sought after.
  candidates and over 690k documents that they produced and
                                                                        Campaigners look for viral channels to garner supporters.
  cited in the 3.5 years leading to the elections. We utilize
  graph and text mining techniques to analyze differences               Notably, understanding how political social networks form
  between Democrats, Republicans and Tea Party candidates,              and communicate has broad implications not only within
  and suggest a novel use of language modeling for estimating           the political sphere but in the study of any network of
  content cohesiveness. Our findings show significant                   competing agents in which information is transferred. In
  differences in the usage patterns of social media, and
                                                                        2010, 22% of online adults used social networks or Twitter
  suggest conservative candidates used this medium more
  effectively, conveying a coherent message and maintaining             to engage with the election (Smith 2011).
  a dense graph of connections. Despite the lack of party                  In this work we investigate how the U.S. 2010 election
  leadership, we find Tea Party members display both                    campaigns were expressed on Twitter. We specifically
  structural and language-based cohesiveness. Finally, we               analyze over three years’ worth of tweets (over 460k) from
  investigate the relation between network structure, content
                                                                        687 candidates running for national House, Senate, or state
  and election results by creating a proof-of-concept model
  that predicts candidate victory with an accuracy of 88.0%.            governor seats. As tweets are limited in size (140
                                                                        characters) we augment our data by crawling nearly 233k
                      1. Introduction                                   outgoing links referred to by candidate tweets.
                                                                           In addition to observing the behavior of Republicans and
Much has been made of the importance of social media in
                                                                        Democrats, the two major political parties, we also pay
modern politics. Political parties and individual candidates
                                                                        particular attention to Tea Party members. Although not an
have come to regard their online presence as so
                                                                        official party, self-identified members of the conservative
fundamentally important that they have hired staff
                                                                        Tea Party have been the subject of significant analysis and
members to act as social media coordinators. The speed by
                                                                        discussion. By separating Tea Party candidates in analysis
which a candidate can now access voters has led to
                                                                        from their official party position we are able to analyze the
extreme sophistication in the use of these systems. Twitter,
                                                                        behaviors of this “virtual” party.
with its 190 million registered users, is a particularly
                                                                           Our methods of analysis include both text and graph
popular tool, allowing for rapid micro-blogged tweets
                                                                        mining techniques. We suggest a novel use of language
(status updates) to be fired off to any follower.
                                                                        modeling for estimating the coherency of each group and
   Recent successful use of social media as part of political
                                                                        the extremism of single candidates. We use graph analysis
campaigns, particularly in the 2008 U.S. Presidential
                                                                        to compare the density of each group as well as to compute
campaign of Barack Obama, had drawn both popular and
                                                                        various graph properties of individual candidates. Finally,
academic attention. Obama’s renowned tweet “We just
                                                                        we combine the results in order to build a model that
made history…” which was published shortly after his
                                                                        predicts whether a candidate is likely to be elected.
                                                                           Our contributions include a detailed analysis of the
Copyright © 2011, Association for the Advancement of Artificial
                                                                        social media behaviors of candidates in the 2010 midterm
Intelligence (www.aaai.org). All rights reserved.                       elections. We demonstrate a method for content-based,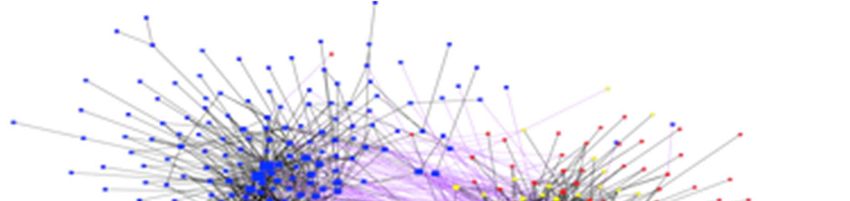
structural, and combined analysis of these candidates          features in our findings (e.g., increased messaging and
relative to each other and their parties as a whole. Using     density among conservatives), we concentrate our attention
these techniques we characterize the attributes of the         on candidates. By manually classifying tweets of
different parties, demonstrating high levels of structural     candidates one week before the 2010 election, Amman
and content coherence for conservative (Republican and         (2010) found that most messaging by Senate candidates
Tea Party) members. We further analyze how centrality in       was informational and does appear to have a relationship to
structure and content correlate with election outcomes         voter turnout.
(positively) by employing a prediction model.                     The use of Twitter as a “social sensor” for election
                                                               prediction has been applied in a number of recent studies.
                     2. Related Work                           Tumasjan et al. (2010) used chatter on Twitter to predict
Twitter Networks                                               the German federal election, finding the number of tweets
                                                               mentioning a political party to be almost as accurate as
The growing number of Twitter users, and the ease of
                                                               traditional polls in predicting election outcomes.
access to their tweets, makes Twitter a popular subject for
                                                               Diakopoulos and Shamma (2010) showed that tweets can
research in various research communities (Java et al.
                                                               be used to track real-time sentiment about a candidate’s
2007). Though most are about the general population of
                                                               performance during a televised debate. However, these
users, a number are relevant to political structures (e.g.,
                                                               previous analyses of political activity on Twitter did not
influence,     viral     marketing,     computer-mediated
                                                               specifically examine the candidates themselves, or the
communication, etc.). For example, Romero et al. (2010)
                                                               structure of their networks.
portrayed influential users, refuting the hypothesis that
users with many followers necessarily have bigger impact       Language Models and Graphs
on the community. Honeycutt and Herring (2009) showed          To model content we employ statistical Language Models
that Twitter often serves as a framework for discussions       (LM). Language models are statistical models in which
rather than for one-way communication. Another direction       probability is assigned to a sequence of words, thus
of study focused on commercial usage of Twitter (e.g.,         representing a language as a probability distribution over
viral marketing). Jansen et al. (2009) performed sentiment     terms. It was first used in speech recognition (Jelinek
analysis of tweets in that context (specifically targeting     1997) and machine translation (Brown et al. 1990). Ponte
products and brands). Our work here is informed by             and Croft (1998) were the first to apply LM to the task of
previous work on Twitter content and structure.                document ranking. Metzler et al. (2004) improved LM
Social Media and Politics                                      accuracy and (Song and Croft 1999) used smoothing to
                                                               tackle text sparseness.
While initially focused on blogs (Adamic and Glance,              The construction of user profiles can lead to better
2005) and Facebook (Williams and Gulati, 2008), the            results in information retrieval tasks such as web-search
analysis of social media in political contexts has since       (Sugiyama et al. 2004) and recommendation systems
transitioned to include Twitter. Broadly, work in the area     (Zhang & Koren 2007). Xue et al. 2009 used LM for
has focused on the analysis of the content and structure of    constructing user profiles to enhance search results.
elected political figures (e.g., members of Congress) or the   Similarly, Shmueli-Scheuer et al. (2010) described a
use of Twitter as a social sensor to predict elections.        distributed framework using Hadoop to construct LM-
   A number of studies (Golbeck et al. 2010; Glassman et       based user profiles (a technique we employ below).
al. 2010; Senak 2010), identified specific patterns of
tweeted communication between members of Congress and                                    3. Data
their constituents in terms of quantity and content type
(e.g., informational, fundraising, etc.). Sparks (2010)        The system described in this paper makes use of data
further analyzed partisan structure to identify groups with    crawled from Twitter. In order to build a fairly complete
ideological leanings. Though we note similar structural        list of candidate Twitter accounts we semi-automatically
                                                               generated this collection. For each candidate, we executed
                                                               a query on Google using their name and the keyword
                                                               “twitter” and retrieved the top 3 results from the
                                                               twitter.com domain. Each result was manually inspected
                                                               and filtered (e.g., fake accounts mocking the candidates
                                                               were removed), leaving only accounts that were operated
                                                               by the candidates or their staff. Our data spans 687 users—
                                                               339 Democrats and 348 Republicans. Of the 348
                                                               Republican candidates, 95 were further identified as Tea
      Figure 1. Daily (a) and hourly (b) volume of tweets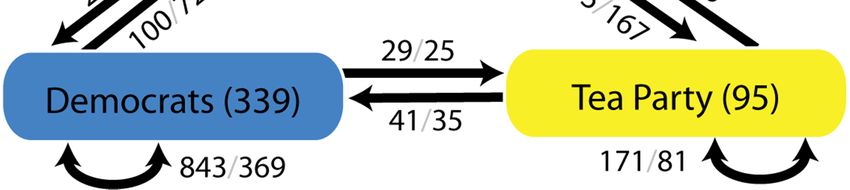
which eventually contributed 96% of the content to the
dataset (182,523,302 terms out of 190,290,041). We
filtered out stop words and extracted both unigram and bi-
gram terms. We found no significant difference when n-
grams of higher order were considered.
4. Methodology
In this work, we analyze two aspects of the data – the
content produced by the users and the structure of the
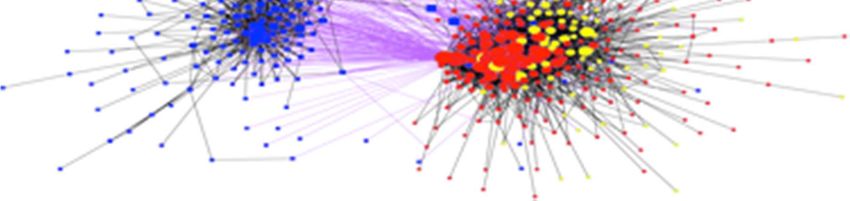
Figure 2. Plot of the candidate network (force-directed network formed by the follow-up edges. We start by
graph embedding layout modified to emphasize providing some theoretical background to our content
separation, nodes size proportional to indegree)
analysis methods.
User Profile Model
Notations
Our system consists of a set of candidates where each
candidate has a set of documents associated with her.
The entire corpus is denoted by ⋃∈ . Documents
are represented using the Bags of Words model where each
term ∈ is associated with its number of occurrences in
the document , . The vocabulary of the corpus is
Figure 3. Number of explicit follower edges and unique denoted by . Our model is based on the model;
@mention edges (follower / mention) therefore we make use of the document frequency of a
term and the inverse document frequency
Party candidates1. Note that notationally we exclude Tea log 1 ||/ . We denote the document frequency
Party candidates from the Republican set. When it is of a term in the set of user ’s documents by , .
interesting to analyze the inclusion or exclusion of Tea We also make use of , , ⁄ , the
Party candidates we employ the notation Rep+TP and Rep- maximum likelihood estimation of the probability to find
TP respectively. term in .
Using Twitter’s API, we downloaded 460,038 tweets for Term Weighting
candidate accounts dating back to March 25, 2007. Figure We set the initial weight of a term in a user LM to be
1 shows the number of tweets in the days (a) and hours (b) , , , ,
surrounding the Election Day. We see temporal patterns, as
where , ∑∈ೠ , / stands for the
less activity is observed during weekends and nights. As
average frequency of term in the collection . In
expected, the volume of tweets increases towards
addition, we calculate the marginal probability of ∈ in
November the 2nd, abruptly decreasing afterward.
the language model of the entire corpus as
The data include 84, 81 and 522 candidates from the
Senate elections, the gubernatorial elections and the
| , ,
Congressional elections respectively, covering about 50% These values are then normalized in order to obtain a
of the number of candidates in each of the races. We probability distribution over the terms.
crawled all the edges connecting users in our dataset. To | ,
identify social structures we consider a “follower | ∑ ; , ∑
∈ | ∈ ,
followed” relation as a directed edge going from the We then smooth the weights using the LM of the corpus,
follower to the followed user (identifying 4,429 such edges
| 1
,
|
between candidates in our pool).
To enrich the dataset we crawled the homepage of using a normalization factor of 0.001. Finally, we
candidates who maintained one and each of the valid URLs divide these values by their sum to normalize them.
that appeared in the tweets and considered them as |
| ∑
additional documents. Out of 351,926 URLs (186,000 ∈ |
distinct) 233,296 were valid pages (132,376 distinct), In a similar manner we constructed a LM-based profile
for the Democrat and Republican parties, as well as to the
1
The Tea Party classification was obtained from The New York Times group of Tea Party members. In order to compute the LM-
feature “Where Tea Party Candidates are Running,” October 14, 2010 based profile of a group ! we applied the same process
(nytimes.com/interactive/2010/10/15/us/politics/tea-party-graphic.html).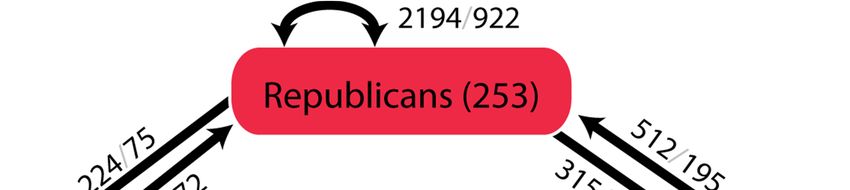
described above with the exception that the set of users’ and so has more possible edges. Figure 3 represents the
documents ௨ is replaced with ீ = ⋃௨∈ீ ௨ , the union of number of cross-party edges, for example we see 512
the documents of the users in the group. instances of a Republican being followed by a Tea Party
Content Analysis member. Consistent with Figure 2, the Republicans and
Tea Party members interact with one another more
We consider the content produced by a user to be the
frequently than either do with Democrats.
tweets that were produced by the user as well as the
content of the URLs that appear in his tweets. We assume Basic Content Analysis
that in the majority of the cases these cited pages represent Table 2 shows some statistics of the content produced by
a candidate’s opinion. In the discussion section we propose candidates in each party. Each value is the mean over the
a more delicate interpretation using sentiment analysis. users in that group.
In order to perform large scale analysis of the content we
constructed a LM-based profile for each user, as described Table 2. Mean Usage Patterns by Group
in the previous subsection. We apply the symmetric
version of the Kullback-Leibler (KL) divergence on two Democrat Rep-TP Tea Party
LM profiles to estimate the difference between the content tweets 551 723 901
of the two corresponding users. For two distributions ଵ tweets per day 2.66 2.97 5.21
and ଶ over the terms in the vocabulary ∈ , the retweets 40 52.3 82.6
symmetric KL divergence is defined as: replies 172.6 260.5 472.7
ௌ
log ଵ log ଶ
ଵ ||ଶ = ଵ + ଶ hashtags 196 404 753
log ଶ log ଵ hashtags per tweet 0.37 0.54 0.68
௧∈
We also used the (non-symmetric) KL divergence in
order to measure the contribution of single terms to the Of note are the high levels of tweets and tweets per day for
difference of one profile from another. Tea Party candidates and relatively higher levels of
Republicans over Democrats. We find the same
5. Results relationship (Tea Party > Rep-TP > Democrat) for retweets
Basic Structure Analysis (the rebroadcast of someone else’s message) and replies (a
response to someone’s tweet). These results indicate that
The network structure of the candidate graph is visualized
not only are conservative candidates more likely to
in Figure 2. Unsurprisingly, the Tea Party members are
“broadcast”, they are more likely to communicate with
fairly intertwined within the Republican subgraph. We also
each other. Finally, we note conservative candidates use
note the relative densities (higher for Republicans) of the
more hashtags, potentially to provide additional unity.
party substructures.
Hashtags—keywords/topics indicated with a “#”—are
This is further confirmed through an analysis of
frequently used by communities for grouping tweets to
subgraph density of edges within the same group. For a
create a Trending Topic to be highlighted by Twitter.
subgraph with N nodes and E edges, we utilize the density
definition of E/(N2-N), or the ratio between the number of Hashtag Use
actual edges and the number of possible edges. Since We took a closer look at the usage of hashtags by each of
density is sensitive to the size of the graph we considered the groups. Table 3 presents the top 5 hashtags used by
in-degree as well. each group along with their number of occurrences and the
number of unique users in the group that used this hashtag.
Table 1. Subgraph Density by Group The first part of the table shows the hashtags that were
used by the greatest number of unique users, while the
Democrat Rep-TP Rep+TP Tea Party second part shows the hashtags with most occurrences.
Density 0.007 0.032 0.025 0.020 It is somewhat surprising to find a conservative-related
In-degree 2.55 8.37 8.97 1.82 hashtag (tcot) as one of the top Democratic topics.
However, a closer inspection of these tweets reveals
Table 1 shows the calculated subgraph densities and mean negative information intentionally attached to this topic.
in-degree. We note that the Democratic network is sparser Such behavior is consistent with previous observations on
than the networks of Republicans and Tea Party members, the number of mentions of opposing entities in political
consistent with prior studies (Adamic & Glance 2005). networks (Adamic and Glance 2005). Interestingly, we
This difference in density holds even when we consider the find the health care reform (hcr), a topic under much
group of Republicans and Tea Party members (Rep+TP) debate, to be almost equally brought up by both
which has more candidates than the group of Democrats, Republicans and Democrats. A number of hashtags—ar02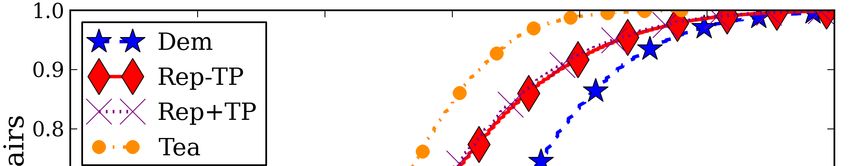
and alaska—were utilized by a small number of extremely          Democratic political figures such as Nancy Pelosi, Barney
active candidates to refer to specific elections (rather than    Frank, and Ellen Tauscher (generally in a negative
specific topics). Finally, we note the high levels of use of     context). The Republican profile consists mostly of terms
the Facebook (fb) tag produced automatically by programs         relating to the economy, such as spending, bills, budget,
cross-posting to the candidates’ Facebook pages.                 tax cuts, and the deficit, as well as various references to the
                                                                 Wall Street Journal. From a qualitative observation of
Table 3. Top Hashtags (# times used, unique users). p2           keywords, the Democratic profile seems to cover the
(Progressives 2.0); tcot (Top Conservatives on Twitter); nvsen   widest range of topics such as energy (clean energy, solar,
(Nevada Senator); fb (Facebook); hcr (Health Care Reform);
                                                                 renewable energy); education (education, school,
gop (Grand Old Party); nrcc (National Republican
Congressional Committee); ar02 (Arkansas District #2); ff        teachers); the oil spill (BP, oil spill); military (Afghanistan,
(FollowFriday); sgp (Smart Girls Politics).                      Iraq, military) and economics (e.g., jobs, health care
                                                                 reform, recovery act, and social security).
 Sorted by # unique candidates:
 Democrat          Rep-TP                 Tea Party                                   Table 4. Top Terms
 p2, 4564, 96      tcot, 13347, 169       tcot, 11482, 70
                                                                  Democrat          Rep-TP                       Tea Party
 hcr, 1176, 82     gop, 3929, 125         gop, 2262, 60
                                                                  education         spending                     barney_frank
 ff, 639, 80       hcr, 1772, 110         teaparty, 4419, 52
                                                                  jobs              bills                        conservative
 jobs, 427, 52     teaparty, 1706, 93     sgp, 1149, 38
                                                                  oil_spill         budget                       tea_party
 oilspill, 708, 45 ff, 1160, 81           ff, 1188, 32
                                                                  clean_energy      wsj (wall street journal)    clinton
 Sorted by mentions:
                                                                  afghanistan       bush                         nancy_pelosi
 p2, 4564, 96      tcot, 13347, 169       tcot, 11482, 70
                                                                  reform            deficit                      obamacare
 tcot, 3403, 38    gop, 3929, 125         teaparty, 4419, 52
 nvsen, 2471, 3 fb, 3882, 45              ar02, 3762, 2
 fb, 1232, 32      nrcc, 2091, 29         alaska,2372, 1         Content Cohesiveness
 hcr, 1176, 82     hcr, 1772, 110         gop, 2262, 60          To understand the cohesiveness of content amongst the
                                                                 different parties we apply we calculated the KL divergence
Profiles Review                                                  between every pair of candidates from the same party (i.e.,
Extending beyond simple content features, we employ the          determining how similar party members were to each
language model (LM) based profiles described above.              other). Figure 4 demonstrates the cumulative distribution
Table 4 provides a glimpse of some of the top terms in           of the pairwise distances. Intuitively, the more quickly the
each party’s profile (calculated as the marginal KL              cumulative distribution reaches 1, the more similar the
divergence of the term compared to the LM of the corpus).        profiles of users from this group are.
Note that the higher the marginal KL divergence of a term           It can be seen that the content of the Tea Party members
compared to the LM of the corpus, the more it contributes        is more homogenous compared to the rest of the
to differentiating a profile from the rest of the corpus. In     Republicans while the Democrats lag behind, indicating
other words, these terms serve best as features for              they produce heterogeneous content. This finding
identifying content produced by each party.                      correlates with a qualitative inspection of topics generated
   We found Tea Party members frequently mentioning              through topic modeling (Blei et al. 2003) where we found
                                                                 the profile of the Democratic Party covers a wider range of
                                                                 topics than the conservative groups. In addition, we see
                                                                 Tea Party members having a negligible effect on the LM of
                                                                 the Republican group as a whole. This can be explained by
                                                                 the relatively small number of Tea Party members and the
                                                                 similarity in the content attributed to these two groups.
                                                                 Content Distance versus Structural Distance
                                                                 We hypothesize that the closer two users are in graph
                                                                 distance, the more similar their content would be. This can,
                                                                 in part, be explained through models of homophily and
                                                                 social influence.
                                                                    To test this idea, we looked at every pair of candidates,
                                                                 calculating the shortest path in the network as well as the
               Figure 4. Pairwise KL divergence                  KL divergence in their language models. The results are
/ ∑௧∈ , where is the set of all nodes
reachable from and = ||. , denotes the
distance between and . In/out/all stands for
incoming, outgoing or all paths.
• HITS’ Authority score (Kleinberg et al. 1999) and
PageRank (Page et al. 1998) – measuring the relative
importance of a node in the graph.
• In/Out-degree – number of edges to/from the node.
• Incumbency – Boolean variable indicating whether the
candidate was incumbent or a challenger.
• KL-party/corpus – the KL-divergence between the LM
Figure 5. Mean pairwise KL divergence vs. pairwise of a user and the LM of his party/the entire corpus.
distance considering retweets (solid line) and ignoring • Party – indicating the political group a user belongs to
retweets (dashed line). The left (green) error margins (Democrat, Tea-Party or Republican).
describe the 10% and 90% percentiles of the data with
retweets, while the right (black) error margins stands for
• Same-party – indicating whether the party of the
the data without retweets. candidate is the same as the party that last held the seat.
• Tweets, hashtags, replies and retweets – basic statistics
depicted by the solid line in Figure 5, along with error bars of a candidate’s Twitter activity, as described above.
at the 10% and 90% percentiles. Note the significant For all the graph properties we considered the whole graph
increase in the KL divergence as the distance increases consisting of all the candidates (experiments using only
from one to three hops. The effect diminishes for distances edges from the candidates own party yielded diminished
greater than 3 steps. We found this phenomenon to be accuracy). We start by examining each variable
consistent for each of the political groups as well as for independently. Table 5 summarizes this set of experiments,
pairs of candidates from different parties. As we discuss showing each variable along with its coefficient, statistical
with further detail in Section 6, this could indicate the significance and the accuracy of the model. We measured
boundaries of micro-communities surrounding a minor accuracy using a 10-fold cross-validation evaluation.
issue or reflect a “radius of influence”–the distance to
which the content of a user is still influential. Table 5. Logistic Regression Model with Single Variables
Arguably, connected individuals are more likely to
retweet each other, increasing the similarity by copying Variable Estimate Prob(>|z|) Accuracy
content. To ensure that this was not a primary driver of same_party 2.67winning elections, as is well reflected in the results. races. Note that this is precisely .88 × .88, or the
Closeness-all and in-degree are also predictive as opposed probability of picking one winner and one loser correctly.
to closeness-out and out-degree, confirming that having This result could likely be improved using better models or
followers is more important than following others. machine learning schemes such as joint inference.
An interesting finding is that KL-corpus is significantly Our findings suggest that the Republican Party, which
more predictive than KL-party. The negative coefficient of made gains in the 2010 midterm election, succeeded in
these variables suggests that the more similar the LM of a running a strong social media campaign on Twitter. This
user to the LM of the party/corpus, the more likely she is to is consistent with the observations of Chittal (2010) and
be elected. We interpret this as meaning that focusing on Stewart (2010). This is indicated by several metrics. First,
centrist issues correlates more highly with winning than the Republicans formed a denser graph of followers, and
merely conforming to the agenda of one’s own party mentioned one another more often. Their tweets were also
(though both matter). Unsurprisingly, given Republicans’ more topically similar, judging by the similarity of their
success in gaining seats in 2010, the Republican variable is language models. The top terms in the language models
predictive of winning. Finally, we see that simple usage related to economic issues. In contrast, the network of
statistics such as the number of tweets are uninformative. Democratic candidate Twitter accounts was sparser, and
This result suggests that merely spamming Twitter is not a their tweets were scattered over many topics, failing to
useful strategy. convey a single coherent message.
In the last experiment we constructed a set of logistic Within the Republican Twitter network, the presence of
regression models combining subsets of the variables the Tea Party members was boisterous. From their frequent
described above. Table 6 presents the accuracy achieved use of hashtags and coherent language model, Tea Party
by each model in 10-fold CV evaluation (with automated members appeared to be running an organized Twitter
model selection applied). The results show that information campaign. This is somewhat surprising given the
hidden in graph structure and content can significantly grassroots nature of this movement. However, a qualitative
improve the accuracy of election prediction (88% accuracy inspection of Tea Party messages and LM profile indicates
over 81% accuracy omitting Twitter-derived variables). a possible reason: members had joined forces on Twitter in
Finally, we verified that the model performed similarly on attacking key Democrats.
Republicans as well as on Democrats. Beyond allowing us to quantify political activity on
Twitter, network and content variables are also predictive
Table 6. Logistic Regression Models of election outcomes. Candidates whose tweets resembled
that of many others in the corpus, that is, they were centrist
Name Variables Accuracy in their topic selection rather than extremist, were more
All tweets, kl-corpus, incumbent, correlated with victory. Interestingly, based on the higher
party, closeness_all, 88.0% predictiveness of KL-corpus over KL-party, candidates are
closeness_out, same_party judged based on their position on the broad political
All but tweets, corpus, incumbent, spectrum rather than on intra-party positioning.
kl-corpus same_party party, closeness_all, 85.5% We also mention here one metric that was not predictive
closeness_out of election outcomes: the relation between the KL
No incumbent, party, same_party, divergence of two opponents’ LMs and the percentage of
84.0%
content closeness_all, closeness_out votes each candidate garnered. This suggests that perhaps
No graph tweets, kl-corpus, incumbent, it is more important how a candidate addresses more
83.8% broadly discussed issues, than how much they mimic or try
party, same_party
No graph to differentiate themselves from their opponent. It is
incumbent, party, same_party 81.5% important to keep in mind that the KL divergence suggests
& content
an estimation of directionless distance. It would be
6. Discussion and Future Work interesting to repeat these experiments with a distance
measure that also contains a notion of direction, to position
The model described above determines if any given
candidates on the political spectrum.
candidate would win. Thus, in any given race, the model
Our content analysis is further limited in the sense that
might find that neither or both candidates won. To test for
we relied on the Bag-of-Words model, ignoring the word
the ability to predict race outcome we apply a simple
meaning and the expressed sentiment. It is possible that
scheme in which the most probable candidate is chosen as
sometimes users quote other users in order to mock them.
victor. As we do not have information for every candidate,
In future work we plan to assign positive and negative
only 63 races were used in this analysis. Applying this
weights to edges using sentiment analysis in order to
technique, we correctly predict 49 out of 63 (77.7%) of the
improve the accuracy of our model. Additionally, we foundthat (in part) due to tweet length, an initial attempt to apply Glassman, M. E., Straus, J.R., and Shogan, C.J. 2010. Social Networking
Latent Dirichlet Analysis (LDA) to the corpus failed to and Constituent Communications: Member Use of Twitter During a Two-
Month Period in the 111th Congress, Congressional Research Service.
produce topics of high enough quality. We are pursuing
Honeycutt, C., and Herring, S. C. 2009. Beyond Microblogging:
other mechanisms for generating high quality topics.
Conversation and Collaboration via Twitter. HICSS’09
Finally, the correspondence between network and
Jansen, B. J., Zhang, M., Sobel, K., and Chowdury, A. 2009. Twitter
content proximity suggests that homophily and social Power: Tweets as Electronic Word of Mouth. JASIST, 60: 1–20.
influence shape political candidates’ activity on Twitter.
Java, A., Song, X., Finin, T. and Tseng, B. 2007. Why We Twitter:
By tracing the time-evolution of mentions and content, we Understanding Microblogging Usage and Communities. WebKDD and
might be able to approximate the range of individuals’ SNA-KDD, 56–65.
influence within the network. Jelinek, F. 1997. Statistical Methods for Speech Recognition. Cambridge,
MA: MIT Press.
7. Conclusions Kastellec, J.P., Gelman, A., and Chandler, J.P., 2008. Predicting and
In this paper we studied the usage patterns of Twitter by Dissecting the Seats-Votes Curve in the 2005 U.S. House Election,
Political Science, 41:139-145.
candidates in the 2010 U.S. midterm elections. Our study
Kleinberg, J. 1999. Authoritative sources in a hyperlinked environment.
addresses House, Senate and gubernatorial races as well as
Journal of the ACM, 46:604–632.
the virtual Tea Party. We incorporated structural and
Metzler, D., Lavrenko, V. and Croft, W.B. 2004. Formal Multiple-
content analysis, and demonstrated the utility of using Bernoulli Models for Language Modeling. SIGIR’04, 540–541.
language modeling to estimate group cohesiveness as well
Milgram, S. 1967. The Small World Problem. Psychology Today, 2:60-
as divergence of individuals. Our results indicate strong 67.
cohesiveness among conservatives, even for the largely Page, L., Brin, S., Motwani, R. and Winograd, T. 1998. The PageRank
unstructured Tea Party. We also find significant citation ranking: Bringing order to the Web. Technical Report, Stanford
relationships between content, graph structure and election University, Stanford, CA.
results by building a model that predicts whether a Ponte, J. & Croft, W. B. 1998. A Language Modeling Approach to
candidate will win or lose with accuracy of 88.0%. While Information Retrieval. SIGIR’98, 275–281.
we do not claim the use of Twitter determined the results, Romero, D. M., Galuba, W., Asur, S. and Huberman, B. A. 2010.
we do think a broader analysis over several campaigns Influence and Passivity in Social Media. Technical Report.
could provide insight into what kinds of Twitter-based arXiv:1008.1253, CoRR, http://arxiv.org/abs/1008.1253.
campaign activities are more effective. Senak, M. 2010. Twongress: The Power of Twitter in Congress. White
Paper, eyeonfda.com.
8. Acknowledgments Shmueli-Scheuer, M., Roitman, H., Carmel, D., Mass, Y., & Konopnicki,
D. 2010. Extracting User Profiles from Large Scale Data. Workshop on
We would like to thank Abe Gong for his helpful insights. Massive Data Analytics on the Cloud, 1-6.
This work was supported in part by NSF IIS-0746646. Smith, A. 2011. 22% of online Americans used social networking or
Twitter for politics in 2010 campaign, Report of the Pew Internet
References Research Center.
Adamic, L. A. & Glance., N. 2005. The Political Blogosphere and the Song, F. & Croft, W. B.1999. A General Language Model for Information
2004 U.S. Election: Divided They Blog. 3rd Int. Workshop on Link Retrieval. CIKM’99, 316-321.
Discovery, 36–43. Sparks, D. B., Birds of a Feather Tweet Together: Partisan Structure in
Ammann, S. L., 2010, A Political Campaign Message in 140 Characters Online Social Networks, Presented at the 2010 meeting of the Midwest
or Less: The Use of Twitter by U.S. Senate Candidates in 2010, Political Science Association.
http://ssrn.com/abstract=1725477 Stewart, M. 2010. House Republicans compete in new media challenge,
Blei, D. M., Ng. A.Y., and Jordan, M.I. 2003. Latent dirichlet allocation, CNN politicalticker, April 20, 2010.
J. of Machine Learning Research, 3:993-1022. Sugiyama, K., Hatano, K. and Yoshikawa, M. 2004. Adaptive Web
Brown, P. F., Cocke, J., Pietra, S. A. D., Pietra, V. J. D., Jelinek, F., Search Based on User Profile Constructed Without any Effort from Users.
Lafferty, J. D., Mercer, R. L. and Roossin, P. S. 1990. A Statistical WWW’04, 675–684.
Approach to Machine Translation. Computational Linguistics vol. 16, no. Tumasjan, A., Sprenger, T. O. , Sandner, P. G. and Welpe. I. M. 2010.
2, pp. 79–85. Predicting Elections with Twitter: What 140 Characters Reveal about
Chittal, N. 2010. Twitter Reality: The Republicans are Crushing the Political Sentiment. ICWSM’10.
Democrats When it Comes to Tweeting, AlterNet, August 13, 2010, Williams, C., and Gulati, G. 2008. What is a Social Network Worth?
http://www.alternet.org/story/147822/?page=1. Facebook and Vote Share in the 2008 Presidential Primaries. In Annual
Diakopoulos, N. and Shamma, D. A. 2010. Characterizing Debate Meeting of the American Political Science Association, 1-17.Xue, G.,
Performance via Aggregated Twitter Sentiment. CHI’10, 1195-1198. Han, J., Yu, Y. and Yang, Q. 2009. User Language Model for
Collaborative Personalized Search. ACM Transactions on Information
Freeman, L.C. 1979. Centrality in social networks conceptual
Systems 27(2): 1-28.
clarification. Social Networks 1(3):215-239
Zhang, Y. and Koren, J. 2007. Efficient Bayesian Hierarchical User
Golbeck, J., Grimes, J., and Rogers, A. 2010. Twitter use by the U.S.
Modeling for Recommendation System. SIGIR’07, 47–54.
Congress, JASIST 61(8):1612-1621.You can also read