Process optimisation of low-caffeine coffee using steam treatment - Preprints
←
→
Page content transcription
If your browser does not render page correctly, please read the page content below
Preprints (www.preprints.org) | NOT PEER-REVIEWED | Posted: 15 May 2020 doi:10.20944/preprints202005.0254.v1

 1

 Process optimisation of low-caffeine coffee using steam treatment

 Riyan Anggriawana,b,*, Ali Maksumc, Fransisca Wijayaa, Ike Sitoresmi Mulyo Purbowatic

 * Corresponding author
 E-mail address: riyan.anggriawan@pmbs.ac.id

 a
 Food Business Technology, School of Applied Science, Technology, Engineering and
 Mathematics (STEM), Prasetiya Mulya University, Tangerang 15339, Indonesia
 b
 Research, Community Service and Industry Relation Section, STEM, Prasetiya Mulya
 University, Tangerang 15339, Indonesia
 cDepartment of Agricultural Technology, Jenderal Soedirman University, Purwokerto, 53123,
 Indonesia

 Abstract

 In addition to being a source of freshener, coffee has an enormous possibility to be
 developed as a source of antioxidants for functional beverages. However, efforts to increase
 the value added of coffee as a health functional drink are still hindered by the presence of high
 level of caffeine, which is thought to have adverse effects on health, especially for coffee lovers
 who are vulnerable to caffeine. This study aims to optimise the steaming duration to produce
 low caffeine coffee while maintaining the sensory attributes and antioxidant compounds
 contained in it. Indonesian Arabica (Leksana variety) green coffee beans were steamed with
 multi-level steaming durations (0, 20, 40, 60 and 80 min) followed by roasting (medium-dark
 roast degree), grinding, and brewing (espresso method). The results indicate that caffeine
 content in the coffee was inversely proportional to the steaming duration. The lowest caffeine
 content was obtained from the treatment of 80 min steaming with a decrease of caffeine level
 up to 28.73%. However, the longer process of steaming caused a significant decrease in
 polyphenol content and antioxidant activity. The hedonic test shows that the steaming treatment
 of coffee can increase preferences of panellists. There were two driving attributes that influence
 the overall liking of coffee, namely: bitterness and aftertaste. Coffee obtained from the
 treatment of 60 min steaming was most preferred by panellists. The results of APLSR biplot
 mapping show that there was a big change in almost all attributes in the coffee samples after
 40 min steaming.

 Keywords:
 Antioxidant activity, Arabica coffee, Caffeine reduction, Steaming times

 © 2020 by the author(s). Distributed under a Creative Commons CC BY license.
Preprints (www.preprints.org) | NOT PEER-REVIEWED | Posted: 15 May 2020 doi:10.20944/preprints202005.0254.v1

 2

 Introduction

 The role of coffee as a source of antioxidants is not widely known by the community.
 In fact, coffee contains bioactive compounds, especially polyphenols which function as
 antioxidant compounds, one of which is chlorogenic acid along with its derivatives namely p-
 coumaric acid trigonelline, and ferulic acid (Affonso et al., 2016). Yen et al. (2005) stated that
 coffee has an antioxidant activity four times higher than green tea. The health benefits of
 antioxidants are well known since these compounds are able to neutralize free radical
 compounds. As a lot of researchers have previously reported, the presence of free radicals at
 high concentrations in the body can trigger oxidative stress that can cause damage to cells and
 tissues, which is the primary cause of many kinds of diseases such as cancer, cataracts,
 hypertension, arteriosclerosis, diabetes, immune decline, neurodegenerative diseases and other
 health problems (Sharma, 2014). Coffee consumption was found to add the total intake of
 polyphenols in one’s diet so that it was thought to reduce the risk of health problems (Grosso
 et al., 2014). This finding is also in line with epidemiological study which showed that coffee
 consumption could prevent various degenerative diseases (Bae et al., 2014). However, for some
 people, especially those with sensitive stomach, coffee consumption must be avoided due to
 the negative effects of caffeine.
 Caffeine compound is recognized as alkaloid due to its origin from secondary
 metabolites consisting of purine nucleotides with heterocyclic nitrogen atoms (de Paula and
 Farah, 2019). Caffeine compound contained in coffee increases adrenaline so as to refresh
 people who drink it (Bettram et al., 2014). Caffeine was found to increase systolic pressure by
 17% and heart rate (Geethavani et al., 2014). Excessive caffeine consumption could be harmful
 to health, for example increasing brain tension, delirium, stress, symptoms of poisoning
 (Willson, 2018), and increasing the secretion of gastric acid (Liszt et al., 2017). In addition,
 other negative effects such as nausea, anxiety, poor fetal growth, and bone loss were related
 with excessive caffeine consumption (de Mejia et al., 2014). Caffeine also influences acute
 increase in blood pressure for 3 hours in people suffering from hypertension (Mesas et al.,
 2011). Therefore, it is necessary to find the right solution to minimize the negative effects of
 caffeine, as well as to improve the image of coffee as a drink that is safer to consume, even by
 patients with hypertension and sensitive stomach.
 One of the solutions that can be done is to reduce or even eliminate the caffeine
 compound in coffee beans called decaffeination. This process is able to reduce caffeine
 compound without reducing the odor and taste of coffee and maintain the functional properties
Preprints (www.preprints.org) | NOT PEER-REVIEWED | Posted: 15 May 2020 doi:10.20944/preprints202005.0254.v1

 3

 of the drink. Water steam treatment method was chosen in this study. Caffeine solubility
 increased significantly when it was dissolved in water with high temperatures, so that it was
 effective to use for the decaffeination process (Pietsch, 2017). Heat can break the bonds of
 caffeine ions and other compounds, so that caffeine will be free and loose in water (Peker et
 al., 2004). This method is relatively simple, inexpensive, and more environmentally friendly
 so it has the potential to be widely applied to small-scale coffee businesses in developing
 countries. The disadvantage of this method is that the components of compounds other than
 caffeine are also dissolved in water such as sugar which is a component of aroma (Pietsch,
 2017). Therefore, optimisation of the caffeine reduction process is needed so that there are not
 too many components other than caffeine which are not dissolved during the process. In this
 study, the researchers examined the most optimal steaming duration to reduce caffeine level in
 Arabica coffee by considering several important properties including sensory aspect that might
 be affected by the method.

 Materials and Methods

 Sample preparation

 Wet processed Arabica (Leksana variety) green beans with first grade was obtained
 from a local coffee plantation at the slopes of Mt. Slamet, Banyumas Regency, Indonesia (with
 moisture content 11.37 ± 0.65 %, wet basis). The green coffee bean (80 g) measured using
 analytical balance M5-HPB 414Ai (BEL Engineering, Italy) was submitted to steam treatment
 in steamer MCM-606 (Miyako, Indonesia) following a completely randomized design with
 different steaming time (20, 40, 60, and 80 min) as the independent variable. An untreated
 coffee bean (0 min) was maintained as a control variable. Therefore, there were 5 levels of
 treatment, namely: t0 = 0 min (control), t20 = 20 min, t40 = 40 min, t60 = 60 min, and t80 = 80
 min. The steaming temperature was maintained at 100°C (atmospheric pressure).
 The steamed coffee beans were dried using food dehydrator model 616 (Ariete,
 Indonesia) for 1 hour. The temperature was set at 60°C to prevent excessive heating. The drying
 operation was done mainly to prevent moisture from interrupting the roasting process.
 Afterwards, the dried green coffee beans were roasted using roaster SCR 301 (Bar Well,
 Indonesia) for 16 min at 220°C. With this temperature and duration, the coffee would reach the
 medium-dark roast degree. The roasted coffees were middle ground using food blender 7011S
 (Waring, USA) and stored in sealed flasks with silica gel (food grade) at room temperature for
Preprints (www.preprints.org) | NOT PEER-REVIEWED | Posted: 15 May 2020 doi:10.20944/preprints202005.0254.v1

 4

 analysis. Espresso brewing method was chosen on the basis of its consumption all over the
 world. Espresso coffee samples were prepared using espresso maker CRM 2008 (CRM, China).
 The researchers used ten grams of powdered coffee and brewed it with distilled water (100 mL)
 with the following conditions: ground coffee and water ratio was 1:10 (w/v); water temperature
 of 95°C; and relative pressure of 5 atm.

 Chemicals

 All the chemicals (at analytical grade) used in this research were acquired based on
 Sigma-Aldrich (St Louis, USA). All the solvents had HPLC grade of purity and purchased
 from Merck (Darmstadt, Germany).

 Measurement of ground coffee physical attributes

 Browning index (BI) analysis
 The measurement of the physical appearance of ground coffee especially its colour was
 performed using a chroma meter (Minolta CR-310, Japan). Colour detection followed the
 provided manual instructions. Measurements were made in triplicate. Chroma meter tool used
 the Hunter colour notation system characterized by 3 parameters a* (redness or greenness), b*
 (blueness or yellowness), and L* (whiteness or darkness). Maskan (2001) stated that these
 values were then used in the BI formula:
 ( + 1.75 )
 =
 (5.645 + − 3.012 )

 [100( − 0.31)]
 BI =
 0.17

 Moisture content (MC) analysis
 MC determination of powdered coffee was performed by using the AOAC method
 10.102 (AOAC, 2016). The MC result was presented as a g/100 g dry basis (db).

 Measurement of pH, chemical and antioxidant properties for coffee brew

 Determination of pH
Preprints (www.preprints.org) | NOT PEER-REVIEWED | Posted: 15 May 2020 doi:10.20944/preprints202005.0254.v1

 5

 An amount of 40 mL of coffee brew was cooled to room temperature before used for
 pH measurement. The pH measurement was carried out using a digital pH meter CG 842
 (Schott, Germany) and this tool had been calibrated by using acetate buffer (pH 4) and
 phosphate buffer (pH 7). Then, the electrode was dipped for a while into the sample filtrate to
 find out the measured pH. Measurements were made in triplicate.

 Analysis of total phenolic content (TPC)
 TPC in the coffee brew was assessed using Folin-Ciocalteu protocol firstly explained
 by Shetty et al. (1995) with minor modification. The standard used here was gallic acid. TPC
 was defined as gallic acid equivalent (GAE).

 Antioxidant activity (DPPH IC50) analysis
 Scavenging activity for free radical of the coffee brew was assessed by using DPPH
 (2,2-diphenyl-1-picrylhydrazyl) in accordance with the protocol explained by Yen and Chen
 (1995) with minor modification. Preparation mixture as follows; A sample blank (sample with
 no DPPH solution)= 750 µL sample + 750 µL EtOH; A control (DPPH solution by excluding
 sample) = 750 µL DPPH 0,16 mM + 750 µL EtOH; and A sample (DPPH solution plus test
 sample)= 750 µL sample + 750 µL DPPH 0.16 mM. Briefly, the mixture was then shaken
 intensely and was put to standard room temperature in darkness for 30 min. The changes of the
 sample absorbance were then recorded at 517 nm with a spectrophotometer (1700
 spectrophotometer, Shimadzu). The performance to scavenge free radical was determined
 according to formula stated below.
 DPPH radical scavenging activity (%) =

 −
 [1 − ( )] 100

 DPPH IC50 value was determined by finding the coffee concentration which provided a 50%
 reduction of free radical concentration.

 Caffeine content analysis
 Caffeine content was analysed with high performance liquid chromatography (HPLC
 Shimadzu, UV-VIS detector) for quantification using VP ODS C18 Column with internal
 diameter of 4.6 nm, pore size of 5µm and length of 150 mm (Thermo scientific). The HPLC
Preprints (www.preprints.org) | NOT PEER-REVIEWED | Posted: 15 May 2020 doi:10.20944/preprints202005.0254.v1

 6

 conditions included constant 1 mL/min flow rate with column temperature at 40°C and a UV
 detector regulated at 254 nm. The mobile phase used was methanol:water (20:80 v/v) which
 both were HPLC grade. Briefly, a 0.45 μm Milipore filter was utilized to filter the coffee brew
 (Merck Milipore, Germany), and 20 μL of the sample that had been filtered was submitted for
 HPLC analysis. The amount of caffeine was determined from the peak area based on a standard
 caffeine curve (LoD = 0.9 mg/L; R2 = 0.995).

 Sensorial evaluation of coffee brew
 All four steam-treated beans and control were prepared as espressos using espresso
 maker for acceptance (hedonic) test, as previously described in sample preparation section. Ten
 millilitres of espresso would be poured into small glass with the same volume and labelled
 using three-digit random code. The respondents consisted of 50 panellists who were regular
 consumers of espresso coffee. They were 18 to 35 years old consisting of 42% women and
 58% men. Each panellist was given espressos from the 4 steam-treated beans and control along
 with the response sheet. Panellists were asked to fill out a response sheet followed by a liking
 score scaling from 1−9 (1 = dislike very much, 9 = like very much) to the samples based on
 each panellist’s level of acceptance on each attribute. The attributes that were tested included
 colour, coffee aroma, bitterness, aftertaste, and overall liking. Panellists were obligated to eat
 crackers to neutralize palate after testing. Table 1 describes the attributes.
 Table 1 Attribute description
 Attribute Description
 Coffee odor/aroma The distinct smell due to coffee products (Stokes et al., 2017)
 Bitterness Sensation generated from bitter substances present in coffee, which is
 brewed using espresso method. This sensation is especially
 recognized at the back part of the tongue (Barahona et al., 2020)
 After taste Post-tasting flavours that settle in the mouth after the coffee drink is
 tasted. These flavours can be defined as pleasant or unpleasant. e.g.
 astringent, acidic, burnt taste (Barahona et al., 2020)
 Overall liking Summary of the panellists’ assessments related to overall impression
 of the sample (Barahona et al., 2020)
 Colour The brown colour of coffee samples (Geel et al., 2005)

 Statistical analysis
 All analyses (physicochemical and antioxidant properties) were performed in
 quadruplicate (n = 4). The data were elaborated as means ± standard error. One-way ANOVA
 was applied to calculate the significant differences between the means by using the IBM SPSS
Preprints (www.preprints.org) | NOT PEER-REVIEWED | Posted: 15 May 2020 doi:10.20944/preprints202005.0254.v1

 7

 Statistic 20 software (SPSS Inc., Chicago, IL, USA). The significance was assessed at level of
 p < 0.05. Tukey post hoc test was utilized to compare the mean of each sample.
 The APLSR (ANOVA-Partial Least Squares Regression) multivariate analysis was
 performed to obtain the relationship between the various steaming time and the panellists
 preference. All properties profiling was analysed using APLSR biplot with Origin Pro 2019
 software (OriginLab Inc., Northampton, MA, USA).

 Results and Discussion

 Moisture content and browning index of powdered coffee

 The moisture content value of powdered coffee in this research is shown in Table 2.
 The moisture content of ground coffee showed a notable increase (p < 0.05) along with an
 increase in steaming time. The highest moisture content was found in samples t60 and t80,
 namely 2.90 ± 0.31 and 3.16 ± 0.19 g/100 g, respectively. Even so, the moisture content of
 ground coffee produced is still in accordance with the Indonesian National Standard (SNI 01-
 3542-2004), stating that the maximum moisture content of ground coffee is 7%. Increased
 coffee moisture content is due to condensation of water vapor to the surface and pores of coffee
 beans (Malkov et al., 2002). The steaming treatment is thought to cause the pores of the coffee
 beans to widen so that the result of condensation of water vapor enters through the pores of the
 coffee beans in high amounts (Widyotomo et al., 2009). Jokanovic et al. (2012) stated that the
 water content in coffee beans can affect the level of fragility of the beans and the grinding
 process which can then affect the coffee extraction process.

 Tabel 2 Moisture content, and browning index of the powdered coffee obtained from
 different steaming times treatment
 Steaming Times Moisture Content (g/100 g) Browning Index
 c
 0 min (t0) 2.33 ± 0.23 128.00 ± 6.57a
 20 min (t20) 2.40 ± 0.14c 119.04 ± 7.1a
 bc
 40 min (t40) 2.64 ± 0.22 90.17 ± 4.19b
 60 min (t60) 2.90 ± 0.31ab 71.74 ± 3.44c
 a
 80 min (t80) 3.16 ± 0.19 60.92 ± 3.84c
 Mean of four data ± standard deviation (sd).
 Values written with different superscript in the same column showed a significant difference
 in Tukey’s test (p < 0.05).
Preprints (www.preprints.org) | NOT PEER-REVIEWED | Posted: 15 May 2020 doi:10.20944/preprints202005.0254.v1

 8

 Browning index (BI) shows brown colour develops as a result of non-enzymatic
 browning (maillard) during roasting. BI values indirectly indicate the amount of brown
 pigments (melanoidins) formed during browning reactions (Maskan et al., 2001). As shown in
 Table 2, the value of ground coffee BI showed a notable decrease (p < 0.05) along with the
 extend in steaming duration. Highest BI values were found in the samples t0 and t20, namely
 128.00 ± 6.57 and 119.04 ± 7.11, respectively. The steaming treatment is thought to cause
 leaching of the sugar and amino acid components of coffee beans. The longer the steaming
 process causes more components of sugar and amino acids to leach leading the maillard
 reaction to occur less intensively during the roasting. Maillard reaction can be defined as a
 browning reaction due to a reaction between sugar and amino acids or protein. It begins with
 the reaction between the aldehyde group or ketone in sugar with the primary amine group on
 amino acids or protein to form glycosylamine (schiff base). Afterwards, it is followed with an
 Amadori rearrangement that will convert glycosylamine to a semi-finished product.
 Furthermore, intermediate products are involved in an intricate reaction (dehydration and
 polymerization) to form various volatile compounds and brown pigments of melanoidin
 (BeMiller and Huber, 2008).

 pH and caffeine content of coffee brew

 Table 3 shows that the pH value had a significant increase (p < 0.05) along with the
 longer steaming time. The lowest pH values were found in samples t0 and t20 with pH values of
 5.14 ± 0.05 and 5.26 ± 0.07, respectively. Meanwhile, the highest pH value was found in
 sample t80 with a pH value of 6.13 ± 0.10. It is considered to be due to the loss of various
 organic acids during the steaming process. There are various types of organic compounds with
 low molecular weight contained in coffee including carboxylic acids such as succinic, malic,
 citric, gluconic and quinic acids. These organic acids are polar and easily dissolve in water
 (Rao and Fuller, 2018). In addition, the longer steaming is considered to cause leaching of
 proteins and more intensive coffee bean sugar which causes the formation of various types of
 acids during roasting being inhibited. Ginz et al. (2000) stated that acidity can also be produced
 from the degradation of proteins and sugars into acidic compounds during the roasting.
 Table 3 shows that the caffeine content of coffee decreased significantly (p < 0.05)
 along with longer heating duration. The lowest caffeine content was obtained in sample t80 of
 0.84 ± 0.015 g/100 g. When compared to the control (t0), the decrease in caffeine in t80 sample
 reached 28.73%. Steaming plays a role to separate caffeine bonds with chlorogenic acid located
Preprints (www.preprints.org) | NOT PEER-REVIEWED | Posted: 15 May 2020 doi:10.20944/preprints202005.0254.v1

 9

 in the cytoplasm and cell walls that are difficult to dissolve in water. The separation of the
 bonds between caffeine and chlorogenic acid makes caffeine more soluble in water (Peker et
 al., 2004). The longer the steaming time, the more caffeine being released from chlorogenic
 acid. Caffeine content decreased during steaming because caffeine (which is not bound/free)
 has the same polar nature as water. The caffeine polarity is due to there are two carbonyl groups
 together with free electron pairs of nitrogen so that caffeine can dissolve in water (Edward et
 al., 2015). However, the reduction in caffeine content is still relatively low because caffeine
 has a thin, flat surface so that it is easily hydrated which causes water splitting and becoming
 somewhat nonpolar (Tavagnacco et al., 2011).

 Table 3 pH, total pehenolic content (TPC), DPPH IC50, and caffeine content of coffee brew
 obtained from different steaming times treatment
 Steaming Times pH TPC DPPH IC50 Caffeine Content
 (g GAE/100 g) (mg/mL) (g/100 g)
 d a d
 0 min (t0) 5.14 ± 0.05 5.59 ± 0.17 10.21 ± 0.55 1.17 ± 0.021a
 20 min (t20) 5.26 ± 0.07d 5.38 ± 0.05ab 11.22 ± 0.48d 1.08 ± 0.013b
 40 min (t40) 5.47 ± 0.05c 5.25 ± 0.10b 13.81 ± 0.51c 1.02 ± 0.019c
 b c b
 60 min (t60) 5.93 ± 0.05 4.35 ± 0.26 19.90 ± 0.57 0.93 ± 0.020d
 a d a
 80 min (t80) 6.13 ± 0.10 3.27 ± 0.15 22.03 ± 0.67 0.84 ± 0.015e
 Mean of four data ± standard deviation (sd).
 Values written with different superscript in the same column showed a significant difference
 in Tukey’s test (p < 0.05).

 Phenolic content and antioxidant activity of coffee brew

 Referring to Table 3 it was known that the total phenol experienced a significant
 reduction (p < 0.05) along with the steaming time. The highest values of total phenol were
 found in samples t0 and t20 with of 5.59 ± 0.17 and 11.22 ± 0.48 g GAE/100 g, respectively.
 Meanwhile, the lowest total phenol was found in sample t80 with a value of 3.27 ± 0.15 g
 GAE/100 g. High steaming temperature triggers phenols damage because phenolic compounds
 are very susceptible to damage by high temperatures (Kalshcne et al., 2019). The polyphenols
 also have hydrophilic properties so that they will dissolve with water vapor when they are
 steamed. The hydrophilic nature of phenols is due to the presence of hydroxyl groups that bind
 to benzene aromatic rings (Takebayashi et al., 2016).
 Table 3 shows the antioxidant activity of coffee brew, where the longer the steaming
 time using hot water, the lower the antioxidant activity, as indicated by the DPPH IC 50 value
 which evidnced a significant increase (p < 0.05). The decrease in activity of antioxidant was
Preprints (www.preprints.org) | NOT PEER-REVIEWED | Posted: 15 May 2020 doi:10.20944/preprints202005.0254.v1

 10

 known by the higher concentration needed to achieve 50% DPPH inhibition. The antioxidant
 compounds contained in coffee are dominated by polyphenolic compounds such as chlorogenic
 acid, trigonelline, p-coumaric acid, caffeine acid and ferulic acid (Affonso et al., 2016). This
 result is also in line with the research conducted by Kalshcne et al. (2019), which reported that
 trigonelline polyphenol that was partially liable for the antioxidant activity of coffee was
 negatively affected by steaming duration.
 From the aforementioned explanation, it can be seen that a positive relationship was
 emerged between phenolic content and antioxidant activity. The total phenol contained in
 coffee decreased with the duration of steaming and it also occurred in antioxidant activity. This
 is due to the antioxidant compounds in coffee are dominated by polyphenolic compounds

 Sensory analysis
 The mean intensity and ANOVA result for the regression coefficient of APLSR for
 sensory acceptance data are shown in Table 4. The t60 example was the most acceptable with a
 mean value of 5.68 and significantly different from other samples (p < 0.01), followed with t40
 and t80 with a mean value of 4.82 and 4.84, respectively. The least accepted coffees were the
 t20 sample and the control (t0) with a mean value of 4.72 and 4.48, respectively. Table 2 shows
 that all samples were positively correlated with all attributes. From the table, it was found that
 the sample t40, t60 and t80 were positively correlated significantly to the bitterness (p < 0.05),
 with the highest mean value of 5.64 was obtained by sample t60. For colour attributes, only
 control that showed a significant and positive relationship (p < 0.001), and obtained the highest
 mean value of 6.04. Meanwhile, for aftertaste, a significant positive correlation was found in
 sample t60 with the highest mean value of 5.18.

 Table 4 The average and p value of regression coefficients from APLSR analysis for the
 hedonic test result
 Bitterness Color Aroma Aftertaste Overall liking
 Steaming
 P Aver P Aver P Aver P Aver P Aver
 times
 value* age value* age value* age value* age value* age
 0 min (t0) 0.061ns 4.02 0.000*** 6.04 0.352ns 5.28 0.340ns 4.38 0.266ns 4.48
 20 min (t20) 0.466ns 4.62 0.839ns 5.40 0.255ns 6.06 0.310ns 4.54 0.865ns 4.76
 40 min (t40) 0.015* 4.26 0.873ns 5.20 0.266ns 5.76 0.094ns 4.96 0.798ns 4.82
 60 min (t60) 0.037* 5.64 0.101ns 5.78 0.051ns 5.94 0.045* 5.18 0.003** 5.68
 80 min (t80) 0.016* 4.80 0.067ns 5.34 0.217ns 5.54 0.057ns 4.70 0.531ns 4.84
 *A p value for revelant regression coefficient. The significance of regression coefficients: ***p
 < 0.001, **p < 0.01, *p < 0.05, and ns=not significant.
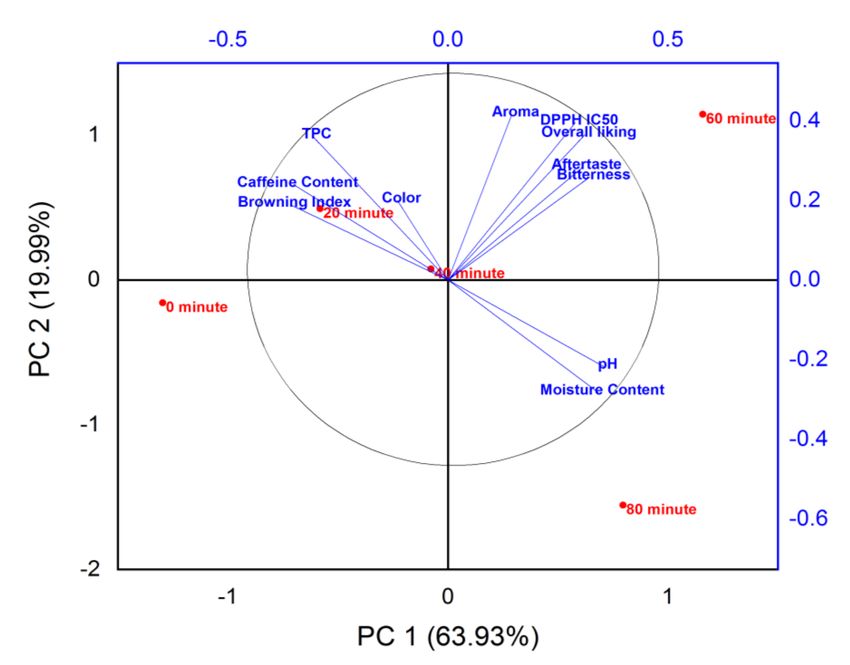
Preprints (www.preprints.org) | NOT PEER-REVIEWED | Posted: 15 May 2020 doi:10.20944/preprints202005.0254.v1

 11

 Fig. 1 illustrates the APLSR correlation loadings plot regarding hedonic evaluation of
 all coffee samples. The location of the attributes to the samples reveals the positive and negative
 drivers of acceptance (Meilgaard et al., 2016). The vector of the overall liking attribute was in
 the upper right quadrant close to sample t60 as it is was the most preferred by panellists.
 Meanwhile, the control (t0) was in the lower left quadrant (the adversative direction) to the
 overall liking. This shows that control was least liked by consumers. Attributes that fall close
 to each other on the map are positively correlated with each other, and vice versa (Meilgaard
 et al., 2016). Fig. 1 shows the attributes that were significantly and positively correlated with
 overall liking were aftertaste and bitterness. In this case, with the increasing of the two
 attributes, the overall level of preference for coffee products will increase.

 Fig. 1 APLSR biplot of all coffee properties changes from various steaming levels

 The aroma of coffee is one of the important sensory attributes that influence quality
 (Illy and Viani, 2005). Although it is not significant, multivariate analysis revealed that there
 was a positive correlation of coffee aroma with each sample. This means that the more
 panellists like the aroma of coffee, then the overall coffee will be preferred as well. These study
 findings are in line with the study conducted by Stokes et al. (2017) which evidenced that filter
 coffees had a positive relationship with the preference of aroma, flavour and overall liking
 compared with instant coffee. On the other hand, Barahona et al. (2020) stated that smelling
 sensory properties have greater impact on buying intentions compared to tasting attributes. It
Preprints (www.preprints.org) | NOT PEER-REVIEWED | Posted: 15 May 2020 doi:10.20944/preprints202005.0254.v1

 12

 means that the increasing preference for smelling attributes will increase the overall preference
 level, which in turn will influence buying intentions.
 There are about 20−30 volatiles components in coffee that contribute to individual
 aroma (Sunarharum et al., 2014). The aroma of coffee is influenced by the processing stages,
 one of which is the preparation stage (Bhumiratana et al., 2011). Steaming process of coffee
 beans in this study was carried out in various time durations without pressure. However, this
 treatment did not result in differences of coffee aroma preferences among the samples. On the
 other hand, Baggenstoss et al. (2008) found that steam treatment with pressure combination
 had a dominant effect on roasting behaviour of coffee when some precursor compounds were
 extracted. Therefore, concentrations of various odorants showed differences relative to the
 concentration in coffee without any intervention, both in light and dark roasts. Meanwhile,
 there was still unclear sensory impact related to these differences in concentration and it should
 be clarified further using sensory tests and gas chromatography−olfactometry analysis.
 Another attribute that has a positive correlation with overall preference is bitterness.
 Sample t40, t60 and t80 were significantly and positively correlated with bitterness. One of the
 components that contributes to the bitter taste in coffee is caffeine (Buffo and Cardelli-Freire,
 2004). The steaming process carried out in this study resulted in reduced caffeine content. The
 longer the steaming time, the lower the caffeine content (Table 3). This difference in bitterness
 was felt by panellists starting from sample t40 which was steamed for 40 min. Panellists felt
 less bitter taste in sample t60 compared to control. The sample t60 resulted in a higher level of
 preference. It means that the panellists liked the bitterness profile of the longer steam-treated
 coffee since the bitterness intensity of panellists lowered along with longer steaming time.
 These results are consistent with Geel et al. (2005) which conducted a sensory profiling for 11
 instant coffees including decaffeinated coffee. One of the results was that decaffeinated coffee
 was felt by consumers to be less bitter than pure coffees.
 Aftertaste is also a driving attribute for overall liking and it is positively correlated with
 overall liking. It means that the increased liking for aftertaste will also increase the overall
 liking for coffee. Aftertaste is very closely related to bitterness shown by vectors that form
 small angles (Fig. 1). This is because the panellists might also feel the bitter taste of coffee as
 an aftertaste. Aftertaste of coffee that is felt by many panellists is astringent and acidic taste.
 One of the components that contributes to astringent taste is chlorogenic acids (CGA) which
 contains secondary metabolites in coffee beans and contribute to the astringency (Sunarharum
 et al., 2014). Steaming process leads to lower CGA levels in decaffeinated coffee of 3-9%
 compared to regular coffee. Although variations in the content of CGA of regular and
Preprints (www.preprints.org) | NOT PEER-REVIEWED | Posted: 15 May 2020 doi:10.20944/preprints202005.0254.v1

 13

 decaffeinated coffees seem to be quite small, those variation may significantly affect the
 flavour characteristics, such as astringency (Farah et al., 2006).
 Acidic taste is also felt as aftertaste by panellists. Acidic taste in coffee is due to the
 presence of organic acids contained in coffee. The steaming process causes a decrease in the
 organic acids contained in coffee as shown in Table 3. The pH of the sample increased along
 with the length of the steaming process. An increase in pH or a reduction in the amount of acid
 in coffee was felt by the panellists as indicated in higher aftertaste liking score in steamed-
 coffee samples compared to control, although it was not significant.
 The steaming process affected consumer acceptance of coffee colour. The longer
 steaming time resulted in the browning index reduction of the samples (Table 2). This caused
 the colour of the coffee sample to be brighter than the control (t0). This colour difference has
 been seen starting from the sample with a steaming time of 20 min. Sensory testing showed
 that panellists preferred darker than lighter brown coffee as indicated in score of preference
 obtained by control which was not treated with steaming. However, the result of multivariate
 analysis shows that colour liking attribute did not affect overall liking significantly. In this case,
 consumers tended not to pay attention to the colour of coffee in determining their preferences;
 in other words, colour is not a driving attribute for overall coffee liking.

 Critical steaming level analysis

 Biplot analysis (Fig. 1) distinguished the samples into different groups according to the
 steaming duration (PC1) and physicochemical, antioxidant and sensory attributes (PC2).
 Coffee samples were separated in three sites based on the steaming duration (PC1). Samples
 of 60- and 80-min steaming were placed on the right side and showed a higher pH, moisture
 content, sensory reception, and higher DPPH IC50 values. Samples of 0- and 20-min steaming
 were separated on the left side and showed a higher browning index, polyphenol, and caffeine
 content. The sample of 40 min steaming was located in a specific position in the middle of the
 image between the left- and right-side groups. This indicated that the critical steaming rate for
 changes in physicochemical and sensory attributes was at 40 min steaming. It is assumed that
 after 40 min the pores of the coffee beans opened optimally resulting in intensive leaching of
 various chemical components. This grouping shows that the steaming duration is crucial for
 the physicochemical, antioxidant, and sensory properties of coffee.
 In conclusion, the long steaming treatment of coffee had a significant effect on
 physicochemical variables which included moisture content, browning index, pH, total phenol,
Preprints (www.preprints.org) | NOT PEER-REVIEWED | Posted: 15 May 2020 doi:10.20944/preprints202005.0254.v1

 14

 and caffeine content and had a notable effect also on antioxidant property. The longer the
 steaming time increased the moisture content and pH, and decreased the Browning Index,
 caffeine content, total phenol, and antioxidant activity. The lowest caffeine content was
 obtained in the t80 steaming treatment with a decrease in caffeine amount of up to 28.73%, but
 its antioxidant activity also decreased to 2.2 times weaker compared to control. The coffee
 steaming process also caused significant differences in preferences between samples,
 especially with the aftertaste and bitterness attributes. These two attributes were positively
 correlated to overall liking. The effect of steaming process on the bitterness attribute could be
 felt after the steaming time of 40 min, while the aftertaste could be felt after 60 min. The
 difference of the colour was the fastest effect that could be seen by panellists starting from
 sample t20. Sample t60 was the most overall preferred by panellists indicated in the aftertaste
 and bitterness liking scores where the t60 sample was higher than control. In the aroma attribute,
 the steaming process in coffee could also increase overall preferences, but not significantly. It
 can be concluded that the steaming treatment of coffee can increase consumer preferences for
 coffee because it can significantly increase the preference for coffee bitterness and aftertaste
 caused by reduced caffeine content and polyphenol. The results of APLSR biplot mapping
 show that there was a big change in almost all attributes in the coffee samples after 40 min
 steaming. Based on the consideration of changes in all the attributes, it is recommended that
 60 min steaming is the most optimal duration for implementation.

 Conflict of Interest

 The authors declare that there are no conflicts of interest.

 Acknowledgements

 This article was partially funded by internal research grant from LPPM Jenderal
 Soedirman University and Prasetiya Mulya University. Authors also acknowledge local coffee
 plantation association in Banyumas regency for providing Arabica (Leksana variety) coffee
 beans.

 References

 Affonso, R.C.L., Voytena, A.P.L., Fanan, S., Pitz, H., Coelho, D.S., Horstmann, A.L., Ribeiro-
Preprints (www.preprints.org) | NOT PEER-REVIEWED | Posted: 15 May 2020 doi:10.20944/preprints202005.0254.v1

 15

 do-Valle, R.M. 2016. Phytochemical composition, antioxidant activity, and the effect of
 the aqueous extract of coffee (Coffea arabica L.) bean residual press cake on the skin
 wound healing. Ox. Med. Cell Long. 2016: 10–21.
 Association of Official Analytical Chemists (AOAC). 2016. Official methods of analysis of
 AOAC International. 20th ed. AOAC International, United States.
 Bae, J.H., Park, J.H., Im, S.S., Song, D.K. 2014. Coffee and health. Int. Med. Res. 3:189–91.
 Barahona, I., Jaimes, E.M.S., Yang, J.B. 2020. Sensory attributes of coffee beverages and their
 relation to price and package information: A case study of Colombian customers’
 preferences. J. Food Sci. Nut. 8: 1173–1186.
 Baggenstoss, J., Poisson, L., Kaegi, R., Perren, R., Escher, F. 2008. Roasting and aroma
 formation: Effect of initial moisture content and steam treatment. J. Agric. Food Chem.
 56: 5847–5851.
 Battram, D.S., Graham, T.E., Richter, E.A., Dela, F. 2005. The effect of caffeine on glucose
 kinetics in humans influence of adrenaline. J. Physiol. 569: 347–355.
 BeMiller, J.N., Huber, K.C. 2008. Carbihydrates In: Damodaran S, Parkin KL, Fennema OR
 (Ed.), Fennema’s food chemistry. CRC Press Inc., Boca Raton.
 Bhumiratana, N., Adhikari, K., Chambers, I. 2011. Evolution of sensory aroma attributes from
 coffee beans to brewed coffee. LWT. 44: 2185–2192.
 Buffo, R.A., Cardelli-Freire, C. 2004. Coffee flavor: An overview. Flavor Frag J. 19:99–104.
 de Mejia, E.G., Ramirez-Mares, M.V. 2014. Impact of caffeine and coffee on our health.
 Trends in Endoc. Met. 25: 489–492.
 de Paula, J., Farah, A. 2019. Caffeine consumption through coffee: Content in the beverage,
 metabolism, health benefits and risks. Beverages. 5: 37–87.
 Edwards, Q.A., Lunat, I., Neale, L.D.G., Kulikov, S.M. 2015. Distribution of caffeine between
 selected water-organic solvent media. Int. J. Chem. Sci. 13:1218–1226.
 Farah, A., de Paulis, T., Moreira, D.P., Trugo, L.C., Martin, P.R. 2006. Chlorogenic acids and
 lactones in regular and water-decaffeinated arabica coffees. J. Agric. Food Chem.
 54:374–381.
 Geel, L., Kinnear, M., de Kock, H.L. 2005. Relating consumer preferences to sensory attributes
 of instant coffee. J. Food Quality Pref. 16:237–244.
 Geethavani, G., Rameswarudu, M., Reddy, R.R. 2014. Effect of caffeine on heart rate and
 blood pressure. Int. J. Sci. Res. Pub. 4:1–4.
 Ginz, M., Balzer, H.H., Bradbury, A.G., Maier, H.G. 2000. Formation of aliphatic acids by
 carbohydrate degradation during roasting of coffee. Eur. Food Res. Tech. 211:404–410.
Preprints (www.preprints.org) | NOT PEER-REVIEWED | Posted: 15 May 2020 doi:10.20944/preprints202005.0254.v1

 16

 Grosso, G., Stepaniak, U., Topor-Mądry, R., Szafraniec, K., Pająk, A. 2014. Estimated dietary
 intake and major food sources of polyphenols in the Polish arm of the HAPIEE
 study. Nutr. 30: 1398–1403.
 Illy, A., Viani, R. 2005. Espresso coffee: The science of quality (2nd ed.). Elsevier Academic
 Press, London.
 Jokanović, M.R., Džinić, N.R., Cvetković, B.R., Grujić, S., Odžaković, B. 2012. Changes of
 physical properties of coffee beans during roasting. Act. Per. Tech. 43: 21–31.
 Kalschne, D.L., Viegas, M.C., De Conti, A.J., Corso, M.P., de Toledo Benassi, M. 2019. Effect
 of steam treatment on the profile of bioactive compounds and antioxidant activity of
 defective roasted coffee (Coffea canephora). LWT. 99: 364–370.
 Liszt, K.I., Ley, J.P., Lieder, B., Behrens, M., Stöger, V., Reiner, A., Hochkogler, C.M., Köck,
 E., Marchiori, A., Hans, J., Widder, S. 2017. Caffeine induces gastric acid secretion via
 bitter taste signaling in gastric parietal cells. Proc. Nat. Acad. Sci. 114: 6260–6269.
 Malkov, S., Tikka, P., Kuzmin, V., Baltakhinov, V. 2002. Efficiency of chip presteaming result
 of heating and air escape processes. Nord Pulp Paper Res. J. 17: 420–426.
 Maskan, M. 2001. Kinetics of color changes of kiwifruit during hot air and microwave drying.
 J. Food. Eng. 48:169–175.
 Meilgaard, M., Civille, G.V., Carr, B.T. 2016. Sensory Evaluation Techniques. New York,
 CRC Press.
 Mesas, A.E., Leon-Muñoz, L.M., Rodriguez-Artalejo, F., Lopez-Garcia, E. 2011. The effect of
 coffee on blood pressure and cardiovascular disease in hypertensive individuals: a
 systematic review and meta-analysis. Am. J. Clinic Nut. 94: 1113–1126.
 Peker, H., Srinivasan, M.P., Smith, J.M., McCoy, B.J. 2002. Caffeine extraction rates from
 coffee beans with supercritical carbon dioxide. AIChE J. 38: 761–70.
 Pietsch, A. 2017. Decaffeination: process and quality. In Folmer, B. (Eds). The Craft and
 Science of Coffee. Academic Press, San Diego. pp. 225–243.
 Rao, N.Z., Fuller, M. 2018. Acidity and antioxidant activity of cold brew coffee. Sci. Reports.
 8: 1–9.
 Sharma, N. 2014. Free radicals antioxidant and disease. Bio Med. 6: 1–6.
 Shetty, K., Curtis, O.F., Levin, R.E., Witkowsky, R., Ang, W. 1995. Prevention of vitrification
 asociated with in vitro shoot culture of oregano (Origanum vulgare) by Pseudomonas
 spp. J. Plant. Phy. 147: 447–51.
 Stokes, C.N., O’Sullivan, M.G., Kerry, J.P. 2017. Hedonic and descriptive sensory evaluation
 of instant and fresh coffee products. Eur. Food. Res. Tech. 243: 331–340.
Preprints (www.preprints.org) | NOT PEER-REVIEWED | Posted: 15 May 2020 doi:10.20944/preprints202005.0254.v1

 17

 Sunarharum, W.B., Williams, D.J., Smyth, H.E. 2014. Complexity of coffee flavor : A
 compositional and sensory perspective. J. Food. Res. Int. 62: 315–325.
 Takebayashi, J., Oki, T., Watanabe, J., Yamasaki, K., Chen, J., Sato-Furukawa, M., Tsubota-
 Utsugi, M., Taku, K., Goto, K., Matsumoto, T., Ishimi, Y. 2013. Hydrophilic antioxidant
 capacities of vegetables and fruits commonly consumed in Japan and estimated average
 daily intake of hydrophilic antioxidants from these foods. J. Food Comp. Anal. 29: 25–
 31.
 Tavagnacco, L., Schnupf, U., Mason, P.E., Saboungi, M.L., Cesàro, A., Brady, J.W. 2011.
 Molecular dynamics simulation studies of caffeine aggregation in aqueous solution. J
 Physic Chem. B. 115: 10957–10966.
 Widyotomo, S., Mulato, S., Purwadaria, H.K., Syarief, A.M. 2009. Karakteristik proses
 dekafeinasi kopi Robusta dalam reaktor kolom tunggal dengan pelarut etil asetat. Pelita
 Perkebunan. 25: 101–125.
 Willson, C. 2018. The clinical toxicology of caffeine: A review and case study. Tox. Reports. 5:
 1140–1152.
 Yen, G.C., Chen, H.Y. 1995. Antioxidant activity of various tea extracts in relation to their
 anti-mutagenicity. J. Agric. Food. Chem. 43: 27–32.
 Yen, W.J., Wang, B.S., Chang, L.W., Duh, P.D. 2005. Antioxidant properties of roasted coffee
 residues. J. Agric. Food. Chem. 53: 2658–2663.
You can also read