An Attention Mechanism using Multiple Knowledge Sources for COVID-19 Detection from CT Images
←
→
Page content transcription
If your browser does not render page correctly, please read the page content below
An Attention Mechanism using Multiple Knowledge Sources for COVID-19
                           Detection from CT Images
                    Duy M. H. Nguyen,1, 5 Duy M. Nguyen, 2 Huong Vu, 3 Binh T. Nguyen 4
                                  Fabrizio Nunnari, 1 Daniel Sonntag1, 6
                           1
                               German Research Center for Artificial Intelligence, Saarbrücken, Germany
                                      2
                                        School of Computing, Dublin City University, Ireland
                                                3
                                                   University of California, Berkeley
                                  4
                                    VNUHCM-University of Science, Ho Chi Minh City, Vietnam
                                         5
                                           Max Planck Institute for Informatics, Germany
                                                  6
                                                    Oldenburg University, Germany

                           Abstract                                  (Ai et al. 2020). For complementing RT-PCR methods, test-
                                                                     ings based on visual information as X-rays and computed
  Besides principal polymerase chain reaction (PCR) tests, au-       tomography (CT) images are applied by doctors. They have
  tomatically identifying positive samples based on computed
  tomography (CT) scans can present a promising option in
                                                                     demonstrated effectiveness in current diagnoses, including
  the early diagnosis of COVID-19. Recently, there have been         follow-up assessment and prediction of disease evolution
  increasing efforts to utilize deep networks for COVID-19 di-       (Rubin et al. 2020). For instance, a hospital in China utilized
  agnosis based on CT scans. While these approaches mostly           chest CT for 1014 patients and achieved 0.97 of sensitivity,
  focus on introducing novel architectures, transfer learning        0.25 of specificity compared to RT-PCR testing (Ai et al.
  techniques or construction of large scale data, we propose a       2020). Fang et al. (2020) also showed evidences of abnormal
  novel strategy to improve several performance baselines by         CT compatible with an early screening of COVID-19. Ng
  leveraging multiple useful information sources relevant to doc-    et al. (2020) conducted a study on patients at Shenzhen and
  tors’ judgments. Specifically, infected regions and heat-map       Hong Kong and found that COVID-19’s pulmonary mani-
  features extracted from learned networks are integrated with       festation is characterized by ground-glass opacification with
  the global image via an attention mechanism during the learn-
  ing process. This procedure makes our system more robust to
                                                                     occasional consolidation on CT. Generally, these studies sug-
  noise and guides the network focusing on local lesion areas.       gest that leveraging medical imaging may be valuable in the
  Extensive experiments illustrate the superior performance of       early diagnosis of COVID-19.
  our approach compared to recent baselines. Furthermore, our           There have been several deep learning-based systems pro-
  learned network guidance presents an explainable feature to        posed to detect positive COVID-19 on both X-rays and CT
  doctors to understand the connection between input and output      imaging. Compared to X-rays, CT imaging is widely pre-
  in a grey-box model.
                                                                     ferred due to its merit and multi-view of the lung. Further-
                                                                     more, the typical signs of infection could be observed from
                       Introduction                                  CT slices, e.g., ground-glass opacity (GGO) or pulmonary
                                                                     consolidation in the late stage, which provide useful and
Coronavirus disease 2019 (COVID-19) is a dangerous in-
                                                                     important knowledge in competing against COVID-19. Re-
fectious disease caused by severe acute respiratory syn-
                                                                     cent studies focused on three main directions: introducing
drome coronavirus 2 (SARS-CoV-2). It was first recognized
                                                                     novel architectures, transfer learning methods, and building
in December 2019 in Wuhan, Hubei, China, and continu-
                                                                     up a large scale for COVID-19. For the first category, the
ally spread to a global pandemic. According to statistics at
                                                                     novel networks are expected to discriminate precisely be-
Johns Hopkins University (JHU)1 , until the end of August
                                                                     tween COVID and non-COVID samples by learning robust
2020, COVID-19 caused more than 850,000 deaths and in-
                                                                     features and less suffering with high variation in texture,
fected more than 27 million individuals in over 120 countries.
                                                                     size, and location of small infected regions. For example,
Among the COVID-19 measures, the reverse-transcription-
                                                                     Wang et al. (2020) proposed a modified inception neural
polymerase chain reaction (RT-PCR) is regularly used in the
                                                                     network (Szegedy et al. 2015) for classifying COVID-19
diagnosis and quantification of RNA virus due to its accu-
                                                                     patients and normal controls by learning directly on the re-
racy. However, this protocol requires functional equipment
                                                                     gions of interest, which are identified by radiologists based
and strict requirements for testing environments, limiting
                                                                     on the appearance of pneumonia attributes instead of training
the rapid diagnose of suspected subjects. Further, RT-PCR
                                                                     on entire CT images. Although these methods could achieve
testing is reported to suffer from high false-negative rates
                                                                     promising performance, the limited samples could potentially
Copyright © 2021, Association for the Advancement of Artificial      simply over-fit when operating in real-world situations. Thus,
Intelligence (www.aaai.org). All rights reserved.                    in the second and third directions, researchers investigated
    1
      https://coronavirus.jhu.edu/map.html                           several transfer learning strategies to alleviate data deficiency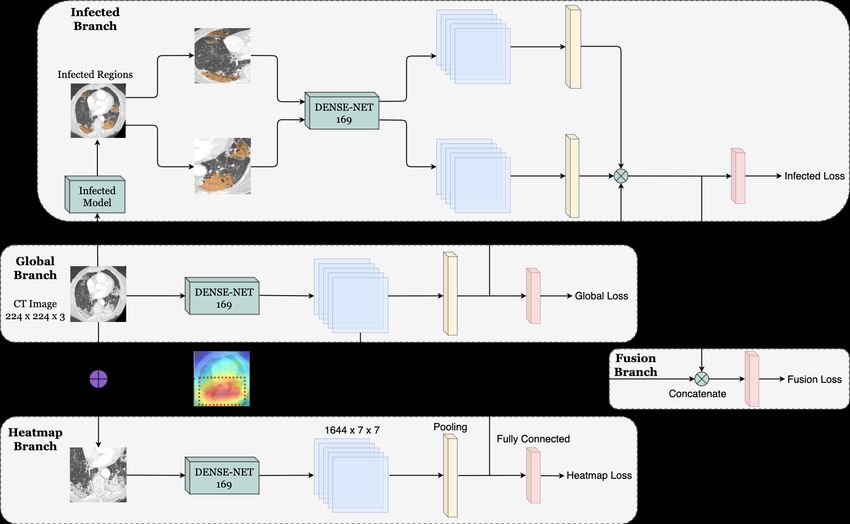
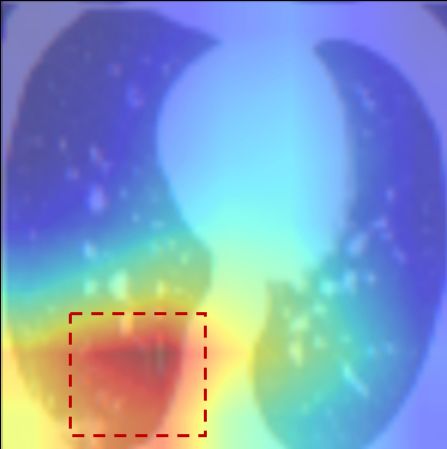
(He et al. 2020) and growing data sources to provide more
large-sized datasets while satisfying privacy concerns and
information blockade (Cohen, Morrison, and Dao 2020; He
et al. 2020). These approaches have also been employed suc-
cessfully in other domains such as skin cancer classification
(Nguyen et al. 2020) or image captions generating in general
medical records (Kalimuthu, Nunnari, and Sonntag 2020).
   Unlike recent works, we aim to answer the question: “how
can we boost the performance of COVID-19 diagnosis algo-          Figure 1: Left: the picture of a COVID-19 case. Middle: red and
rithms by exploiting other source knowledge relevant to a         green labels indicate the Ground-Glass Opacity (GGO) and Pul-
radiologist’s decision?”. Specifically, given a baseline net-     monary Consolidation regions (Fan et al. 2020). Right: heat-map
work, we expect to improve its accuracy by incorporating          region extracted from trained network.
properly two important knowledge sources: an infected and
a heat-map region without modifying its architecture. In our
settings, infected regions refer to positions of Pulmonary          ing a new state-of-the-art achievement.
Consolidation Region (PCR) (as shown in figure 1 at the
middle, green regions), a type of lung tissue filling with liq-   • We show the transparency of learned features by embed-
uid instead of air; and Ground-Glass Opacity (GGO), an              ding the last layer’s output vector in the fusion branch
area of increased attenuation in the lung on CT images with         to smaller space and visualizing in a 3-D dimension (as
preserved bronchial and vascular markings (as depicted in           shown in figure 3). Interestingly, we found a strong con-
figure 1 at the middle, red regions). By quantifying those          nection between learned features and network decisions as
regions, the radiologists can distinguish normal and infected       mapping of activation heat-map and infected regions. Such
COVID-19 tissues. While infected areas are based on med-            property is a critical point for clinicians as end-users, as
ical knowledge, we refer to heat-map (as shown in figure 1          they can interpret how networks create a result given input
at the right-hand side) as a region extracted from a trained        features in a grey-box rather than a black-box algorithm.
network, which allows us to understand transparently essen-
tial parts in the image directly impact the network decision.                           Related Works
Our method motivates from the two following ideas. Firstly,       In a global effort against COVID-19, the computer vision
we would like to simulate how a radiologist can comprehen-        community pays attention on constructing efficient deep
sively consider both global, local information, and their prior   learning approaches to perform screening of COVID-19 in
knowledge to make final judgments by associating global           CT scans. Zheng et al. (2020) pioneered in introducing a
images, infected regions, and heat-maps during the training       novel 3D-deep network (DeCoVNet) composed from pre-
process. Secondly, for avoiding network suffering by a sig-       trained U-net (Ronneberger, Fischer, and Brox 2015) and two
nificant level of noise outside the lesion area, an attention     3D residual blocks. To reduce annotating costs, the authors
mechanism to supervise the network is necessarily such that       employed weakly-supervised based computer-aided COVID-
it can take both lesion regions and global visual information     19 detection with a large number of CT volumes from the
into account for a final decision.                                frontline hospital. Other methods also applied 3D deep net-
   We introduce an attention mechanism to integrate all visual    works for CT images can be found in (Gozes et al. 2020; Li
cues via a triplet stream network to realize those ideas. Our     et al. 2020). Recently, there are also two other state of the
method can be highlighted in two attributes. First, it has two    art works from Saeedi, Maryam, and Maghsoudi (2020) and
dedicated local branches to focus on local lesion regions, one    Mobiny et al. (2020), which trained directly on 2D images on
for infected and another for heat-map areas. In this manner,      a dataset collected from He et al. (2020) with 746 CT samples.
the noise’s influence in the non-disease areas and missing        While Saeedi, Maryam, and Maghsoudi (2020) developed
essential structures can be alleviated. Second, our principal     a novel method by combining several pre-trained networks
branches, i.e., a global branch and two local branches, are       on ImageNet with regularization of support vector machine,
connected by a fusion branch. While the local branches rep-       Mobiny et al. (2020) proposed a novel network, namely DE-
resent the attention mechanism, it may lead to information        CAPS, by leveraging the strength of Capsule Networks with
loss when the lesion areas are scattered in the whole image.      several architecture to boost classification accuracies. In other
Therefore, a global component is demanded to compensate           trends, Song et al. (2020) developed CT diagnosis to support
for this error. We reveal that the global and local branches      clinicians to identify patients with COVID-19 based on the
complement each other by the fusion branch, which shows           presence of Pneumonia feature.
better performance than the current state-of-the-art methods.        To mitigate data deficiency, Chen et al. (2020) built a
   In summary, we make two following contributions:               publicly-available dataset containing hundreds of CT scans
 • We provide a new procedure to advance baselines on             that are positive for COVID-19 and introducing a novelty
   COVID-19 diagnosis without modifying the network’s             sample-efficient method based on both pre-trained ImageNet
   structures by integrating knowledge relevant to radiolo-       (Deng et al. 2009) and self-supervised learning. In the same
   gists’ judgment as examining a suspected patient. Exten-       effort, Cohen, Morrison, and Dao (2020) also contributes
   sive experiments demonstrate that the proposed method          to open image data collection, created by assembling med-
   can boost several cutting-edge models’ performance, yield-     ical images from websites and publications. While recent
networks only tackle in a sole target, e.g., only diagnosis or       ResNet50 backbone (He et al. 2016). This additional model
compute infected regions. In contrast, we bring those compo-         was expected to learn the discriminative information from
nents into a single system by fusing straight infected areas         a specific CT scan area instead of the entire image, hence
and global images throughout the learning-network proce-             alleviating noise problems.
dure so that these sources can support each other to make our           A lesion region of a CT scan, which could be considered
model more robust and efficient.                                     as an attention heat-map, was extracted from the last convolu-
                                                                     tion layer’s output before computing the global pooling layer
                       Methodology                                   of the backbone (DenseNet169 or ResNet50) in the main
                                                                     branch. In particular, with an input CT image, let fk (x, y) be
Fusion with Multiple Knowledge                                       the activation unit in the channel k at the spatial (x, y) of the
Infected Branch Fan et al. (2020) developed methods to               last CNN layer, in which k ∈ {1, 2, ..., K} and K = 1644
identify lung areas that are infected by ground-class opacity        for DenseNet169 or K = 2048 for ResNet50 as a backbone.
and consolidation by presenting a novel architecture, namely         Its attention heat-map, H, is created by normalizing across k
Inf-Net. Given the fact that there is a strong correlation be-       channels of the activation output by using Eq. 1.
tween the diagnosis of COVID-19 and ground-class opacity                                     P                    P
presented in lung CT scans. Therefore, we adopt the Semi-                                      k fk (x, y) − min( k fk )
                                                                                H(x, y) =                  P                       (1)
Infected-Net method from (Fan et al. 2020) to localize lung                                          max( k fk )
areas suffered by ground-class opacity and consolidation on          We then binarized H to get the mask B of the suspected
our CT images. In particular, we expect using this quantifi-         region in Eq. 2, where τ is a tuning parameter whose smaller
cation to reduce focused regions of our model to important           value produces a larger mask, and vice versa.
positions, thus making the system learn efficiently.                                         (
   Following approach based on semi-supervised data in (Fan                                      1, if H(x, y) > τ
et al. 2020), we extend it in the diagnosis task by first training                     B=                                         (2)
                                                                                                 0, otherwise
the Inf-Net on D1 dataset (please see Section Data for further
reference). Then, we use this model to obtain pseudo label           We then extracted a maximum connected region in B and
segmentation masks for 100 randomly chosen CT images                 mapped with the original CT scan to get our local branch’s
from D2 and D3 datasets. After that, we combine the newly            final input. One can see a typical example of the heat-map
predicted masks with D1 as a new training set and re-train           area in figure 1 on the right-hand side. Given this output and
our model. The re-trained model will continue to be used for         coupling with an infected model M obtaining from algorithm
segmenting other 100 ones randomly chosen from the remain-           1, we now have enough input to start training the proposed
ing D2 and D3. Then, we repeated this data combining step.           model.
The cycle continues until all images from D2 and D3 have a
segmentation mask. We summarize the whole procedure in               Network Design and Implementation
algorithm 1.                                                         Multi-Stream network Our method’s architecture can be
                                                                     illustrated in figure 2, with DenseNet169 as an example of
  Algorithm 1: Training Semi-supervised Infected Net                 the baseline model. It has three principal branches, i.e., the
                                                                     global and two local branches for attention lesion structures,
   Input: Dtrain = D1 with segmentation masks and
                                                                     followed by a fusion branch at the end. Both the global and lo-
            Dtest = D2 ∪ D3 without masks.
                                                                     cal branches play roles as classification networks that decide
   Output: Trained Infected Net model, M
                                                                     whether the COVID-19 is present. Given a CT image, the
 1 Set Dtrain = D1; Dtest = D2 ∪ D3; Dsubtest = NULL
                                                                     parameters of Global Branch are first fine-tuned by loading
 2 while len(Dtest ) > 0 do
                                                                     either pre-trained ImageNet or Self-transfer learning tactics
 3     Train M
                                                                     as in (He et al. 2020), and continue to train on global images.
 4     if len(Dtest > 100) then
                                                                     Then, heat-map regions from the global image extracted us-
 5          Dsubtest = random ( Dtest \Dsubtest , k = 100)
                                                                     ing equations (1) and (2) are utilized as an input to train on
 6          Dtrain = Dtrain ∪ M (Dsubtest )
                                                                     heat-map Branch. In the next step, input images at the Global
 7          Dtest = Dtest \Dsubtest
                                                                     Branch are fed into Infected-Model M , which is derived after
 8     else                                                          completing the training procedure in algorithm 1, to produce
 9          Dsubtest = Dtest                                         infected regions. Because these lesion regions are relatively
10          M (Dsubtest )                                            small, disconnected, and distributed on the whole image, we
11          Dtest = Dtest \Dsubtest                                  find bounding boxes to localize those positions and divide it
                                                                     into two sub-regions: left infected and right infected photos.
                                                                     Those images can be fed into a separate backbone network
                                                                     to output two pooling layers and then concatenating with
Heat-map Branch Besides the whole original scans of CT               pooling features from the global branch to train for Infected
images, we wanted our proposed network to pay more at-               Branch. It is essential to notice that concatenating output fea-
tention to injured regions within each image by building a           tures from Infected Branch with global features is necessary
heat-map branch, which was a separate traditional classi-            since, in several cases, e.g., in healthy patients, we could not
fication structure as DenseNet169 (Huang et al. 2017) or             obtain infected regions. Finally, the Fusion Branch can be
Figure 2: Our proposed attention mechanism given a specific backbone network to leverage efficiently three knowledge sources: infected
regions (top branch), global image (middle branch) and learned heat-maps (bottom branch). For all branches, we utilize a binary cross entropy
loss function during the training process. The backbone network (DenseNet-169 in this figure) can be replaced by arbitrary networks in general
case.
learned by merging all pooling layers from both global and P oolf = [P oolg , P oolh , P oolin ]. After that, we evaluate
two local branches. pf (c|(Ig , Ih , Iin ) by multiplying P oolf with weights at F C
To be tighter, we assume that each pooling layer layer. Finally, Wf can be learned by minimizing equation (3)
is followed by a fully connected layer F C with with formula (4).
C− dimensional for all branches and a sigmoid
layer is added to normalize the output vector. Denot- Training Strategy Due to the limited amount of COVID-
ing (Ig , Wg , pg (c|Ig )), (Ih , Wh , ph (c|Ig , Ih )), and 19 CT scans, it is not suitable to simultaneously train entire
(Iin , Win , pin (c|Ig , Iin )) as pairs of images, param- branches. We thus proposed a strategy that trains each part
eters and probability scores belong to the c-th class, sequentially to reduce the number of parameters being trained
c ∈ {1, 2 ..., C} at F C layer for global, heat-map and at once. As a branch finished its training stage, its weights
infected branches, respectively. For each fushion branch, would be used to initialize the next branches. Our training
we also denote (P oolk , Wf , pf (c|(Ig , Ih , Iin )) as a pair of protocol can be divided into three stages, as follows:
output feature at pooling layer in branch k (k ∈ {g, h, in}), Stage I: We firstly trained and fine-tuned the global branch,
parameter and probability scores belong to the c-th class of which used architectures from an arbitrary network such as
the fusion branch. Then, parameters Wg , Wh , and Win are DenseNet169 or ResNet50. The weight initialization could
optimized by minimizing the binary cross-entropy loss as be done by loading pre-trained ImageNet or Self-Transfer
follows: learning method (He et al. 2020).
C Stage II: Based on the converged global model, we then
1 X created attention heat-map images to have the input for the
L(Wi ) = − lc log(p̃i (c)) + (1 − lc ) log(1 − p̃i (c)),
C c=1 heat-map branch, which was fine-tuned based on the hyper-
(3) parameter τ as described in section Heat-map Branch. Simul-
where lc is the ground-truth label of the c-th class, C is the taneously, we could also train the infected branch indepen-
total of classes, and p̃i (c) is the normalized output network dently with the heat-map branch using the pooling features
at branch i (i ∈ {g, h, in}), which can be computed by: produced by the global model, as illustrated in figure 2. The
weights of the global model were kept intact during this
p˜i (c) = 1/(1 + exp(−pi (c|Ig , Ih , Iin ) (4)
phrase.
in which Stage III: Once the infected branch and the heat-map
(
pg (c|Ig ) if i = g branch were fine-tuned, we concatenated their pooling fea-
pi (c|Ig , Ih , Iin ) = ph (c|Ig , Ih ) if i = h (5) tures and trained our final fusion branch with a fully con-
pin (c|Ig , Iin ) if i = in nected layer for the classification. All weights of other
branches were still kept frozen while we trained this branch.
For the fusion branch, we have to compute the pooling fu- The overall training procedure was summarized in algo-
sion P oolf by merging all pooling values in all branches: rithm 2. Different training configurations might affect theperformance of our system. Therefore, we analyzed this im- Settings
pact from variation training protocol in experiment results. We implemented several experiments on a TITAN RTX GPU
with the Pytorch framework. The optimization used SGD
with a learning rate of 0.01 and is divided by ten after 30
Algorithm 2: Training our proposed system epochs. We configured a weight decay of 0.0001 and a mo-
Input: Input image Ig , Label vector L, Threshold τ mentum of 0.9. For all baseline networks, we used a batch
Output: Probability score pf (c|Ig , Ih , Iin ) size of 32 and training for each branch 50 epochs with input
1 Learning Wg with I, computing p˜g (c|Ig ), optimizing size 224 × 224. The best model is chosen based on early stop-
by Eq. 3 (Stage I); ping on validation sets. We optimized hyper-parameters τ by
2 Finding attention heat-map and its mapped image Ih grid searching with 0.75, which yielded the best performance
of Ig by Eq. 2 and Eq. 1. on the validation set.
3 Learning Wh with Ih , computing p˜h (c|Ig , Ih ),
optimizing by Eq. 3 (Stage II); Method Accuracy F1 AUC
4 Finding infected images Iin of Ig by using infected ResNet50 (1)
(ImgNet, Global) 0.803 0.807 0.884
model M ; DenseNet169 (1) (ImgNet, Global) 0.832 0.809 0.868
5 Learning Win with Iin , computing p˜ in (c|Ig , Iin ), ResNet50 (1) + Our Infected 0.831 0.815 0.897
optimizing by Eq. 3 (Stage II); ResNet50 (1) + Our heat-map 0.824 0.832 0.884
6 Computing the concatenated P oolf , learning Wf , ResNet50 (1) + Our Fusion 0.843 0.822 0.919
computing pf (c|Ig , Ih , Iin ), optimizing by Eq. 3
DenseNet169 (1) + Our Infected 0.861 0.834 0.911
(Stage III).
DenseNet169 (1) + Our heat-map 0.855 0.825 0.892
DenseNet169 (1) + Our Fusion 0.875 0.845 0.927
Table 1: Performance of two best architectures on D3 dataset using
Experiment and Results pre-trained ImageNet with only used global images (ResNet50 (1) ,
This section presents our settings, chosen datasets, and the DenseNet169 (1) ) and obtained results by utilizing our strategy.
corresponding performance of different methods. Blue and Red colour are best values for ResNet50 and DenseNet169
correspondingly.
Data
Method Accuracy F1 AUC
In our research, we use three sets of data. ResNet50 (2) (Self-trans , Global) 0.841 0.834 0.911
• D1. COVID-19 CT Segmentation from “COVID-19 CT DenseNet169 (2) (Self-trans , Global) 0.863 0.852 0.949
segmentation dataset”2 . ResNet50 (2) + Our Infected 0.842 0.833 0.918
This collection contains 100 axial CT images of more ResNet50 (2) + Our heat-map 0.879 0.848 0.924
than 40 COVID-19 patients with labeled lung area and ResNet50 (2) + Our Fusion 0.861 0.870 0.927
associating with ground-class opacity, consolidation, and DenseNet169 (2) + Our Infected 0.853 0.849 0.948
pleural effusion . DenseNet169 (2) + Our heat-map 0.870 0.837 0.954
DenseNet169 (2) + Our Fusion 0.882 0.853 0.964
• D2. COVID-19 CT Collection from (Fan et al. 2020).
This dataset includes 1600 CT slices, extracted from 20 Table 2: Performance of two best architectures on D3 dataset
CT volumes of different COVID-19 patients. Since these using Self-trans with only used global images (ResNet50 (2) ,
images are extracted from CT volumes, they do not have DenseNet169 (2) ) and obtained results by utilizing our strategy.
segmentation masks. Blue and Red colour are best values for ResNet50 and DenseNet169
• D3. Sample-Efficient COVID-19 CT Scans from (He et al. correspondingly.
2020).
Evaluations
This data comprises 349 positive CT images from 216
COVID-19 patients and 397 negative CT images selected In this section, we evaluated our attention mechanism with
from the PubMed Central3 and publicly-open online medi- different settings, such as semi-supervised procedure (al-
cal image database4 . D3 also does not have segmentation gorithm 1) and training strategies (algorithm 2) on the D3
masks; only COVID-19 positive/negative labels are in- dataset. We also illustrated how our framework allowing to
volved. boost the performance of several baseline networks without
modifying their architectures.
For all experiments, we exploited all datasets for training
the Infected-Net model while detection performance was Improving on Standard Backbone Networks We first ex-
evaluated on the D3 dataset. amined our approach’s effectiveness on commonly deep net-
works like VGG-16, ResNet-18, ResNet-50, DenseNet-169,
2
https://medicalsegmentation. com/covid19/ and EfficientNet-b0. Based on summarized results from (He
3
https://www.ncbi.nlm.nih.gov/pmc/ et al. 2020), we picked two top networks that achieved the
4
https://medpix.nlm.nih.gov/home highest results on the D3 dataset and configuring them inMethod Accuracy F1 AUC
Saeedi et al. 2020 0.906 (±0.05) 0.901 (±0.05) 0.951 (±0.03)
Saeedi et al. 2020 + Our Fusion w/out Semi-S 0.913 (±0.03) 0.926 (±0.03) 0.960 (±0.03)
Saeedi et al. 2020 + Our Fully Fusion 0.925 (±0.03) 0.924 (±0.03) 0.967 (±0.03)
Mobiny et al. 2020 (1) 0.832 (±0.03) 0.837 (±0.03) 0.927 (±0.02)
Mobiny et al. 2020 (1) + Our Fusion w/out Semi-S 0.856 (±0.03) 0.864 (±0.03) 0.950 (±0.02)
Mobiny et al. 2020 (1) + Our Fully Fusion 0.868 (±0.03) 0.872 (±0.03) 0.947 (±0.02)
Mobiny et al. 2020 (2) 0.876 (±0.01) 0.871 (±0.02) 0.961 (±0.01)
Mobiny et al. 2020 (2) + Our Fusion w/out Semi-S 0.885 (±0.01) 0.884 (±0.02) 0.983 (±0.01)
Mobiny et al. 2020 (2) + Our Fully Fusion 0.896 (±0.01) 0.889 (±0.01) 0.986 (±0.01)
Table 3: Performance of other state-of-the-art methods from (Saeedi, Maryam, and Maghsoudi 2020) (the first row) and (Mobiny et al. 2020)
(two options are represented by the fourth and seventh row) with only used global images and obtained results by utilizing our strategy with
multiple knowledge sources. Blue, red and bold colors represent the best values in each method.
our framework under two settings: initializing weights from train global, heat-map, and infected together. These results
pre-trained ImageNet or self-transfer techniques proposed in can be found in table 4 appendix. In general, training for
(He et al. 2020). We first used only global images for cases each component sequentially is the most efficient case. This
and then added one by one other option as heat-map, Infected, phenomenon might be due to the lack of the data as training
and Fusion branch to capture each component’s benefits. Fur- the whole complex network simultaneously with the limited
thermore, the proposed training strategy (algorithm 2) and resources was not a suitable schema. Thus, training each
semi-supervised techniques (algorithm 1) were also involved. branch independently and then fusing them can be the right
choice in such situations.
Fusion Branch: From both table 1 and table 2, it is clear Improving on State of The Art In this experiment, we
that our fusion mechanism with ResNet50 and DenseNet169 aim to further evaluate the proposed method’s effectiveness
has significantly improved performance compared to the de- by integrating the current state-of-the-art methods on the
fault settings (only used global images) for all categories: D3 dataset. This includes three methods, one from (Saeedi,
pre-trained ImageNet and Self-Transfer Learning. By em- Maryam, and Maghsoudi 2020) and two others from (Mobiny
ploying pre-trained ImageNet with ResNet50 backbone, our et al. 2020). Specifically, we used trained models following
fusion method increases the accuracy from 80.3% to 84.3%, descriptions of authors and available code to plug in our
which is slightly better than this network’s accuracy using framework. The experimental results in table 3 were calcu-
Self-Transfer Learning (84.1%). Similarly, for DenseNet169 lated as the experimental design of each paper, for instance,
with pre-trained ImageNet, our fusion method can improve ten-fold cross-validation in (Saeedi, Maryam, and Maghsoudi
the performance from 83.2% to 87.5% in terms of accuracy. 2020) and average of the best five trained model checkpoints
This accuracy once again is better than the option using Self- in (Mobiny et al. 2020). Furthermore, the contribution of
Transfer Learning (86.3%). Our fusion method’s outstanding the semi-supervised strategy was also evaluated in various
performance is also consistent for two other metrics as AUC metrics for each method.
and F1 . With Self-Transfer (table 2), we continue boosting
performance for both ResNet50 and DenseNet169, especially Performance of Fully Settings: “Fully settings” refers to
with the DenseNet169, a new milestone with 88.2% and utilizing the training method as in algorithm 2 with fusing
96.4% in Accuracy and AUC metrics is achieved, which is all branches. Interestingly, our attention method continues
higher 2% compared to the original one. improving for all of these state of the art methods, resulting
Mixing Global and Local Branch: Using Infected infor- in obtaining a new benchmark without modifying available
mation or heat-map with the baseline can boost the result architectures. Specifically, we boosted approximately 2% for
from 3 - 4%. For instance, the Global-Infected structure for the method in (Saeedi, Maryam, and Maghsoudi 2020) (from
ResNet50 with pre-trained ImageNet (table 1) improves the 90.6% to 92.5%) and second option in (Mobiny et al. 2020)
exactness from 80.3% to 83.1%. The Global-heat-map in- (from 87.6% to 89.6%) in terms of accuracy metric. It is even
creases ResNet50 with Self-Trans initialization (table 2) from better for the first option of (Mobiny et al. 2020) with an im-
84.1% to 87.9%. However, overall, there is no pattern to con- provement up to 3.6% (from 83.2% to 86.8%). This benefit
clude if either the Infected or heat-map branch outperforms was also attained for other metrics as F1 and AUC. In short,
the other. Furthermore, in most cases, the best values across this evidence once again confirmed the proposed method’s
metrics are obtained using the Fusion branch. This evidence effectiveness. A better result can be obtained by just using
demonstrates that using more relative information, more ac- an available trained model and inserting it into our frame-
curate predictions the model could make. work. In other words, our attention mechanism can be played
as an “enhancing technique” in which the performance of
Peformance of Training Strategies: To validate the impact a specific method can be improved by integrating properly
of the proposed training strategy (algorithm 2), we tested multiple useful information relevant to doctors’ judgments
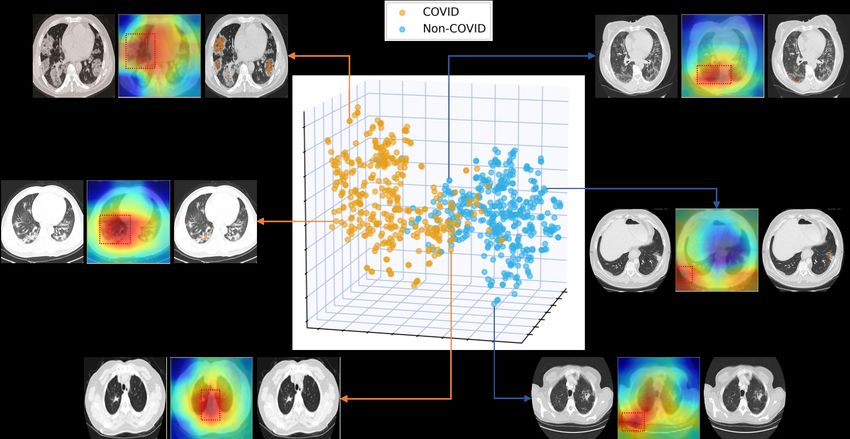
with various settings, for example, train all branches together, by our framework.Figure 3: Interpreting learned features by t-SNE with the final layers of the fusion branch. Each point is presented together with its original
scan, class activation map (CAM) representation, and infected regions (left to right order). For Covid and Non-Covid cases whose distance is
far away from a decision margin, important heat-map regions (inside the rectangle) locate inside/outside the lung regions (zooming for better
visualization). For points locating near the boundary margin, the heat-map area overlaps both the lung and non-lung area, which indicates for
uncertainty property of the network’s decision.
Performance of Semi-Supervised: The advantages of ap- one of the significant risk factors for COVID-19 patients
plying semi-supervised in final performance are also pre- (Rajinikanth et al. 2020). Meanwhile, the infected branch
sented in table 3. Accordingly, without using semi-supervised also provides useful information by discovering the lungs’
tactics contributes a smaller improvement to the arts in most unnormal parts (colored in orange). While these lesions are
cases. Excepting the cases of (Saeedi, Maryam, and Magh- rarely present or appear sparingly in healthy cases, it is clear
soudi 2020) with F1 and the first version of (Mobiny et al. that this feature plays an important factor in assessing the pa-
2020) with AUC metric, without semi-supervised is better, tient’s condition. Finally, given data points distributed close
however the difference is not significantly compared to fully to the margin separate the COVID-19 and non-COVID cases,
settings. learned heat-map regions overlapped for both lung and non-
lung regions, indicating the uncertainty of the model’s pre-
Interpretable Learned Features diction. In such situations, utilizing other tests to validate
results and the clinician’s experience is a necessary factor in
Besides high performance, an ideal algorithm should be ex- evaluating the patient’s actual condition instead of just rely-
plainable to doctors about its connection between learned ing on the diagnosis of the model. For this property, we once
features and the final network decision (Sonntag, Nunnari, again understand the importance of an explainable model.
and Profitlich 2020, Zhang et al. 2017). Such property is criti- Without such information, we have a high risk of making mis-
cal, especially in medical applications; thereby the reliability takes using automated systems while we could not predict all
is the most concerning factor (Profitlich and Sonntag 2019). possible situations.
Furthermore, in our experiment, given that the D3 dataset
only contains two classes Covid or Non-Covid, understanding
how the model makes a decision is even more critical because Conclusion
it allows doctors to believe or not predict the trained model. In this paper, we have presented a novel approach to im-
To answer this question, we interpret our learned features prove deep learning-based systems for COVID-19 diagnosis.
by generating the class activation map (CAM) (Zhou et al. Unlike previous works, we got inspired by considering ra-
2016) of the fusion branch and applied t-Distributed Stochas- diologists’ judgments when examining COVID-19 patients;
tic Neighbor Embedding (t-SNE) (Maaten and Hinton 2008) thereby, relevant information such as infected regions or heat-
method for visualization by compressing 1644-dimensional maps of injury area is judged for the final decision. Extensive
features (DenseNet169 case with Self-Trans) into a 3D space. experiments showed that leveraging all visual cues yields
Figure 3 depicts the pooling features’ distribution on testing improved performances of several baselines, including two
images of the D3 dataset using t-SNE and CAM representa- best network architectures from (He et al. 2020) and three
tions. Furthermore, infected regions were also shown with other state-of-the-art methods from recent works. Last but
their corresponding CT images. not least, our learned features provide more transparency of
By considering CAM color and its corresponding labels, the decision process to end-users by visualizing positions of
figure 3 indicated that for data points whose positions are far attention map. As effective treatments are developed, CT im-
from the margin decision (both left and right), our system ages may be combined with additional medically-relevant and
could focus precisely regions within the lesion lung area for transparent information sources. In future research, we will
positive scans and vice versa, the red heat-map parts locate continue to investigate this in a large-scale study to improve
outside the lungs for healthy cases. This finding matches the proposed system’s performance towards explainability as
the clinical literature that lesion regions inside the lung are an inherent property of the model.Acknowledgments [12] Li, L.; Qin, L.; Xu, Z.; Yin, Y.; Wang, X.; Kong, B.;
This research has been supported by the Ki-Para-Mi Bai, J.; Lu, Y.; Fang, Z.; Song, Q.; et al. 2020. Artificial
project (BMBF, 01IS19038B), the pAItient project (BMG, intelligence distinguishes COVID-19 from community
2520DAT0P2), and the Endowed Chair of Applied Artificial acquired pneumonia on chest CT. Radiology .
Intelligence, Oldenburg University. We would like to thank [13] Maaten, L. v. d.; and Hinton, G. 2008. Visualizing data
all student assistants that contributed to the development of using t-SNE. Journal of machine learning research
the platform, see iml.dfki.de. 9(Nov): 2579–2605.
[14] Mobiny, A.; Cicalese, P. A.; Zare, S.; Yuan, P.; Abav-
References isani, M.; Wu, C. C.; Ahuja, J.; de Groot, P. M.; and
[1] Ai, T.; Yang, Z.; Hou, H.; Zhan, C.; Chen, C.; Lv, W.; Van Nguyen, H. 2020. Radiologist-Level COVID-19
Tao, Q.; Sun, Z.; and Xia, L. 2020. Correlation of Detection Using CT Scans with Detail-Oriented Cap-
chest CT and RT-PCR testing in coronavirus disease sule Networks. arXiv preprint arXiv:2004.07407 .
2019 (COVID-19) in China: a report of 1014 cases.
[15] Ng, M.-Y.; Lee, E. Y.; Yang, J.; Yang, F.; Li, X.; Wang,
Radiology 200642.
H.; Lui, M. M.-s.; Lo, C. S.-Y.; Leung, B.; Khong, P.-L.;
[2] Chen, T.; Kornblith, S.; Norouzi, M.; and Hinton, G. et al. 2020. Imaging profile of the COVID-19 infection:
2020. A simple framework for contrastive learning of vi- radiologic findings and literature review. Radiology:
sual representations. arXiv preprint arXiv:2002.05709 Cardiothoracic Imaging 2(1): e200034.
.
[16] Nguyen, D. M. H.; Ezema, A.; Nunnari, F.; and Son-
[3] Cohen, J. P.; Morrison, P.; and Dao, L. 2020. COVID-19 ntag, D. 2020. A Visually Explainable Learning System
image data collection. arXiv preprint arXiv:2003.11597 for Skin Lesion Detection Using Multiscale Input with
. Attention U-Net. In German Conference on Artificial In-
[4] Deng, J.; Dong, W.; Socher, R.; Li, L.-J.; Li, K.; and telligence (Künstliche Intelligenz), 313–319. Springer.
Fei-Fei, L. 2009. Imagenet: A large-scale hierarchical [17] Profitlich, H.-J.; and Sonntag, D. 2019. Interactivity
image database. In 2009 IEEE conference on computer and Transparency in Medical Risk Assessment with
vision and pattern recognition, 248–255. Ieee. Supersparse Linear Integer Models. arXiv preprint
[5] Fan, D.-P.; Zhou, T.; Ji, G.-P.; Zhou, Y.; Chen, G.; Fu, arXiv:1911.12119 .
H.; Shen, J.; and Shao, L. 2020. Inf-Net: Automatic [18] Rajinikanth, V.; Dey, N.; Raj, A. N. J.; Hassanien, A. E.;
COVID-19 Lung Infection Segmentation from CT Im- Santosh, K.; and Raja, N. 2020. Harmony-search and
ages. IEEE Transactions on Medical Imaging . otsu based system for coronavirus disease (COVID-19)
[6] Fang, Y.; Zhang, H.; Xie, J.; Lin, M.; Ying, L.; Pang, P.; detection using lung CT scan images. arXiv preprint
and Ji, W. 2020. Sensitivity of chest CT for COVID-19: arXiv:2004.03431 .
comparison to RT-PCR. Radiology 200432. [19] Ronneberger, O.; Fischer, P.; and Brox, T. 2015. U-
[7] Gozes, O.; Frid-Adar, M.; Greenspan, H.; Browning, net: Convolutional networks for biomedical image seg-
P. D.; Zhang, H.; Ji, W.; Bernheim, A.; and Siegel, E. mentation. In International Conference on Medical
2020. Rapid ai development cycle for the coronavirus image computing and computer-assisted intervention,
(covid-19) pandemic: Initial results for automated detec- 234–241. Springer.
tion & patient monitoring using deep learning ct image [20] Rubin, G. D.; Ryerson, C. J.; Haramati, L. B.; Sverzel-
analysis. arXiv preprint arXiv:2003.05037 . lati, N.; Kanne, J. P.; Raoof, S.; Schluger, N. W.; Volpi,
[8] He, K.; Zhang, X.; Ren, S.; and Sun, J. 2016. Deep A.; Yim, J.-J.; Martin, I. B.; et al. 2020. The role of chest
residual learning for image recognition. In Proceedings imaging in patient management during the COVID-19
of the IEEE conference on computer vision and pattern pandemic: a multinational consensus statement from
recognition, 770–778. the Fleischner Society. Chest .
[9] He, X.; Yang, X.; Zhang, S.; Zhao, J.; Zhang, Y.; Xing, [21] Saeedi, A.; Maryam, S.; and Maghsoudi, A. 2020. A
E.; and Xie, P. 2020. Sample-Efficient Deep Learning novel and reliable deep learning web-based tool to de-
for COVID-19 Diagnosis Based on CT Scans. medRxiv tect COVID-19 infection form chest CT-scan. arXiv
. preprint arXiv:2006.14419 .
[10] Huang, G.; Liu, Z.; Van Der Maaten, L.; and Wein- [22] Song, Y.; Zheng, S.; Li, L.; Zhang, X.; Zhang, X.;
berger, K. Q. 2017. Densely connected convolutional Huang, Z.; Chen, J.; Zhao, H.; Jie, Y.; Wang, R.; et al.
networks. In Proceedings of the IEEE conference on 2020. Deep learning enables accurate diagnosis of novel
computer vision and pattern recognition, 4700–4708. coronavirus (COVID-19) with CT images. medRxiv .
[11] Kalimuthu, M.; Nunnari, F.; and Sonntag, D. 2020. A [23] Sonntag, D.; Nunnari, F.; and Profitlich, H.-J. 2020.
Competitive Deep Neural Network Approach for the The Skincare project, an interactive deep learning sys-
ImageCLEFmed Caption 2020 Task. arXiv preprint tem for differential diagnosis of malignant skin lesions.
arXiv:2007.14226 . Technical Report. arXiv preprint arXiv:2005.09448 .[24] Szegedy, C.; Liu, W.; Jia, Y.; Sermanet, P.; Reed, S.; Appendix
Anguelov, D.; Erhan, D.; Vanhoucke, V.; and Rabi-
novich, A. 2015. Going deeper with convolutions. In Peformance of Training Strategies
Proceedings of the IEEE conference on computer vision
and pattern recognition, 1–9. Training Global-Infected Global-Heatmap Fusion
[25] Wang, S.; Kang, B.; Ma, J.; Zeng, X.; Xiao, M.; Guo, GHIF 0.822 0.813 0.844
J.; Cai, M.; Yang, J.; Li, Y.; Meng, X.; et al. 2020. A GHI-F 0.834 0.841 0.869
deep learning algorithm using CT images to screen for G-H-I-F 0.847 0.875 0.871
Corona Virus Disease (COVID-19). MedRxiv .
[26] Zhang, Z.; Xie, Y.; Xing, F.; McGough, M.; and Yang, L. Table 4: The performance of branches under changing of training
2017. Mdnet: A semantically and visually interpretable strategies is described in algorithm 2. The results are reported by
medical image diagnosis network. In Proceedings of computing the average accuracy of DenseNet169 and ResNet50 with
the IEEE conference on computer vision and pattern Self-Trans. G: global branch, H: heatmap branch, I: infected branch,
recognition, 6428–6436. and F: fusion branch. GHIF denotes for training all components
together; GHI-F denotes for training global, heatmap, and infected
[27] Zheng, C.; Deng, X.; Fu, Q.; Zhou, Q.; Feng, J.; Ma, simultaneously then continue training fusion branch. Finally, G-H-
H.; Liu, W.; and Wang, X. 2020. Deep learning-based I-F indicates for training each part sequentially.
detection for COVID-19 from chest CT using weak
label. medRxiv .
[28] Zhou, B.; Khosla, A.; A., L.; Oliva, A.; and Torralba,
A. 2016. Learning Deep Features for Discriminative
Localization. CVPR .You can also read