Collaborative E-Learning Process Discovery in Multi-tenant Cloud - MECS Press
←
→
Page content transcription
If your browser does not render page correctly, please read the page content below
I.J. Intelligent Systems and Applications, 2021, 2, 21-37
Published Online April 2021 in MECS (http://www.mecs-press.org/)
DOI: 10.5815/ijisa.2021.02.02

Collaborative E-Learning Process Discovery in
Multi-tenant Cloud
Sameh. Azouzi
ISITCOM Hammam Sousse, University of Sousse, Sousse, Tunisia
Laboratory RIADI, ENSI, University of Manouba, Manouba, Tunisia
E-mail: Azouzi_sameh@yahoo.fr

Jalel eddine. Hajlaoui
MARS Research Laboratory, University of Sousse, Tunisia
E-mail: hajlaouijalel.ig@gmail.com

Zaki. Brahmi
Laboratory RIADI, ENSI, University of Manouba, Manouba, Tunisia
E-mail: zakibrahmi@gmail.com

Sonia. Ayachi Ghannouchi
ISG Sousse, University of Sousse, Tunisia
Laboratory RIADI, ENSI, University of Manouba, Manouba, Tunisia
E-mail: sonia.ayachi.ghannouchi@gmail.com

Received: 18 October 2020; Accepted: 19 February 2021; Published: 08 April 2021

Abstract: With the appearance of the COVID-19 pandemic, the practice of e-learning in the cloud makes it possible to:
avoid the problem of overloading the institutions infrastructure resources, manage a large number of learners and
improve collaboration and synchronous learning. In this paper, we propose a new e-leaning process management
approach in cloud named CLP-in-Cloud (for Collaborative Learning Process in Cloud). CLP-in-Cloud is composed of
two steps: i) design general, configurable and multi-tenant e-Learning Process as a Service (LPaaS) that meets different
needs of institutions. ii) to fulfill the user needs, developpe a functional and non-functional awareness LPaaS discovery
module. For functional needs, we adopt the algorithm A* and for non-functional needs we adopt a linear programming
algorithm. Our developed system allows learners to discover and search their preferred configurable learning process in
a multi-tenancy Cloud architecture. In order to help to discover interesting process, we come up with a recommendation
module. Experimentations proved that our system is effective in reducing the execution time and in finding appropriate
results for the user request.

Index Terms: LPaaS, BPaaS E-learning process, Discovery, QoS, Cloud Computing, Recommender System.

1. Introduction

     The grow need to e-learning system have been observed during the growing Coronavirus (COVID-19) pandemic
which has compelled decision education officials across the world to shut down school. Many of the existing Learning
Management Systems (LMSs:Dokeos, Moodle) and Massive Open Online Courses (Moocs: edx, coursera) have
participated to facilite the learning [52] in this delicate situation. Although these e-learning system have supported
learners and institutions to progress well in the field of e-learning and manage the evolution of IT [51], they still suffer
from several limitations which mainly are: i) collaboration and interaction during the progress of the learning process
remains limited for learners from the same institution and collaboration between teachers is always absent, ii) lack of
customization of their learning processes according to user needs, iii) lack of reuse of their learning processes in other
systems, v) their infrastructure can present scalability issues, iv) the absence of a good learning process management
knowing that the schools / teachers needs and learners are in galloping evolution.
     This forces each establishment to offer its own learning process which is costly in hardware, software and
manpower terms. Thus, students and teachers need a more flexible, adaptable and scalable infrastructure. For this Cloud
Computing can be a promising solution for the e-learning field. Cloud Computing is a model for deploying resources
and IT capabilities that tend to minimize the implementation and management burden for the user [50, 53]. It offers
infrastructures and software as a service consumed by user on demand via the Internet and pay only it uses. E-learning

Copyright © 2021 MECS                                            I.J. Intelligent Systems and Applications, 2021, 2, 21-37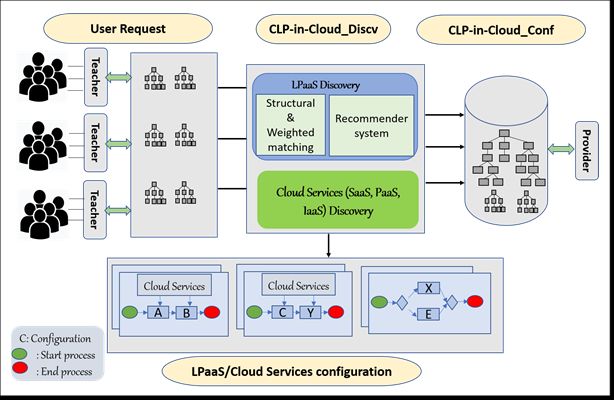
22                             Collaborative E-Learning Process Discovery in Multi-tenant Cloud

process can also be deployed in the cloud and delivered as a service.
      Consequently, e-learning process model repositories will be developed allowing new type of services to be
published by provider and discovered by tenants. Tenants can use some or all of the e-learning processes.
      Using a good learning service discovery system can help learners find the right configuration. In this context,
several approaches in literature have been proposed for cloud services discovery such as the structural and behavioral
approaches [2,3,4]. Except that, these discovery approaches are used to measure the correspondence between learning
activities without regard to it the QoS correspondence which limits the satisfaction of tenants. Similarly, to all other
services published in cloud, the e-learning process repositories contain the description of learning activities, but also
non-functional descriptions such as cost, availability, response time, etc. Even if there are works which combine
structural and non-functional correspondence such as in [1], others use structural indexing [5,6,7] to quickly find the
user needs with optimal precision. But response time remains an important issue for a user looking for a LPaaS in the
cloud. All these different approaches of the literature have adopted the learning process configurations discovery in
several target processes which allows to take a lot of time in the search for a configuration in the cloud.
      In order to overcome these problems related to discovery precision and optimal discovery time, we propose in this
paper CLP-in-Cloud-Discv system which is the part of our approach called CLP-in-Cloud, which allows learners to
discover and search their preferred configurable learning process in a multi-tenancy Cloud architecture. CLP-in-Cloud-
Discv system concerns another part of our approach which consists in designing a general, configurable and multi-
tenant LPaaS considered as a target process. This LPaaS has been studied in our previous work [8] which uses BPFM
(Business Process Feature Model) to design a general, configurable and multi-tenant LPaaS. This in order to manage
several learning situations and satisfies the different needs of a learner. Moreover, we follow the learning socio-
constructivist approach [9] and e-learning standards such as IMS-LD [10] which cover the different necessary elements
for e-learning process construction.
      For this, we propose to transform the discovery problem to an oriented graphs correspondence problem. The goal
is to adapt the non-functional awareness structural matching approach to improve accuracy. We adapt algorithms from
literature which are A* [11] for the structural matching and linear programming [12] for non-functional matching. In
order to help to discover interesting process, we come up with the recommendation system. This recommendation
system is based on the tenant’s profiles, collaborative filtering and the Pearson correlation [13] to minimize the
discrepancies between the real needs of users and recommendation system predictions.
      We conduct performance evaluations with real-world datasets. We show that the proposed system can not only
achieve better discovery of a PLaaS efficiency, but also reduce the execution time of the discovery algorithm.
      The rest of the paper is organized as follows. Section 2 discusses related work. Section 3 presents our approach,
introduces the proposed recommender system, the structural similarity and weighted matching. In section 4, algorithms
are tested and evaluation of obtained results is done and section 5 concludes the paper.

2. Related Works

      As we mentioned in the introduction, we will focus in this work on the e-learning services discovery from the
cloud. In this context, several approaches have been proposed to address the problem of process model matching
[22,35,36,7]. These works use structural or behavioral approaches and label similarity metrics to measure the similarity
between process elements, and sophisticated matching algorithms to derive the mapping based on the computed
similarity. The authors in [6] utilized the idea of similarity propagation to measure the similarity of two process models,
but the method is restricted to VPML process modeling language and only elementary matches are supported.
      In all these works, the process discovery is carried out by comparing the user's request to each target service, then
classify the target processes according to their similarity to the request. To avoid browsing the entire process repository,
some approaches rely on indexing structures [5, 37, 38] to quickly retrieve the processes that are the most likely to be
similar to a (part of) process query. Ehrig & al. [39] use a combination of structural properties of process models and
similarity of labels of tasks, based on the distance of words in those labels in terms of whether they are, for example
synonyms. In [40,41], authors consider the services as black boxes, so the quality requirements are set on the service
profile. Typically, they specify quality preferences as relational expressions, fuzzy sets, linguistic variables, or utility
functions. These approaches do not offer preferred constructors to help the user better define and compose their
preferences.
      In [42], the authors indicate the necessity of more sophisticated and accurate label similarity techniques in order to
improve the performance of existing matching algorithms. But the authors in [43] propose the contextual similarity
measure which, in addition to the similarity of activity labels, exploits the similarity of the context surrounding
activities. They consider two activities to be similar if they are performed in similar environments that are represented
by the surrounding activity neighbors. In turn, the activity neighbors are similar if their neighbors are similar, etc. In this
way, the pairwise similarity between all activities is calculated and updated iteratively based on the similarity between
their neighbors until the similarity scores are stabilized and propagated to the whole graph.
      For more precision in the similarity measurement between a user request and target services, authors in [1]
presented a process discovery framework that considers both functional and non-functional criteria. We indicate that for

Copyright © 2021 MECS                                              I.J. Intelligent Systems and Applications, 2021, 2, 21-37
Collaborative E-Learning Process Discovery in Multi-tenant Cloud                                    23

functional matching, the authors use the structural approach. In this case, the user's query is expressed as a process
template with quality annotations expressing the user's preferences and requirements. The proposed approach will
search for process repositories proposed by BPaaS service providers. Even though the authors use the qualities of
service in the search for a query, there is no guarantee that the user will find the query he is looking for which causes a
waste of time.
      To solve the problem of wasted time looking for a user request in process repositories, the authors in [4] propose to
create a general, configurable and multi-tenant business process which brings together different situations considered as
a BPaaS in the cloud. Each tenant will seek configuration in this target model. The authors use the structural approach
to calculate the similarity between the user request and the target process. Despite the fact that the proposed approach
optimizes, the matching time, but the precision of similarity measurement remains relative since the pairing is based
only on the functional needs.
      After a detailed study of all these works cited above, we noticed that there are some works that deal with the
problem of comparing process models like graphs while others remain linked by a specific modeling language. Thus,
some works studied the problem of discovery of cloud services by focusing on the functional side; they use the
structural, behavioral or label-based approach. This results from problems with matching accuracy of user satisfaction.
      Other works have made the combination between the two (functional and non-functional). However, the wasting
time problem of searching for a request in a large number of target processes remains a limit.
      Considering the rapid evolution of the Internet that has resulted in the availability of huge volumes of e-learning
resources on the Web. However, many learners find it difficult to find appropriate e-learning resources due to
information overload [44]. In recent years, recommendation systems have attracted attention as a solution to the
problem of information overload in e-learning environments and to provide relevant recommendations to learners [19].
The authors in [16] consider recommendation systems as a technique for processing and evaluating user behavioral data
in order to offer resources according to user needs. In e-learning systems, it is actually used to suggest resources and
content relevant to learners. The e-Learning recommendation system is therefore a technique for identifying the
learner's requirements for providing relevant learning content. Several types of recommendation system used in the
literature, such as content based, collaborative filtering and hybrid systems. In [44,45], the authors use contextual
awareness to incorporate contextual information about the learner such as the knowledge level and learning objective in
order to generate recommendations for the learner. Others as in [19,46], they combine collaborative filtering and
ontologies to recommend personalized learning resources to learners. The ontology is used to incorporate the
characteristics of the learner while collaborative filtering predicts assessments and generates recommendations. In [47],
the authors propose a clustering approach to obtain homogeneous groups of learners and to ensure that the
recommended elements are all covered and assimilated by the learners. Despite the efforts made in the development of
recommendation systems for the field of e-learning, they are likely to generate inaccurate recommendations [44,19].
      Table 1 summarizes the existing approaches for process discovery. The criteria we used for comparison are: (i) the
abstract model with which the technique is designed; (ii) the matching perspective used to manage the processes
(behavior, structure, label activity); (iii) the type of recommendation.

Table 1. Comparison of research and discovery approaches

                Reference                       Abstract model             Matching perspective          Type of recommender system
                                                                                                            Hybrid recommendation
       (J. K. Tarus & al, 2017)[44]                    -                             -                   (context awareness, sequential
                                                                                                         pattern mining,CF algorithms)
                                                                                                             Collaborative filtering,
        (J. Tarus & al, 2017) [19]                     -                             -
                                                                                                                   ontology
         (N. Joshi & al, 2019)[16]
                                                       -                             -                   Learners information, context
                                                                                                            Clustering collaborative
       (J. Mawanel & al, 2018)[47]                     -                             -
                                                                                                                    filtering
        (G. George & al, 2019)[46]                    -                              -                             Ontology
          (J. Gao & al,2009) [6]               VPML language                Semantic similarity                          -
         (A. Gater & al,2012) [5]               Process graph               Behavioral approach                          -
                                                                            Behavioral approach
        (M. Ehrig & al,2007) [39]                EPC language                                                           -
                                                                                Label tasks
            (Jabeen & al, 2017)
         (N. Assy & al,2018)[43]                 Process graph             Contextual similarity                        -
         (A. Gater & al,2013) [1]                                          Structural similarity
                                                 Process graph                                                          -
        (F. Lemos & al,2012) [48]                                                  QoS
                                                                           Structural similarity
        (L. Makni & al, 2015) [49]               Process graph                                                          -
                                                                            Semantic similarity
        (S. Azouzi & al, 2019)[4]                Process graph             Structural similarity                       -
              Our approach                       Process graph             Structural similarity             Collaborative filtering

Copyright © 2021 MECS                                                    I.J. Intelligent Systems and Applications, 2021, 2, 21-37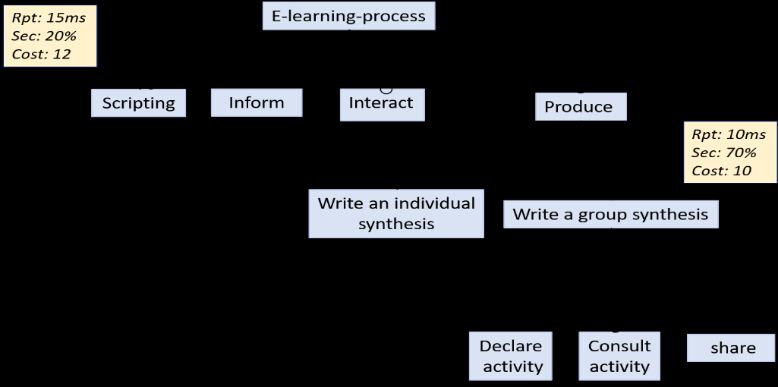
24 Collaborative E-Learning Process Discovery in Multi-tenant Cloud
We can notice from Table 1, that the majority of works use functional correspondence for the discovery of process
models and this limits the accuracy and satisfaction of the learners. Only the work of Gater & al,.[1] and F. Lemos & al,.
[48] combines functional and non-functional co-correspondence. But in these proposed works, the discovery is made in
a warehouse of process, which gives a waste of time. Thus, we notice that the majority of works use graphs as an
abstract model except [39] which works on a particular language.
Some works [19,16,47] use recommendation systems for the discovery of learning resources but this technique is
sometimes limited in terms of learner satisfaction.
To solve these problems, we propose our approach dedicates for modeling and discovery of LPaaS considered as a
BPaaS in cloud. This work is a an extension of a previous work [8] where we proposed a general, configurable and
multi-tenant LPaaS. In the actual work we focus on the discovery of a request (configuration) in a configurable process.
For this, we use two types of matching which are complementary: one based on filtering collaborative recommender
system and another based on the structural matching approach and weighted matching with the considering a process
model as an oriented-graph.
3. Proposed Approach
Several factors can influence a good e-learning system such as the ability to serve and support multiple users,
asynchronous and synchronous collaboration between different actors, the possibility of reusing the e-learning process
in other learning systems and the cost management of used infrastructure. To meet these factors, we propose an
approach called CLP-in-Cloud. Before going into the details of our approach, we present in the Fig. 1 the architecture
CLP-in-Cloud.
As showed in Fig. 1, the proposed system is composed by three main components: user request, LPaaS discovery
(CLP-in-Cloud_Discv) and e-learning process modeling (CLP-in-Cloud_Conf). The provider of e-learning process can
be modeling a collaborative and configurable process which deployed in the cloud as a BPaaS service is called LPaaS
(Learning Process as a Service). To discover a requirement a partial or full LPaaS, tenants which are Institutions /
teachers can invoke CLP-in-Cloud_Discv module which looks in the registries for configurable e-learning process
configurations. This discovery module consists of two components: recommender system for activities which constitute
the configuration of e-learning process and discovery system based on structural similarity and non-functional matching.
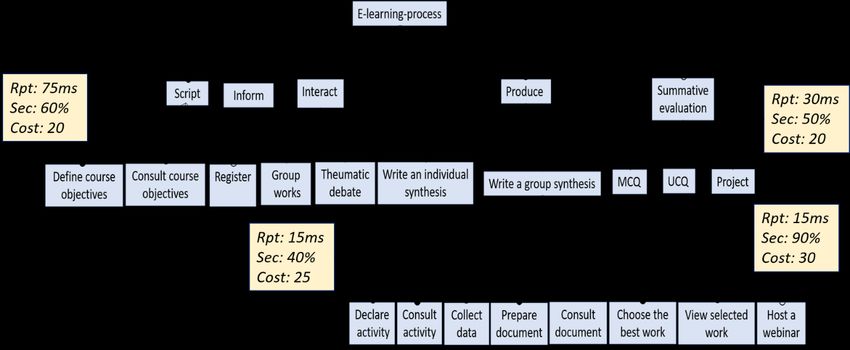
In the following sections we detail these components. Fig. 2 and Fig. 3 respectively represent an example of a user
request and an excerpt from our proposed target process that will be used throughout this work.
Fig.1. Architecture of our CLP-in-Cloud approach
Copyright © 2021 MECS I.J. Intelligent Systems and Applications, 2021, 2, 21-37Collaborative E-Learning Process Discovery in Multi-tenant Cloud 25
Fig.2. Target configurable e-learning process
Fig.3. User request
3.1. CLP-in-Cloud_Discv: Recommender system for e-learning process
A recommender system is a specific form of information filtering aimed at presenting the elements of information
which are likely to interest the user [16]. Recommender systems are classified according to the technique used in
recommendation. The main classifications are content-based, collaborative filtering, knowledge-based and hybrid
filtering [17,18]. In this work, to help the learner find an configuration of learning activities, we proposed to use
collaborative filtering (CF) since it is widely used by several systems given its advantages, among these systems such as:
Amazon, Netflix, MovieLens, Jester, Citeseer, Tapestry, Phoaks, etc [19].
This CF recommender system offers recommendations based on user profiles. It produces recommendations by
measuring the similarity between the preferences of a user and those of other users. The method involves making
automatic predictions about a user's interests by collecting reviews from many users. The idea of this technique is that
those who have enjoyed from a specific activity in the past will tend to like that specific activity,
or another very "close" one, again in the future. Another hypothesis of this technique is that the system offers the same
configuration for two users who have similar profiles. So, each user must provide evaluations of the configuration they
have already used, in the form of notes, to build their profile. Fig. 4 give an over view of our recommender system.
Fig.4. Recommender system for configuration e-learning activities
Learners' information and preferences are stored in users’ database. Information such as learning preference, and
the level of education. Whereas more additional information can be incorporated recommendation process to improve
the learner's personalization recommendations. Un online questionnaire "Index of Learning Styles Questionnaire”1 will
1
https://www.webtools.ncsu.edu/learningstyles/
Copyright © 2021 MECS I.J. Intelligent Systems and Applications, 2021, 2, 21-3726 Collaborative E-Learning Process Discovery in Multi-tenant Cloud
be used to administer to the learner during the account registration process. When there is a new request requested by a
user, the CF recommendation system will use the user’s data in computing predictions of ratings as well as generating
recommendations for the active learner. Once the data has been prepared and preprocessed, the recommendation system
compute the similarities rate and predictions between the learning activity requested by the user and the existing ones in
order to generate personalized recommendations for the target learner.
To determine the similarity between two learning activities i and j, several similarity measures are used such as:
Pearson correlation (PCC) [13], Cosine Similarity (CS) [20] and Spearman distance (SD) [21]. We have chosen to adopt
the Pearson correlation since it is a method derived from statistics. It is also widely used in the field of recommendation
systems to measure the similarity between two user’s preference. Then, the similarity between learning activities i and j
using Pearson correlation (PCC) is calculated as follows:
A1( A,i A )( A,i A )
m
Sim ( i , j ) (1)
2 2
A 1( A,i A ) ( A,i A )
m
Where: m is the number of users who voted for activities, ϑA,i is the vote of A for the activity i, ϑA,j is the vote of A
for activity j and A is the average vote of user A. Assuming that the vote value is between 0 and 10 (0 to say that the
user does not appreciated the activity once and 10 to say that the user appreciated the activity and he is very satisfied).
For example, let the request of a tenant contain the activity "scripting", let m = 100 and the number of activities is
identified in Fig.2, Table 2 presents the similarity values between the user request and the existing activities.
Table 2. Recommendation List for e-learning activities
Activities Similarity values
Script 0.9378
Define course objectivs 0.654
Consult course objectifs 0.687
Register 0.543
Inform 0.002
Interact 0.145
Group work 0.014
Thematic debate 0.154
According to the similarity values obtained, we observe that the "Script" activity is the most similar in terms of
user votes. Then the system recommends it for the user who makes the request.
3.2. CLP-in-Cloud_Discv: structural and non-functional matching
The e-learning services discovery in cloud is based on matching techniques that operate on configurable process
models. The process model consists of a set of related activities that are organized using control flow structures. Several
notations have been developed for multi-tenant configurable business process modeling including BPMN, EPC, BPMT,
vrBPMN, C-iEPC, C-YAWL, etc. [14]. To abstract as much as possible from any existing notation formalism, we
represent a process model as a directed graph BP = (N, C, E, Q) called business process graph (BP-graph for short). N is
a set of activity nodes, C is a set of connectors, E ⊆ N*N is a set of edges and Q is a function which assigns a set of
quality of service to each pair of nodes (Ni, Nj) (edge of the graph). Q is calculated using the following utility function:
n
Q i 1 ai pi (2)
Where ai is a positive value representing an ith quality attribute and pi is a weight of this attribute which is a
positive real value and not null assigned by the user (who sends the request), to the ith quality attribute such as
n
i 1
pi 1 .
In our work, a quality attribute noted by ai can be one of the six quality dimensions described by Zheng, in [15]
such as usability, availability, response and cost.
A user request is a business process configuration denoted by R = (N, C, E, W) such that N, C, and E are
previously defined, and W is a preference set of QoS quality defined by the user.
In Fig we present the functional of CLP-in-Cloud_Discv discovery system. It is composed of user interface, a
structural similarity correlator and a QoS assessment module.
Copyright © 2021 MECS I.J. Intelligent Systems and Applications, 2021, 2, 21-37Collaborative E-Learning Process Discovery in Multi-tenant Cloud 27
Fig.5. CLP-in-Cloud_Discv system
The user interface allows users to interact with the system by choosing which learning activities to perform and
viewing the results in return. Each tenant submits a search query for the LPaaS services they prefer to consume in the
LPaaS registry. The tenant's request consists of two parts:
Functional requirements, such as the learning activities identified in Fig. 2.
Non-functional requirements (quality attribute) to be optimized.
When tenant’s request is performed, a matching program is run to discover and locate the candidate LPaaS
configurations. This matching program is carried out in two stages. The first step is to make a structural correspondence
of the graphs, that is to say a matching to the functional characteristics. In the second step, a correspondence between
weighted graphs is made. In the following sections we detail these steps.
A. LPaaS Structural matching
When we are looking for a configuration in a configurable business process, it is essential to answer the following
question: given an activity node in a user request, does this node exist in the target process? Therefore, the central idea
of our work is to discover the relationship between request process nodes and target process nodes. Then, according to
the similarity rate (correspondence) nodes, we calculate the intersection between the two business process models
(request and target). Our method is based on the definition of an interdependent nodes group which represents the
intersection between two process models and which represents an equivalent node set linked to each other. We first give
a definition of these concepts.
Definition 1 (interdependent nodes): Let S= (Ni, Ci, Ei, Qi), (Nj, Cj, Ej, Qj) two processes successively representing the
user request and the target process. Two nodes are interdependent if and only if they exist exactly in the two processes
(request and target). In other words, two nodes ni and nj are interdependent in the two processes (Ni, Ci, Ei, Qi), (Nj, Cj,
Ej,Qj), ni ∈ Ni, nj ∈ Nj, then ni and nj are interdependent noted by ni ~nj, if they satisfy the following condition:
( N ij , Cij , Eij , Qij ) S | ni N ij n j N ij (3)
In the above formula, n ≺ N means that the node n exists in the nodes set N of the process variant (N, C, E, Q). we
say that n ≺ N if it satisfies the following condition:
n' N | SimN ( n, n ') MinSim (4)
In the above formula, SimN (n, n’) means the similarity between the two nodes n and n’. When the similarity value
reaches a given minimum value, we consider that these two nodes are similar. We fix this value at 0.75 according to
results proven in the work [3].
To measure the similarity between two nodes, it is required they have the same type. As already mentioned above,
there are two nodes types: activities and connectors. Given two nodes of two process graphs respectively, how to
calculate the similarity between the activities (SimA) and the similarity between the connectors (SimC) with the
assumption that the two nodes in comparison are of the same type. To make the separation between nodes types, we
will define the attribute TYPE of node which is an important factor to measure similarity. Thus, type similarity is
defined as follows:
1 if t (n ). TYPE = t (n ). TYPE
SimType ( n1 , n2 ) 1 1 2 2 (5)
0 otherwise
For the type similarity SimA, we consider two methods: syntactic and semantic. However, the semantic method is
not always applicable since there are no complete and free available lexical databases [22]. For this reason, we use in
this work the syntactic method. For type similarity SimC, we use a contextual similarity, where we do not consider the
labels of the elements themselves, but the context in which these nodes produce (the input activities and the output
activities of connectors). All of these measures result in a similarity score between 0 and 1, where 0 indicates no
similarity and 1 indicates identical elements.
Copyright © 2021 MECS I.J. Intelligent Systems and Applications, 2021, 2, 21-3728 Collaborative E-Learning Process Discovery in Multi-tenant Cloud
a. Syntactic similarity
To measure the syntactical similarity between two labels of two activities belonging to two different process
models, we use the String-edit-distance algorithm [23]. The string-edit-distance is the number of operations required to
get another chain from one chain. These operations include: character deleting, character inserting or character
substitution.
Definition 2 (syntactic similarity): Let (N1, C1, E1, Q1), (N2, C2, E2, Q2) be two graphs. Let n1 ∈ N1, n2 ∈ N2 be two
nodes and let l1 (n1), l2 (n2) be the two strings which represent the labels of these two nodes. We can calculate their
length, denoted by |l1 (n1) |, |l2 (n2) | and their edit distance denoted by ed (l1 (n1), l2 (n2)). We define the syntactic
similarity of nodes n1 and n2 as follows:
ed ( l1 ( n1 ),l2 ( n2 ))
syn ( n1 , n 2 ) 1 (6)
max( l1 ( n1 ) , l2 ( n2 ) )
For example, the syntactic similarity between the ‘script’ node shown in Fig.2 and the ‘scripting’ node shown in
Fig.3 is: Syn(‘scripting’, ‘script’) =1-3/9 = 0.66, because the edit distance is 3 (‘scripting’ becomes ‘script’ by deleting a
‘i’ ‘n’ and ‘g’ . To compare node labels, we eliminate special characters.
For the similarity between two connectors, it is unrealistic to measure them by lexical similarity because they have
no textual information. Instead, we use a context similarity notion which signifies the correspondence degree of their
inputs and outputs nodes.
b. Connectors similarity
The connectors describe the control flows between activities and represent logical decision points. They have no
text information to compare them except the type. Instead, we use the context similarity concept which means the
similarity degree of their inputs and outputs. As already mentioned above, the connectors are of several types:
{mandatory, optional, and, or, xor}. A connector can have an input arc and several output arcs, in this case it is called
split; or several input arcs and one output arc and in this case, it is called join. Each connector has inputs (join) and
outputs (split).
Definition 3 (Contextual similarity): Let (N1, C1, E1, Q1), (N2, C2, E2, Q2) be two graphs and let n1 ∈ N1 and n2 ∈ N2 be
two nodes. The contextual similarity between these two nodes is calculated as follows:
SimContext ( n1 , n 2 )
( n ,n )M opt ( nin ,nin S ( ni ,n j ) ( n ,n )M opt ( nout ,nout ) S ( n p ,nq ) (7)
i j S 1 2 p q S 1 2
in in out
max( n1 , n2 ) max( n1 , n2 ) out
Where M Sopt ( N1 , N2 ) means the optimal node mapping set between sets of nodes N1 and N2 based on the similarity
function S, which can be defined as follows:
Definition 4 (Optimal node match set): Let (N1, C1, E1, Q1), (N2, C2, E2, Q2) be two graphs. Let N1 ⊆ N1 and N2 ⊆ N2
be two sets of nodes. Let S: N1* N2 ↛ [0..1] is the similarity function. An optimal mapping M Sopt : N1 ↛N2 is the
optimal set of nodes for any other node for a mapping Ms: N1 ↛N2 such as:
( n ,n )M opt ( N , N ) S ( n ,n ( n ,n )M ' ( N , N ), S ( n ,n ),n N ,n N (8)
1 2 S 1 2 1 2 1 2 S 1 2 1 2 1 1 2 2
Based on the similarity measurement methods mentioned above, we can make a conclusion on how to assess the
nodes similarity of two different processes according to the type of these nodes:
SimTYPE ( n1 ,n2 ). Syn ( n1 ,n2 )
SimN ( n1 , n2 ) (9)
SimTYPE ( n1 ,n2 ). SimContext ( n1 , n2 )
Here, we use the current example (Fig.1 and Fig.2) to explain the concepts of interdependent nodes between target
process and query process. After applying the definitions mentioned above, we find that the following nodes (activities,
connectors) are interdependent and that they are in the intersection of the two processes. In Table 3, we
Copyright © 2021 MECS I.J. Intelligent Systems and Applications, 2021, 2, 21-37Collaborative E-Learning Process Discovery in Multi-tenant Cloud 29
indicate by 1 the nodes are interdependent and by 0 the nodes that are not interdependent.
In a first step, we carried out an elementary correspondence between the different node’s types of the two
processes in question. In the next section we will see how to use these definitions cited above to measure the overall
similarity of two processes. In the rest of this work, we use Sim (n1, n2) to note the similarity value between two nodes
of two models. Any of the above symmetric similarity functions (syn or con) can be used for this.
c. Similarity between two graphs of process models
A large number of graph matching methods have been proposed in recent years [24,25,26]. One of the most
flexible and error-tolerant methods of graph matching that is applicable to different types of graphs is based on the
graph-edit-distance.
The graph-edit-distance between two graphs is the minimum cost of transforming one graph to another.
Transformations are considered as sequences of elementary transformation operations. Each elementary operation has a
cost, which is given by a cost function.
In view of the above, we define the graph-edit-distance as follows: given two graphs, source graph g1 and target
graph g2. The basic idea of edit-distance calculating between graphs is to transform g1 into g2 using certain edit
operations. All the possible edit operations are given by insertions, deletions and substitutions of nodes and edges. We
note the substitution of the two nodes u and ʋ by (u → ʋ), the deletion of a node by (u → ℰ), and the insertion of a node
by (ℰ → ʋ). For the edges we use a similar notation. A sequence of operations e1, e2 .. ek completely transforming g1
into g2 is called an edit path between g1 and g2.
Based on the principle of graph-edit-distance, we will calculate the maximum similarity rate between two process
model graphs as follows:
Definition 5 (Similarity measure: graph edit similarity): Let P1= (N1, C1, E1, Q1) and P2= (N2, C2, E2, Q2) two graphs.
Let N1 = N1 Ս E1 nodes of P1 and N2 = N2 Ս E2 nodes of P2 and let Sim be one of the similarity functions mentioned
above (syn, con). Let M: N1 ↛ N2 be a partial injective mapping that maps functions, events and connectors. Let dom(M)
= {n1ǀ (n1, n2) ∈ M} be the domain of M and let cod (M)= {n2 ǀ (n1, n2) ∈ M} be the codomain of M. Let n ∈ N1 Ս N2 be
node, n is substituted if and only if n ∈ dom (M) or n ∈ Cod (M). Let sb be the set of all substituted nodes, Sn is the set
of all inserted or deleted nodes. Let (n, m) ϵ E1 be an edge, (n, m) is inserted or deleted from P1 if only if there is no
mapping (n, n ') ϵ M and (m, m') ϵ M and edge (n ', m') ϵ E2. We denote by se the set of all the inserted or deleted edges.
Furthermore, let 0 ≤ wsb ≤ 1, 0 ≤ wsn ≤ 1 and 0 ≤ wse ≤ 1 be the weights we assign to substituted, inserted or deleted
nodes and inserted or deleted edges, respectively. The fraction of inserted or deleted nodes, noted fsn, the fraction of
inserted or deleted edges, noted fse and the average distance of the substituted nodes, noted fsb, are defined as follows:
sn se 2.( n ,m )M 1.0( Sim ( n ,m ))
fsn fse fsb (10)
N1 N 2 E1 E2 sb
The graph-edit-similarity induced by M mapping is:
wsn. fsn wse. fse wsbfsb
1 (11)
wsn wse wsb
The similarity of two graphs is the maximum possible similarity induced by a mapping between these graphs. The
more this degree of similarity tends towards 1, the more the two services are similar, and the more the user is satisfied.
For example, using the weights wsb = 1.0, wsn = 0.1 and wse = 0.3, let's look for the graph edit similarity induced by
the matching of the request process nodes (Fig.3) and the target process nodes (Fig.2). We can count substitutions,
insertions and deletions: in total, there are 15 node substitutions, 27 insertions / deletion of nodes, 15 insertions /
deletions of edges. This is the maximum possible similarity induced by an M mapping and therefore, it is the graph edit
similarity between the two graphs of the two proposed process models. We apply formulas (12) and (13) to obtain the
maximum similarity value induced by the mapping M which is as follows:
Maximum similarity = 1- 0.31 = 0.69.
Inspired by the principle of graph distance calculation, we have written a function called Variability-Activity-
Matching (Algorithm 1) which takes into account the different definitions presented above.
To calculate the edit graph similarity of two process graphs, we need to find the mapping that induces the
maximum similarity. Then we could build all possible matches and return those with maximum similarity. However, the
number of possible matches is 2ǀN1ǀ + ǀN2ǀ. The authors in [26] have shown that the problem of finding an optimal
match in this context is a NP-complete or sometimes NP difficult-problem. To avoid problems associated with the
completeness of NP, complete algorithms have been proposed for the search for matching that maximizes similarity
(Formula 14). These algorithms are based on an exhaustive exploration of the search space combined with filtering
techniques. These algorithms are numerous and are cited in the literature such as Greedy algorithm[11], Beam search
[29], Hungarian algorithm and VJ method (Volgenant Jonker) [24]. In a previous work[4], we tested the Greedy and
Copyright © 2021 MECS I.J. Intelligent Systems and Applications, 2021, 2, 21-3730 Collaborative E-Learning Process Discovery in Multi-tenant Cloud A* algorithm [11], the obtained results show the feasibility of the A* algorithm (Algorithm 2) in term of precision of obtained results because it is based on a cut-off value: if a similarity between two nodes is less than a minimum threshold then it removes these nodes. Copyright © 2021 MECS I.J. Intelligent Systems and Applications, 2021, 2, 21-37
Collaborative E-Learning Process Discovery in Multi-tenant Cloud                                 31

Table 3. Interdependent nodes of request process and target process

                        Request node          Target node        Type   Sim syn      Sim context   interdependent node
                                               e-learning-
                      e-learning-process                         root     1              --               1
                                                 process
                            C1                     C1             C       --            0.90                  1
                            C2                     C3             C       --              1                   1
                            C3                     C4             C       --              1                   1
                         Scripting                Script          A      0.66            --                   1
                          Interact               Interact         A        1             --                   1
                          produce               Produce           A        1             --                   1
                        Group works           Group Work          A      0.90            --                   1
                                                Thematic
                      Theumatic debate                            A      0.92            --                   1
                                                 Debate
                                                 Prepare
                     Write an individual
                                               individual         A      0.76            --                   1
                          synthesis
                                                synthesis
                        Write a group         Write a group
                                                                  A       1              --                   1
                         synthesis              synthesis
                       Declare activity      Declare activity     A       1              --                   1
                       Consult activity      Consult activity     A       1              --                   1
                                                 Consult
                     Evaluate document                            A      0.62            --                   1
                                               document
                            share            Host a webinar       A       0              --                   0
                             C4                    C9             C       --            0.92                  1
                             C5                    C10            C       --            0.55                  0
                             C6                    C12            C       --            0.33                  0
                             C7                    C13            C       --            0.33                  0
                             C8                    C16            C       --            0.31                  0
                             C9                    C19            C       --            0.20                  0

Copyright © 2021 MECS                                                          I.J. Intelligent Systems and Applications, 2021, 2, 21-37
32 Collaborative E-Learning Process Discovery in Multi-tenant Cloud
B. Weighted graph matching
The structural matching is not sufficient to find the configuration most suited to the user's needs. For this, a second
matching based on non-functional attributes (QoS) must be defined. In this case, the user can enrich his query with non-
functional requirements. In order to solve this problem, we have inspired the QoS satisfaction model CLOUDQUAL
[28] and we apply three correspondence calculation algorithms for weighted graphs which principle is described as
follows:
A weighted graph G is an ordered pair (V, W) with V is the set of nodes of the graph and W is the weighting
function which allows to associate a non-negative real value W (vi, vj) with each pair of nodes (vi, vj) (edge of the
graph), vi ∈ V, vj ∈ V and vi ≠ vj. The adjacency matrix of a weighted graph G = (V, W) is an AG of dimension n × n.
aij w ( i , j ) si i j
AG aij (12)
aij 0 si n on
Let G = (V1, W1), H = (V2, W2) be two weighted graphs with n nodes. The problem of correspondence of a pair of
weighted graphs (G, H) consists in finding the correspondence, Φ, between V1 = {v1, v2, v3, ..., vn} and V2 = {v1', v2',
v3', ..., vn'} which minimizes the "difference" between G and H. We use the following formula to measure this
difference:
n
min j ( ) i 1 nj 1( w1 ( i , j ) w2 ( ( i ),( j ))) 2 (13)
For the non-functional correspondence, we tested the linear programming algorithms is proposed to solve the
problem of mapping a pair of weighted graphs, and we compared it with two reference algorithms of literature which
are:
Eigen-decomposition method this method uses an analytic, instead of a combinatorial or iterative, approach to
the optimum matching problem of such graphs.
Polynomials transformation [31]: the fundamental symmetric polynomial method is used to match pairs of
directed and undirected weighted graphs. More details are given in [32].
4. Experimental Setup
4.1. Assessment of the recommendation system prediction
When the recommendation system recommends learning activities for the learner, the latter will assign an
evaluation according to his/her satisfaction regarding this recommendation. This user rating is used to measure the
accuracy of the effectiveness of the recommendation system. In this context, two metrics are the most used to calculate
the difference between the real values given by the user and the similarities predicted by the recommendation system:
MAE (Mean Absolute Error) [33] which is regularly used to evaluate the accuracy of a prediction, it corresponds
to the mean absolute error between the actual evaluation and the prediction. The measurement is calculated by the
following formula:
1 n
MAE R R (14)
n 1 i i
Where Ri denotes the predicted confidence value, Ri denotes the measured confidence value and n is the number
of predicted items.
RMSE (Root Mean Squared Error) [34] square the error before summing, this measure is useful when we want to
give more criticality to large errors. it is expressed as follows:
( Ri Ri )2
RMSE (15)
n
We suppose that a learner launches the request presented by Fig. 3 which consists of a set of learning activities.
The recommendation system offers the learning activities that are similar to the user request from the LPaaS process
deployed in the cloud (Fig. 2). The results returned by the MAE and the RMSE are summarized in the Table 4:
Copyright © 2021 MECS I.J. Intelligent Systems and Applications, 2021, 2, 21-37Collaborative E-Learning Process Discovery in Multi-tenant Cloud 33
Table 4. Evaluation of e-learning activities recommender system
Activity User evaluation Similarity MAE RMSE
Script 0.75 0.937 0.046 0.093
Define course objectivs 0.54 0.654 0.028 0.057
Consult course objectifs 0.55 0.687 0.034 0.068
Register 0.63 0.543 0.021 0.043
By observing the results of Table 4, we note that there is a minimal difference between the prediction of our
recommendation system (represented by the similarity value) and the evaluation given by the user for a learning activity.
For the example of the "script" activity, we observe that the difference between the similarity predicted by the
recommendation system and the rating assigned by the user is almost negligible. This explains why the use of the
collaborative filtering, and more precisely the Pearson correlation contributes to better precision.
It should be mentioned that the recommender system in our work is used to optimize the response time for a user
request. If the user is not satisfied, then the discovery module based on structural matching and non-functional matching
is launched to find the appropriate configuration and meets the needs of the user.
4.2. Evaluation of structural and non-functional matching
The input format for the BP-graphs to be matched is the Graph eXchange Language (GXL) standard [29]. We set
up the evaluation by creating artificial BP-graphs from the BPaaS models depicted in Fig.2 and Fig.3 varying QoS
values. The users are also offered the possibility to create to design and visualize their BPaaS demands, we built up our
system on the Business Process Feature Model BPFM.
Table 4 shows the results of the execution of the A* structural matching algorithm followed by the execution of
non-functional correspondence algorithms between a pair of weighted graphs Rqst and Trgt representing respectively
the request process and the target process presented in Fig.2 and Fig.3. When these correspondence methods are
performed between a pair of weighted graphs, we record four important values: structural similarity, weighted similarity,
similarity and the running time. The structural similarity value is calculated as mentioned in formula number 13.
The weighted similarity as defined in the following formula:
weighted distance
Weighted similarity 1 (16)
in1 ai pi m
j 1 a j p j
Where weighted distance is the weighted graph distance obtained by running the three algorithms: eigen
decomposition, polynomial transformation and linear programming; and in1 ai pi mj 1a j p j is the sum of the quality
attribute values considered in the user's request and target process of all edges (see section 2). The similarity measure is
defined as follows:
Similarity Structural similarity + Weighted similarity (17)
Where α and β are the structural similarity and weighted similarity weights, respectively. In our work, we consider
α=0.5 and β= 0.5.
We also recorded structural and weighted match times. Here, the execution time is expressed in milliseconds. The
aim of these experiments is to find out which is the fastest algorithms couple. Rqst is the requested service represented
by Fig.3, Trgt is the provided configurable service, they are represented by Fig.2. We note in Table 5 the global
similarity values between the services Rqst and Trgt which are exactly the same using the A* algorithm combined with
the eigen-decomposition and polynomial-transformation, and linear programming algorithms respectively (0.68), but
they are slightly lower using the A* algorithm combined with the Linear programming algorithm (0.70).
To measure the performance of these algorithms, we compare them in runtimes term. For that, we define the user
request number to n and the service provided number to 1, but we modify each time the nodes number in the user
request which varies from 7 to 21 nodes. For this, we have made the sum of the structural runtimes and the weighted
runtimes of each couple.
Through Fig.6, we observe the runtime of the algorithm A * for the structural matching combined with the three
weighted algorithms: eigen decomposition, polynomial transformation and linear programming for three requests from
three tenants.
Copyright © 2021 MECS I.J. Intelligent Systems and Applications, 2021, 2, 21-3734 Collaborative E-Learning Process Discovery in Multi-tenant Cloud
Table 5. Similarity values and running times performed by the algorithm’s combinations
Eigen-decomposition
Matching values Running times (ms)
(Rqst, Trgt) Structural similarity Weighted similarity similarity Structural Weighted
0.86 0.53 0.68 166 13546
Polynomial transform
Matching values Running times (ms)
(Rqst, Trgt) Structural similarity Weighted similarity Similarity Structural Weighted
0.86 0.53 0.68 166 4935
Linear programming
Matching values Running times (ms)
(Rqst, Trgt) Structural similarity Weighted similarity Similarity Structural Weighted
0.86 0.50 0.70 166 14789
We notice that the execution time of two algorithms "eigen decomposition" and "polynomial transform" are almost
similar. While the third algorithm "Linear Programming", requires considerable time compared to the other two
algorithms. This is explained by its complexity which is of the order of O (n6), while the complexity of the other two
algorithms is of the order of O (n3).
Fig.6. Evaluation of the runtime of the 3 weighted correspondence algorithms and the structural correspondence algorithm "A*" with graphs of size n
= 7, n = 14 and n = 21
To assess the performance quality of our discovery approach, we created a graph benchmark that contains our
target process shown in Fig.2 and a set of user query graphs. Then we compare the result of each request to an expert in
the field (referential). In addition, we used the standard measure “average difference2” which is a parameter used to
assess the information retrieval quality.
The average difference is the arithmetic mean of the absolute values of the deviations from the list mean. It is a
measure of dispersion of the list and can defined in the following formula:
xi xr
Average difference = (18)
n
when xr is the referential value.
Table 6. Obtained results of A* algorithm combined with eigen decomposition, polynomial transform and linear programming algorithms compared
by referential
A* with Reqst 1 Reqst 2 Reqst 3 Reqst 4 Reqst 5 AVD
Eigen decomposition 0.78 0.39 0.52 0.61 0.62 0.254
Polynomial transform 0.78 0.40 0.52 0.62 0.64 0.246
Linear programming 0.86 0.68 0.76 0.70 0.85 0.068
Referential 0.98 0.76 0.80 0.75 0.90 --
2
https://lexique.netmath.ca/ecart-moyen/
Copyright © 2021 MECS I.J. Intelligent Systems and Applications, 2021, 2, 21-37Collaborative E-Learning Process Discovery in Multi-tenant Cloud 35
Table 6 shows the results obtained when combining A* algorithm with the eigen decomposition, polynomial
transform and linear programming algorithm. These results allow us to compare the qualities of structural and weighted
correspondence and can further identify which algorithms combination gives the good or bad result. We can see that,
based on the Table 1 illustration, the similarity values obtained are in the order (A*, eigen decomposition) ≤ (A*,
polynomial transform) ≤ (A*, linear programming). The values of (A*, eigen decomposition) and (A*, polynomial
transform) are almost similar and always lower than that of (A*, linear programming). In addition, if we compare the
average difference of the three algorithms pairs with that of the referential opinion. We note that the value obtained by
the couple (A*, linear programming) is the closest and this is explained on the one hand by the precision of A*
algorithm and on the other hand by the precision of the linear programming algorithm and its error tolerance.
5. Conclusion
In this work, we proposed an e-learning discovery system which is the part of our collaborative e-learning
approach called CLP-in-Cloud. The aim of our approach is to tailor the e-learning process according to the needs of the
learners. Our strategy for process discovery is based on two techniques: a recommender system for learning activities
based on collaborative filtering and Pearson correlation. If the user is not satisfied, another technique has been used
taking into account both functional and non-functional criteria. For this, we consider a process model as an oriented
graph and we developed an approach for BPaaS discovery based on the structural similarity technique through on
graph-edit- distance algorithms, namely A*. To distinguish between equivalent functionally candidate services, we use
the QoS ranking as a weighted treatment of graph matching problems using three computational algorithms, Eigen-
decomposition, polynomial transformation and Linear programming which are references algorithms in the weighted
graph matching research area. We evaluate our approach by a real-world dataset. The results obtained show the
accuracy of CF recommender system. But it given the minimum difference between their prediction and the user
evaluation. Thus, the structural and weighted matching increases the user satisfaction and the obtained results show the
precision of A * combined with linear programming since their results are close to referential.
Currently, we are working on adopting the technique of machine learning to adapt the learning process that we
proposed according to the needs and preferences of learners in real time.
References
[1] A. Gater, F. Lemos, D. Grigori, and M. Bouzeghoub, “S-Discovery: A behavioral and quality-based Service Discovery on the
cloud,” in International Conference on Cloud Computing and Services Science, 2013, pp. 104–109.
[2] R. Dijkman, M. Dumas, L. García-Bañuelos, and R. Käärik, “Aligning business process models,” in IEEE International
Enterprise Distributed Object Computing Conference, 2009, pp. 45--53.
[3] J. Ling, L. Zhang, and Q. Feng, “Business process model alignment: An approach to support fast discovering complex
matches,” in Enterprise Interoperability VI, Springer, 2014, pp. 41--51.
[4] S. Azouzi, J. Hajlaoui, S. A. Ghannouchi, and Z. Brahmi, “E-Learning BPaaS Discovery in Cloud Based on a Structural
Matching,” in Advancing Technology Industrialization Through Intelligent Software Methodologies, Tools and Techniques,
2019, pp. 176–189.
[5] A. Gater, D. Grigori, and M. Bouzeghoub, “Indexing process model flow dependencies for similarity search,” in International
Conferences on n the Move to Meaningful Internet Systems, 2012, pp. 128–145.
[6] J. Gao and L. Zhang, “On measuring semantic similarity of business process models,” in International Conference on
Interoperability for Enterprise Software and Applications, 2009, pp. 289–293.
[7] C. Klinkmüller, I. Weber, J. Mendling, H. Leopold, and A. Ludwig, “Increasing recall of process model matching by improved
activity label matching,” in Business process management, 2013, pp. 211–218.
[8] S. Azouzi, S. A. Ghannouchi, and Z. Brahmi, “Software product line to express variability in e-learning process,” in
International Conference on Digital Economy, 2017, pp. 95--104.
[9] L. S. Vygotsky, M.Cole, V. John-Steiner, S. Schribner, and E. and E. Souberman, Mind in Society: The Development of
Higher Psychological Processes. Cambridge, 1978.
[10] J.-P. Pernin, “Objets pédagogiques: unités d’apprentissage, activités ou ressources,” Rev. Sci. Tech. Educ. Hors série, pp. 179--
210, 2003.
[11] R. Dijkman, M. Dumas, and L. García-Bañuelos, “Graph matching algorithms for business process model similarity search,” in
International Conference on Business Process Management, 2009, pp. 48--63.
[12] H. A. Almohamad and S. O. Duffuaa, “A Linear Programming Approach for the Weighted Graph Matching Problem,” IEEE
Trans. Pattern Anal. Mach. Intell., vol. 15, no. 5, pp. 522–525, 1993.
[13] P. Resnick, N. Iacovou, M. Suchak, P. Bergstrom, and J. Riedl, “GroupLens: An open architecture for collaborative filtering of
netnews,” in ACM conference on Computer supported cooperative work, 1994, pp. 175–186.
[14] V. Mark, “Modeling Business Process Variability,” Diss. University of Twente, 2007.
[15] X. Zheng, P. Martin, K. Brohman, and M. Zhang, “Cloud service negotiation: A research report,” Int. J. Bus. Process Integr.
Manag., vol. 7, no. 2, pp. 103–113, 2014.
[16] N. Joshi and R. Gupta, “An E-Learning based Recommendation System for Semantic Web: A Survey,” Int. J. Comput. Sci.
Eng., 2019.
[17] N. Manouselis, H. Drachsler, R. Vuorikari, H. Hummel, and R. Koper, “Recommender Systems in Technology Enhanced
Copyright © 2021 MECS I.J. Intelligent Systems and Applications, 2021, 2, 21-3736 Collaborative E-Learning Process Discovery in Multi-tenant Cloud
Learning,” in Recommender Systems Handbook, 2011.
[18] G. Adomavicius and A. Tuzhilin, “Toward the next generation of recommender systems: A survey of the state-of-the-art and
possible extensions,” IEEE Transactions on Knowledge and Data Engineering. 2005.
[19] J. Tarus, Z. Niu, and B. Khadidja, “E-Learning Recommender System Based on Collaborative Filtering and Ontology,” Int. J.
Comput. Inf. Eng., vol. 11, no. 2, pp. 256–261, 2017.
[20] G. Guo, J. Zhang, and N. Yorke-Smith, “A novel bayesian similarity measure for recommender systems,” in IJCAI
International Joint Conference on Artificial Intelligence, 2013.
[21] L. Baltrunas, T. Makcinskas, and F. Ricci, “Group recommendations with rank aggregation and collaborative filtering,” in
RecSys’10 - Proceedings of the 4th ACM Conference on Recommender Systems, 2010.
[22] R. Dijkman, M. Dumas, B. Van Dongen, R. Krik, and J. Mendling, “Similarity of business process models: Metrics and
evaluation,” Inf. Syst., vol. 36, no. 2, pp. 498–516, 2011.
[23] V. Levenshtein, “Binary codes capable of correcting deletions, insertions, and reversals,” in Soviet Physics Doklady, 4th ed.,
1966, pp. 707--710.
[24] K. Riesen, S. Emmenegger, and H. Bunke, “A novel software toolkit for graph edit distance computation,” in International
Workshop on Graph-Based Representations in Pattern Recognition, 2013, pp. 142--151.
[25] D. Conte, P. Foggia, C. Sansone, and M. Vento, “Thirty years of graph matching in pattern recognition,” Int. J. Pattern
Recognit. Artif. Intell., vol. 18, no. 03, pp. 265--298, 2004.
[26] S. Sorlin and C. Solnon, “Reactive Tabu search for measuring graph similarity,” in International Workshop on Graph-Based
Representations in Pattern Recognition, 2005, pp. 172--182.
[27] K. Riesen and H. Bunke, “Approximate graph edit distance computation by means of bipartite graph matching,” Image Vis.
Comput., 2009.
[28] R. Boughamoura, M. N. Omri, and H. Youssef, “Fuzzy Approach to Extract Pertinent Information from Web Resources,” in
The International Group of E-Research Systems and Applications, 2007.
[29] M. Neuhaus, K. Riesen, and H. Bunke, “Fast suboptimal algorithms for the computation of graph edit distance,” in
International Workshops on Statistical Techniques in Pattern Recognition (SPR) and Structural and Syntactic Pattern
Recognition, 2006, pp. 163–172.
[30] S. Umeyama, “An Eigendecomposition Approach to Weighted Graph Matching Problems,” IEEE Trans. Pattern Anal. Mach.
Intell., vol. 10, no. 5, pp. 695--703, 1988.
[31] H. A. Almohamad, “A polynomial transform for matching pairs of weighted graphs,” Appl. Math. Model., vol. 15, no. 4, pp.
216–222, 1991.
[32] J. E. Hajlaoui, M. N. Omri, and D. Benslimane, “A QoS-aware approach for discovering and selecting configurable IaaS Cloud
services,” Comput. Syst. Sci. Eng., 2017.
[33] U. Shardanand and P. Maes, “Social information filtering: algorithms for automating ‘word of mouth,’” in Conference on
Human Factors in Computing Systems - Proceedings, 1995.
[34] N. Thai-Nghe, L. Drumond, A. Krohn-Grimberghe, and L. Schmidt-Thieme, “Recommender system for predicting student
performance,” in Procedia Computer Science, 2010.
[35] C. Klinkmüller, H. Leopold, I. Weber, J. Mendling, and A. Ludwig, “Listen to me: Improving process model matching through
user feedback,” in International Conference on Business Process Management, Springer, 2014, pp. 84–100.
[36] E. Kuss, H. Leopold, H. van der Aa, H. Stuckenschmidt, and H. A. Reijers, “A probabilistic evaluation procedure for process
model matching techniques,” in Data and Knowledge Engineering, 2018, pp. 279–292.
[37] A. Awad and S. Sakr, “Querying graph-based repositories of business process models,” in International Conference on
Database Systems for Advanced Applications, 2010, pp. 33–44.
[38] Z. Yan, R. Dijkman, and P. Grefen, “Fast business process similarity search with feature-based similarity estimation,” in
International Conferences" On the Move to Meaningful Internet Systems, 2010, pp. 60–77.
[39] M. Ehrig, A. Koschmider, and A. Oberweis, “Measuring similarity between semantic business process models,” in the fourth
Asia-Pacific conference on Comceptual modelling,Vol. 67, 2007, pp. 71–80.
[40] S. Ben Mokhtar, D. Preuveneers, N. Georgantas, V. Issarny, and Y. Berbers, “EASY: Efficient semAntic Service discoverY in
pervasive computing environments with QoS and context support,” J. Syst. Softw., vol. 81, no. 5, pp. 785–808, 2008.
[41] S. Agarwal, S. Lamparter, and R. Studer, “Making Web services tradable. A policy-based approach for specifying preferences
on Web service properties,” J. Web Semant., vol. 7, no. 1, pp. 11–20, 2009.
[42] F. Jabeen, H. Leopold, and H. A. Reijers, “How to make process model matching work better? An analysis of current similarity
measures,” in International Conference on Business Information Systems, 2017, pp. 181–193.
[43] N. Assy, B. F. Van Dongen, and W. M. P. Van Der Aalst, “Similarity resonance for improving process model matching
accuracy,” in Proceedings of the ACM Symposium on Applied Computing, 2018.
[44] J. K. Tarus, Z. Niu, and A. Yousif, “A hybrid knowledge-based recommender system for e-learning based on ontology and
sequential pattern mining,” Futur. Gener. Comput. Syst., 2017.
[45] A. Karatzoglou and B. Hidasi, “Deep learning for recommender systems,” in RecSys 2017 - Proceedings of the 11th ACM
Conference on Recommender Systems, 2017.
[46] G. George and A. M. Lal, “Review of ontology-based recommender systems in e-learning,” Comput. Educ., 2019.
[47] J. Mawanel, A. Naji, and M. Ramdani, “Clustering collaborative filtering approach for Diftari E-Learning platform’
recommendation system.,” in ACM International Conference Proceeding Series, 2018.
[48] F. Lemos, D. Grigori, and M. Bouzeghoub, “Adding non-functional preferences to service discovery,” in International
Conference on Web Engineering, 2012, pp. 299–306.
[49] L. Makni, N. Z. Haddar, and H. Ben-Abdallah, “Business process model matching: An approach based on semantics and
structure,” in International Conference on e-Business and Telecommunications, 2015, pp. 64–71.
[50] Tinankoria Diaby, Babak Bashari Rad,"Cloud Computing: A review of the Concepts and Deployment Models", International
Journal of Information Technology and Computer Science (IJITCS), Vol.9, No.6, pp.50-58, 2017. DOI:
Copyright © 2021 MECS I.J. Intelligent Systems and Applications, 2021, 2, 21-37You can also read