AMERICA'S INTERSTATE HIGHWAY - Meeting America's Transportation Needs with a Reliable, Safe & Well-Maintained National Highway Network - TRIP ...
←
→
Page content transcription
If your browser does not render page correctly, please read the page content below
AMERICA’S INTERSTATE HIGHWAY
                         SYSTEM AT 65:
  Meeting America’s Transportation Needs with a Reliable, Safe &
           Well-Maintained National Highway Network

PHOTO CREDIT: U.S. GEOLOGICAL SURVEY

                                                 JUNE 2021

    Founded in 1971, TRIP ® of Washington, DC, is a nonprofit organization that researches, evaluates and
    distributes economic and technical data on surface transportation issues. TRIP is sponsored by insurance
    companies, equipment manufacturers, distributors and suppliers; businesses involved in highway and transit
    engineering and construction; labor unions; and organizations concerned with efficient and safe surface
    transportation.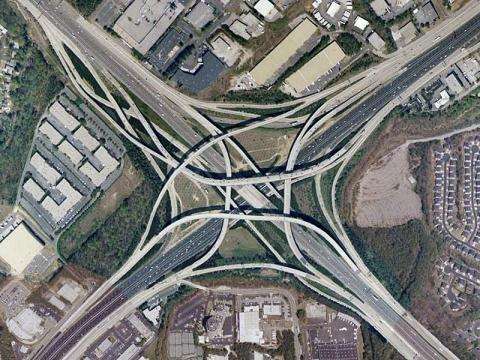
Executive Summary
        At sixty-five years old, an age at which many Americans are considering retirement and
reduced workloads, the Interstate Highway System is deteriorating, its traffic load of cars and trucks
continues to increase, and the system lacks an adequate plan for its long-term health.
       The Interstate Highway System remains the workhorse of the U.S. transportation system:
heavily traveled and providing the most important link in the nation’s supply chain, and the primary
connection between and within urban communities. The importance of the Interstate Highway System
and the reliable movement of goods it provides was heightened during the response to the COVID-19
pandemic and the ongoing recovery. But, America’s Interstate highways are wearing out and showing
signs of their advanced age, often heavily congested, and in need of significant reconstruction,
modernization and expansion.
       In 2015, as part of the Fixing America’s Surface Transportation (FAST) Act, the U.S. Congress
asked the Transportation Research Board (TRB), a division of the National Academy of Sciences,
Engineering and Medicine, to conduct a study to determine actions needed to upgrade and restore the
Interstate Highway System to fulfill its role of safely and efficiently meeting the nation’s future critical
personal, commercial and military travel needs. In 2019, the TRB provided Congress with a report that
found that the nation’s Interstates are heavily congested and aging, with large portions of the system
in need of major reconstruction and modernization. The report found that addressing the needs of the
Interstate Highway System will require more than a doubling of current investment to adequately
improve the system’s condition, reliability and safety, and that the restoration of the nation’s
Interstate Highway System should be based on strong federal leadership of a collaborative effort with
the states.
       TRIP’s America’s Interstate Highway System at 65 report provides the latest information on the
Interstate system, including pavement conditions, bridge conditions, travel trends, traffic congestion
levels, truck use, and traffic safety. It reviews the findings of the TRB Interstate report and concludes
with recommended actions - based on the findings of the TRB report - to ensure that the system is able
to meet the nation’s transportation needs.

                                                                                                               1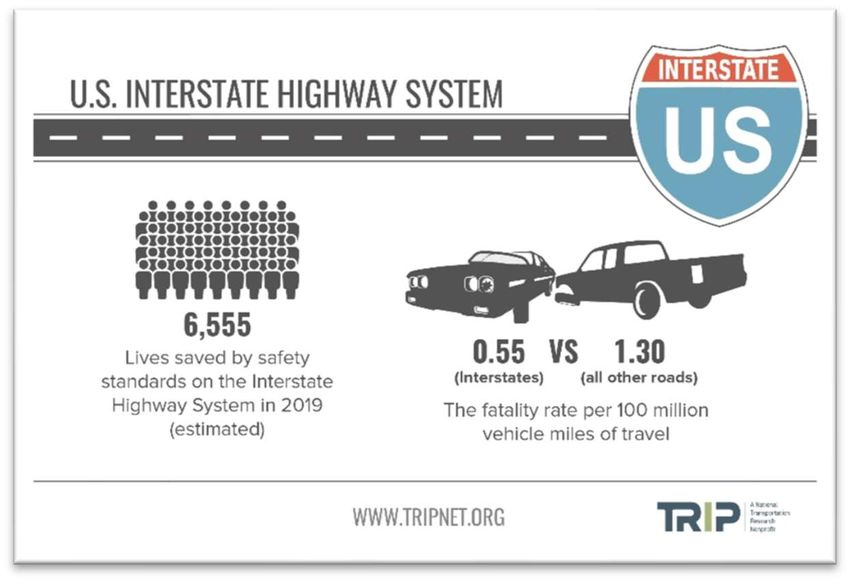
TRB INTERSTATE HIGHWAY SYSTEM REPORT REQUESTED BY CONGRESS
In 2015, as part of the Fixing America’s Surface Transportation (FAST) Act, the U.S. Congress
requested a report evaluating the condition of the Interstate Highway System and providing
recommendations on actions required to restore and upgrade the System to meet the growing and
shifting transportation demands of the 21st Century. The report was conducted by the
Transportation Research Board (TRB), a division of the National Academies of Sciences, Engineering
and Medicine. The findings of the TRB report, released in 2019, include:
The Interstate Highway System has a persistent and growing backlog of physical and
operational deficiencies as a result of age, heavy use and deferred reinvestment, and is in need
of major reconstruction and modernization.
Most roadway segments of the Interstate Highway System retain their original underlying
foundations and need to be completely rebuilt from the subbase up.
The repeated resurfacing of Interstate highways is not addressing the deterioration of roadway
subbases. Repeated resurfacing – rather than addressing underlying foundational issues -
provides diminishing returns as additional resurfacing results in increasingly shorter periods of
pavement smoothness and is likely to result in higher lifecycle costs than periodic
reconstruction.
The modernization of the Interstate Highway System needs to include the following:
reconstruction of the majority of Interstate highways and bridges, including their foundations;
the upgrade of most interchanges to improve their function and safety; the addition of capacity
along existing corridors, the construction of new routes and the conversion of some existing
routes to Interstate standards; the modification of some urban segments to maintain
connectivity while remediating economic and social disruption; and, further improvement of
highway safety features.
To address the physical and operational deficiencies identified in the TRB report, annual
investment in the Interstate Highway System should be increased by approximately two-and-a-
half times, from its current level of $23 billion in 2018 to $57 billion annually over the next 20
years.
The restoration of the nation’s Interstate Highway System will require strong federal leadership
and a robust federal-state partnership.
INTERSTATE USE AND CHARACTERISTICS
The Dwight D. Eisenhower National System of Interstate and Defense Highways, which has been
called the most ambitious public works project built since the Roman Empire, is the most critical link
in the nation’s transportation system.
The Interstate Highway System, which includes 2.6 percent of all roadway lane miles in the U.S.,
carries 26 percent of the nation’s vehicle travel.
The 48,482-mile Interstate Highway System includes 10 transcontinental routes and highways
varying in length from 18 miles to more than 3,000 miles.
2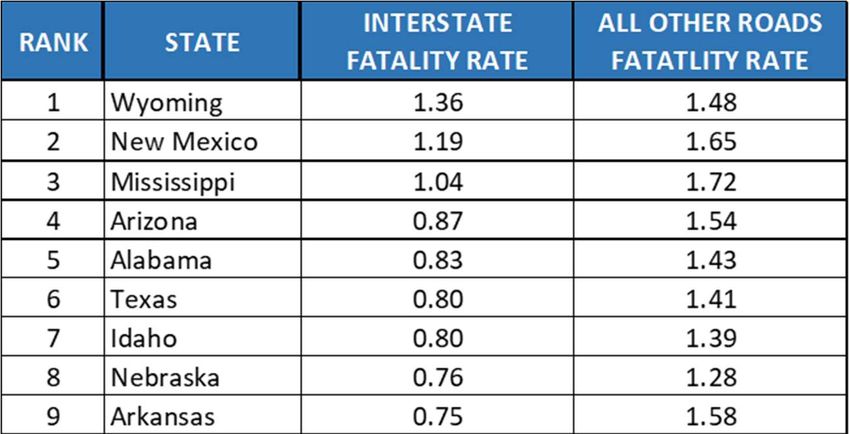
Since funding of the Interstate system was approved in 1956 to 2019, annual vehicle miles of
travel (VMT) in the U.S. increased by 427 percent, from 626 billion miles driven, to
approximately 3.3 trillion miles driven.
From 1956 to 2019, the number of vehicles in the nation increased by 324 percent, from 65
million vehicles to 276 million vehicles. The nation’s population increased by 96 percent, from
168 million to 329 million during this time.
Due to the COVID-19 pandemic, vehicle travel on the U.S. Interstate Highway System dropped
by as much as 45 percent in April 2020 (as compared to vehicle travel during the same month
the previous year) but rebounded to six percent below April 2019 (the previous pre-COVID-19
April) levels by April 2021.
INTERSTATE HISTORY
The need for a transcontinental highway system in the U.S. was recognized as early as 1919, and an
initial Interstate plan was completed in the late 1930s. But it was not until Congress approved a
suitable funding mechanism in 1956 that the Interstate Highway System became a reality.
In 1919, Lieutenant Dwight D. Eisenhower participated in the U.S. Army’s first transcontinental
motor convoy, from Washington, DC, to San Francisco, California. The trip took 62 days, largely
due to inadequate roads and highways.
In 1954, President Eisenhower appointed a committee to draft a proposal to fund a national
system of Interstate Highways. The initial proposal, subsequently dismissed by Congress, called
for financing a national Interstate system through bond financing.
Nationwide construction of the Interstate Highway System began in 1956 following the
approval of the Federal-Aid Highway Act of 1956. Some segments of urban and regional
highways built prior to 1956 were later incorporated into the Interstate Highway System.
The Federal-Aid Highway Act of 1956, signed into law by President Dwight Eisenhower on June
29, 1956, called for the construction of a 41,000-mile system of Interstate highways. The Act
3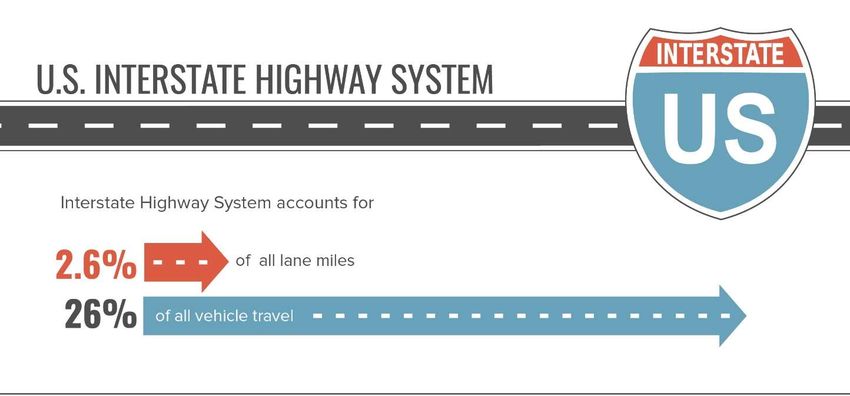
called for the Interstates to be paid for by taxes on motorists, such as the federal motor fuel
tax, with the federal government paying 90 percent of the initial construction costs.
The federal motor fuel tax was set at three cents-per-gallon in 1956. Last increased in 1993, the
tax is currently 18.4 cents-per-gallon.
Revenue collected from the 18.4 cents-per-gallon federal motor fuel tax and the 24.4 cents-per-
gallon federal diesel fuel tax are the primary sources of funding for the federal Highway Trust
Fund, which distributes funds to state and local governments for highway and bridge repairs as
well as other surface transportation improvements, including public transit, pedestrian and
bicycling facilities.
INTERSTATE ROAD AND BRIDGE CONDITIONS
While pavement smoothness and bridge conditions on the Interstate system are acceptable, as the
aging system’s foundations continue to deteriorate, most Interstate highways, bridges and
interchanges will need to be reconstructed or replaced.
Pavements on 11 percent of Interstate highways are in poor or mediocre condition, with three
percent rated in poor condition and eight percent rated in mediocre condition. Another nine
percent of Interstate pavements are in fair condition and the remaining 80 percent are in good
condition.
The chart below shows the states with the greatest share of their Interstate highways with
pavements in poor condition. Data for all states can be found in the Appendix.
INTERSTATE PAVEMENT
RANK STATE
IN POOR CONDITION
1 Hawaii 23%
2 Delaware 9%
3 New Jersey 9%
4 Louisiana 7%
5 New York 6%
6 Colorado 6%
7 Michigan 6%
8 California 6%
9 Maryland 5%
10 Indiana 5%
11 Pennsylvania 5%
12 Washington 5%
13 South Carolina 4%
14 Arkansas 4%
15 Illinois 4%
16 Oklahoma 4%
17 Minnesota 4%
18 Alabama 4%
19 Ohio 3%
20 West Virginia 3%
4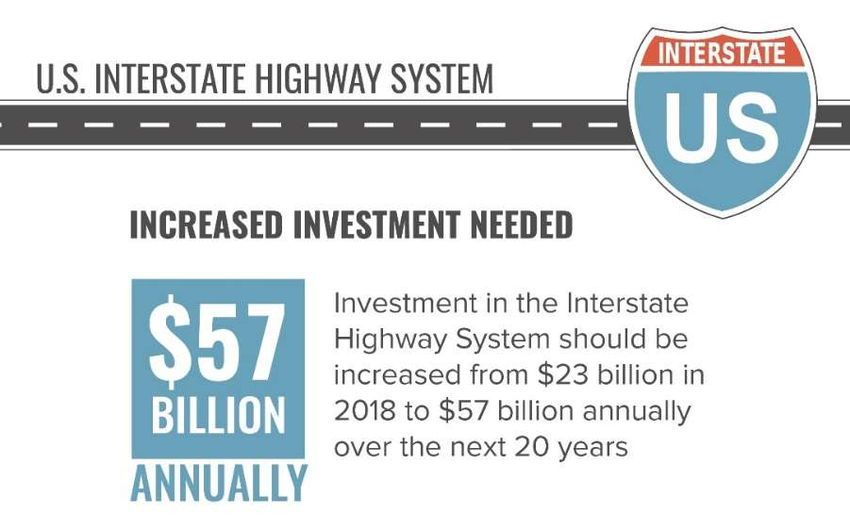
Three percent of the nation’s Interstate bridges are rated in poor/structurally deficient
condition, and 57 percent are rated in fair condition. A bridge is rated in poor/structurally
deficient condition if there is significant deterioration of the bridge deck, supports or other
major components.
The chart below shows states with the greatest share of Interstate bridges rated
poor/structurally deficient. Data for all states can be found in the Appendix.
INTERSTATE BRIDGES
RANK STATE POOR/STRUCTURALLY
DEFICIENT
1 West Virginia 13%
2 Rhode Island 12%
3 Illinois 8%
4 Massachusetts 7%
5 New York 6%
6 Michigan 6%
7 Colorado 5%
8 Maine 5%
9 Washington 5%
10 Missouri 5%
11 Idaho 4%
12 Pennsylvania 4%
13 Wyoming 3%
14 Montana 3%
15 Louisiana 3%
16 California 3%
17 Connecticut 3%
18 New Mexico 3%
19 New Jersey 3%
20 North Carolina 3%
The intended lifespan of many of the nation’s Interstate bridges at the time of their
construction is 50 years, though newer bridges are often built with longer-lasting materials and
techniques that allow for a longer intended lifespan. Older bridges often need significant
repairs or rehabilitation or may need to be replaced to continue to provide adequate service.
The average age of the nation’s Interstate bridges is 46 years. Fifty-four percent of the nation’s
Interstate bridges are at least 50 years old. The chart below shows states with the largest share
of Interstate bridges 50 years old or older. Data for all states can be found in the Appendix.
5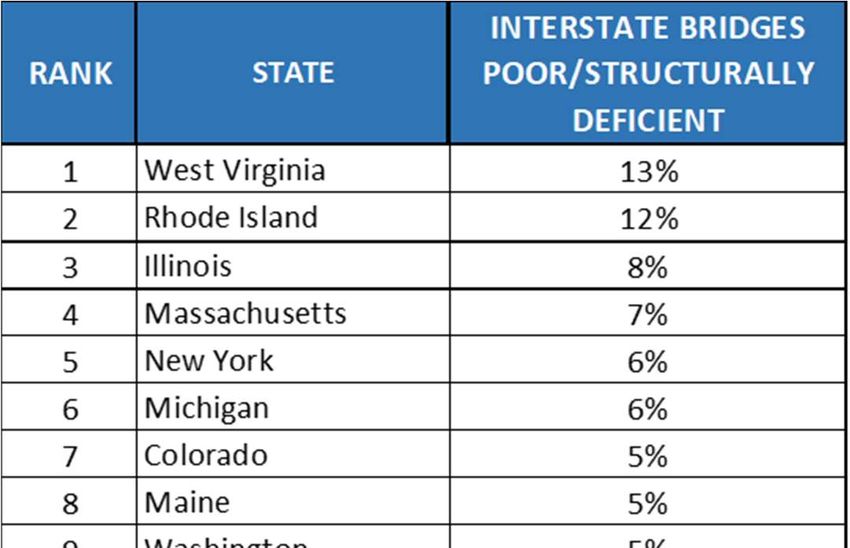
INTERSTATE CONGESTION
Traffic congestion is increasing on the Interstate Highway System as the amount of vehicle travel far
outstrips the capacity added to the system. Nearly half of the length of the nation’s urban Interstates
is congested.
Travel on the nation’s Interstate highways is increasing at a rate nearly triple the rate that new
lane capacity is being added. From 2000 to 2019, vehicle travel on Interstate highways
increased 26 percent, from 662 billion miles traveled annually to 837 billion miles. From 2000 to
2019, lane miles of Interstates increased nine percent, from 208,502 to 227,129. miles.
6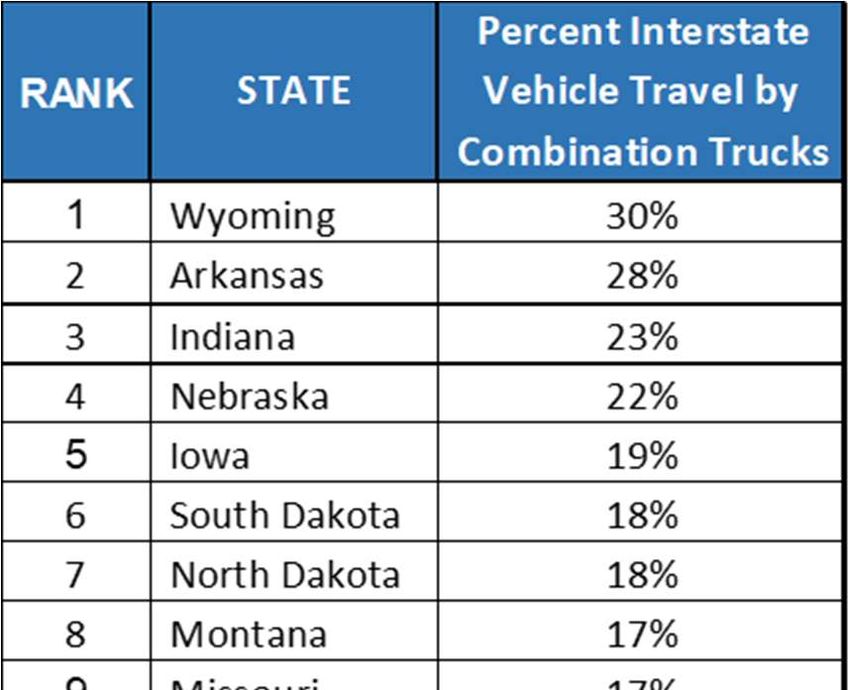
Forty-seven percent of the nation’s urban Interstate highways (9,046 of 19,177 miles) are
considered congested because they carry traffic levels that result in significant delays during
peak travel hours. The chart below shows the states with the greatest share of their urban
Interstate highways considered congested. Data for all states can be found in the Appendix.
Congested Urban
RANK STATE
Interstates
1 California 87%
2 Maryland 83%
3 New Jersey 81%
4 Delaware 71%
5 Florida 70%
6 Massachusetts 68%
7 Rhode Island 65%
8 Connecticut 63%
9 Hawaii 60%
10 Washington 58%
11 Texas 58%
12 Georgia 57%
13 Colorado 57%
14 Minnesota 56%
15 New Hampshire 54%
16 Virginia 52%
17 Kentucky 51%
18 South Carolina 50%
19 Utah 49%
20 Ohio 48%
7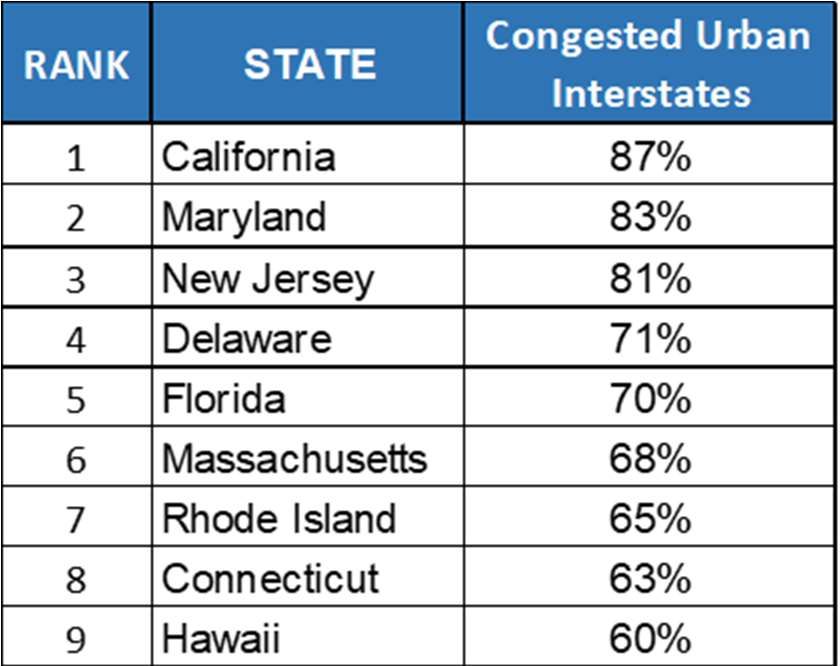
The chart below shows the states with the greatest increase in vehicle miles of travel on their
Interstate highways from 2000 to 2019. Data for all states can be found in the Appendix.
2000-19 Interstate
RANK STATE
VMT Increase
1 Nevada 69%
2 Louisiana 61%
3 North Carolina 57%
4 Utah 57%
5 Colorado 53%
6 Texas 49%
7 Mississippi 45%
8 Idaho 44%
9 Wisconsin 42%
10 Florida 41%
11 North Dakota 41%
12 South Carolina 39%
13 New Jersey 36%
14 Arkansas 35%
15 Montana 34%
16 Alabama 33%
17 Tennessee 33%
18 South Dakota 30%
19 Iowa 27%
20 Kentucky 26%
8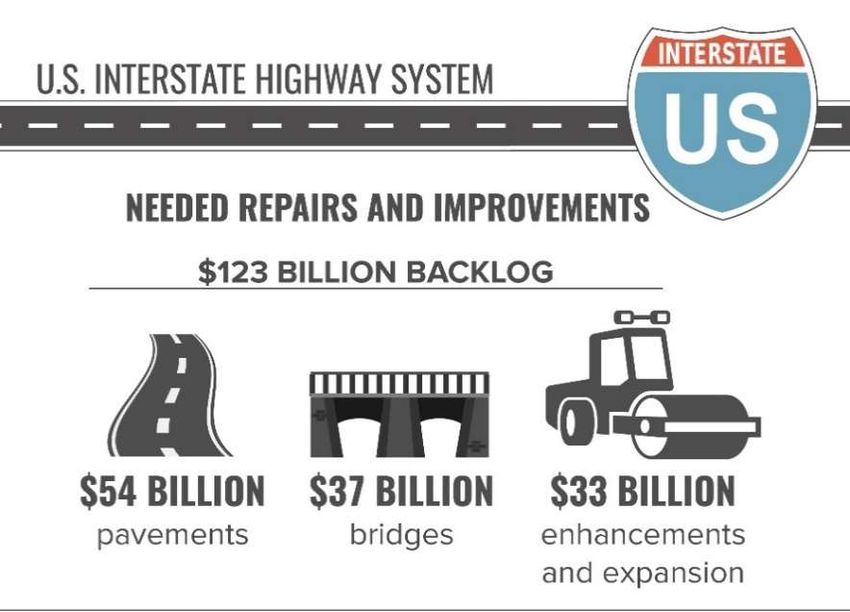
The chart below shows the states with the busiest urban Interstates, as measured by average
daily traffic per lane mile. Data for all states can be found in the Appendix.
Daily Interstate
RANK STATE Travel Per
Lane Mile
1 California 20,957
2 Maryland 20,214
3 Hawaii 17,864
4 Colorado 17,702
5 Florida 17,145
6 Texas 17,123
7 Rhode Island 16,644
8 Massachusetts 16,326
9 Washington 16,251
10 New Jersey 16,053
11 Delaware 15,956
12 Connecticut 15,514
13 Georgia 15,325
14 Virginia 15,207
15 Nevada 15,130
16 Arizona 15,016
17 Tennessee 14,718
18 Louisiana 14,452
19 Kentucky 14,404
20 Minnesota 14,236
INTERSTATE FATALITY RATES AND SAFETY
The Interstate Highway System provides a network of highways with a variety of safety designs that
greatly reduce the likelihood of serious crashes. Travel on the nation’s Interstate highways is more
than twice as safe as travel on all other roadways.
The Interstate Highway System, which carried 26 percent of the nation’s travel in 2019,
accounted for only 13 percent of the nation’s traffic fatalities as a result of superior safety
features.
The features that make Interstates safer than other roads include a separation from other roads
and rail lines, a minimum of four-lanes, gentler curves, paved shoulders, median barriers, and
rumble strips to warn drivers when they are leaving the roadway.
Travel on the nation’s Interstate highways is nearly two and a half times as safe as travel on all
other roadways. The fatality rate per 100 million vehicle miles of travel on the Interstate system
in 2019 was 0.55, compared to 1.30 on non-Interstate routes.
9 The chart below details states with the highest traffic fatality rates in 2019 on their Interstate
highways and the fatality rate on all other roads in those states. Data for all states can be found
in the Appendix.
INTERSTATE ALL OTHER ROADS
RANK STATE
FATALITY RATE FATATLITY RATE
1 Wyoming 1.36 1.48
2 New Mexico 1.19 1.65
3 Mississippi 1.04 1.72
4 Arizona 0.87 1.54
5 Alabama 0.83 1.43
6 Texas 0.80 1.41
7 Idaho 0.80 1.39
8 Nebraska 0.76 1.28
9 Arkansas 0.75 1.58
10 Florida 0.72 1.56
11 South Carolina 0.71 2.14
12 Georgia 0.71 1.26
13 Kansas 0.70 1.48
14 Montana 0.70 1.67
15 Tennessee 0.70 1.65
16 Oklahoma 0.70 1.68
17 Missouri 0.69 1.27
18 Delaware 0.67 1.39
19 Nevada 0.66 1.18
20 Kentucky 0.55 1.90
TRIP estimates that the Interstate Highway System saved 6,555 lives in 2019, based on an
estimate of the number of additional fatalities that would have occurred had Interstate traffic
been carried by other major roadways, which often have higher traffic fatality rates and may
lack the safety features common to Interstate routes.
Based on TRIP estimates, the chart below shows the states where the most lives were saved in
2019 due to the increased traffic safety provided by the Interstate Highway System. Data for all
states can be found in the Appendix.
10LIVES SAVED BY
RANK STATE
INTERSTATES IN 2019
1 California 765
2 Florida 454
3 Texas 449
4 Ohio 295
5 Pennsylvania 290
6 South Carolina 278
7 Illinois 267
8 Tennessee 253
9 North Carolina 234
10 Kentucky 228
11 Louisiana 225
12 Virginia 205
13 New York 202
14 Georgia 185
15 Michigan 177
16 Oregon 144
17 Arizona 142
18 Missouri 137
19 Indiana 134
20 Washington 130
INTERSTATE TRAVEL AND ECONOMIC GROWTH
The Interstate Highway System is the backbone of the nation’s economy and has played a critical
role in improving the country’s business productivity. Since 2000, the amount of combination truck
travel on Interstates has increased at a rate more than double that of total travel on the system.
The Interstate system carried 55 percent of all large commercial truck travel in the U.S. in 2019.
Travel by combination trucks on the Interstate Highway System increased 43 percent from 2000
to 2019, while overall vehicle travel increased 26 percent. From 2010 to 2019, travel by
combination trucks on the Interstate Highway System increased 14 percent, outpacing the 10
percent rate of growth for all vehicle travel during the same period.
Travel by combination trucks, which are the large trucks that carry the majority of freight
shipped in the U.S., accounted for 12 percent of all vehicle miles of travel on the Interstate
Highway System in 2019.
The chart below shows the states with the greatest share of Interstate vehicle travel by
combination trucks. Data for all states can be found in the Appendix.
11Percent Interstate
RANK STATE Vehicle Travel by
Combination Trucks
1 Wyoming 30%
2 Arkansas 28%
3 Indiana 23%
4 Nebraska 22%
5 Iowa 19%
6 South Dakota 18%
7 North Dakota 18%
8 Montana 17%
9 Missouri 17%
10 West Virginia 17%
11 Illinois 17%
12 Mississippi 17%
13 Kentucky 17%
14 Maine 16%
15 Kansas 16%
16 Tennessee 16%
17 Oregon 16%
18 Idaho 15%
19 Oklahoma 15%
20 Alabama 14%
Every year, $18.9 trillion in goods are shipped from sites in the U.S.
Seventy-two percent of the goods shipped annually from sites in the U.S. are carried by trucks
and another 14 percent are carried by courier services, which use trucks for part of the
deliveries.
The completion of the vast majority of the Interstate system by the 1980s, and the deregulation
of the U.S. trucking industry, resulted in a significant improvement in the competitiveness of
U.S. business. The cost of moving freight, as measured by U.S. business logistics costs, dropped
from 16 percent of U.S. Gross Domestic Product (GDP) in 1980 to eight percent in 2018.
The TRB report found that U.S. counties either on an Interstate highway or within 20 miles of an
Interstate are anticipated to grow in population through 2060 at a rate approximately seven
times greater than counties that are at least 20 miles from an Interstate highway (36 percent
versus five percent).
The Interstate Highway System has reduced travel times between destinations throughout the
U.S. The improved mobility provided by the Interstate Highway System has given Americans
greater choices about where they live, work, shop and spend their leisure time.
Forty-nine of the 50 top truck bottlenecks identified by the American Transportation Research
Institute (ATRI) in its 2021 annual list of the nation’s top 100 truck bottlenecks are on Interstate
Highways. The top 20 truck bottlenecks are listed below, with all 50 included in the Appendix.
12RANK STATE Top Bottlenecks
1 NJ Fort Lee, NJ I-95 at SR 4
2 OH Cincinnati, OH I-71 at I-75
3 GA Atlanta, GA I-285 at I-85 (North)
4 GA Atlanta, GA I-20 at I-285 (West)
5 TX Houston, TX I-45 at I-69/US 59
6 IL Chicago, IL I-290 at I-90/I-94
7 TN Chattanooga, TN I-75 at I-24
8 MO St. Louis, MO I-64/I-55 at I-44
9 NY Rye, NY I-95 at I-287
10 CA San Bernardino, CA I-10 at I-15
11 CA Los Angeles, CA SR 60 at SR 57
12 TX Dallas, TX I-45 at I-30
13 TN Nashville, TN I-24/I-40 at I-440 (East)
14 NY Brooklyn, NY I-278 at Belt Parkway
15 TX Austin, TX I-35
16 GA Atlanta, GA I-75 at I-285 (North)
17 TX Houston, TX I-45 at I-610 (North)
18 LA Baton Rouge, LA I-10 at I-110
19 IL Chicago, IL I-90 at I-94 (South)
20 CO Denver, CO I-70 at I-25
INTERSTATE FUNDING CHALLENGES
The U.S. Department of Transportation (USDOT) has determined that the nation faces a significant
backlog in needed Interstate highway repairs and improvements.
The current backlog of needed improvements on the nation’s Interstate Highway System is
estimated by the USDOT to be $123 billion.
The backlog on the nation’s Interstate Highway System includes $54 billion needed to improve
pavement conditions, $37 billion to improve bridges and $33 billion for needed system
expansion and enhancement.
The primary source of revenue for the Interstate Highway System is the federal surface
transportation program, which was set to expire on September 30, 2020 and extended by one year
by Congress to September 30, 2021. The program does not have a long-term and sustainable revenue
source.
Signed into law in December 2015, the Fixing America’s Surface Transportation (FAST Act),
provides modest increases in federal highway and transit spending. The bill also provides states
with greater funding certainty and streamlines the federal project approval process. But, the
FAST Act does not provide adequate funding to meet the nation’s need for highway and transit
improvements and does not include a long-term and sustainable funding source.
Revenue collected from the 18.4 cents-per-gallon federal motor fuel tax and the 24.4 cents-per-
gallon federal diesel fuel tax are the primary sources of funding for the federal Highway Trust
13Fund, which distributes funds to state and local governments for highway and bridge repairs
and other surface transportation improvements, including public transit, pedestrian and
bicycling facilities.
RECOMMENDATIONS FOR RESTORING THE INTERSTATE HIGHWAY SYSTEM
Restoring and upgrading the Interstate Highway System to meet 21st Century transportation needs
will require strong federal leadership and a robust federal-state partnership to reestablish the
Interstate Highway System as the nation’s premier transportation network. The TRB Interstate
report notes that “the scale and scope of the Interstate reinvestment imperative is daunting.”
The following recommendations, based on the findings and recommendations of the TRB
Interstate report, provide a roadmap for the restoration of the Interstate Highway System:
o Reconstruct the nation’s Interstate Highway System, including pavements, bridges and
interchanges
o Improve safety features on Interstate highways
o Right-size the Interstate Highway System by:
upgrading some existing roadways to Interstate standard
adding needed additional highway capacity on existing routes to maintain and improve
mobility
adding additional corridors to accommodate demographic and economic growth
modifying some urban segments to maintain connectivity while remediating economic
and social disruption
All data used in this report is the most current available. Sources of information for this report include: The Federal
Highway Administration (FHWA), the National Highway Traffic Safety Administration (NHTSA), the Transportation
Research Board (TRB), and the U.S. Census Bureau. Cover photo credit: U.S. Geological Survey.
14Introduction
Stretching from South Florida to the Canadian border in Maine, straddling the Puget Sound
region of Washington State and reaching the Mexican border south of San Diego, the Interstate
Highway System connects the United States, providing its citizens and visitors with an unrivaled level of
access and mobility.
The Dwight D. Eisenhower National System of Interstate and Defense Highways, built at a cost
of $114 billion ($209 billion in current dollars), has been called the most ambitious public works project
built since the age of the Roman Empire, and is the backbone of America’s economy and the most
critical element of the nation’s transportation system. Today, the Interstate Highway System continues
to provide Americans with economic growth, improved traffic safety and convenient access, while also
playing a role in the nation’s defense.
Concerned with the decline in the condition, reliability and safety of the nation’s preeminent
transportation system, Congress in 2015, as part of the legislation authorizing the five-year Fixing
America’s Surface Transportation Act (FAST-Act), required that a comprehensive report be prepared on
the Interstate Highway System. The U.S. Congress asked the Transportation Research Board (TRB), a
division of the National Academy of Sciences, Engineering and Medicine, to develop the report, which
was to include an examination of the condition of the Interstate Highway System and provide
recommendations on actions necessary to restore and upgrade the system to meet the transportation
needs of the 21st Century. The findings of TRB’s report, “Renewing the National Commitment to the
Interstate Highway System: A Foundation for the Future,” confirmed Congress’ fears for the nation’s
Interstate highways.
“The Interstate Highway System’s physical condition and operating performance continue to
exhibit deficiencies, and much of the Interstate System is already past due for major reconstruction
and modernization as a result of heavy use and the effects of age, exacerbated by escalating use and
deferred reinvestment,” notes the report.1 “ These aging and intensely used segments, whose numbers
are expected to grow over the next 20 years, are poorly positioned to accommodate even modest
projections of future traffic growth, much less the levels of growth actually experienced over the past
50 years.”2
This report examines the benefits, history and impact of the Interstate Highway System, its
current use and condition, and the future needs of the nation’s most critical transportation system. It
concludes with a set of recommendations based on the findings of the TRB report to restore, renew
and upgrade the nation’s most critical transportation system.
Development of the U.S. Interstate System
In 1919, Lieutenant Dwight D. Eisenhower participated in the U.S. Army’s first transcontinental
motor convoy, from Washington, DC, to San Francisco, California. During the 62 days it took to cross
the country, the convoy experienced many difficulties, including roads that were muddy, narrow or
otherwise inadequate, and bridges that often could not support the vehicles in the convoy.
A generation later, General Eisenhower saw firsthand how an efficient, effective highway
transportation system benefited a nation when the German Autobahn network, opened in 1935,
provided a significant military advantage to Germany.
The United States also began looking at the feasibility of constructing a series of interregional
highways in the late 1930s. In 1938 Congress directed the then Bureau of Public Roads (BPR) to
prepare a study on the possibility of building a national system of toll highways. The resulting 1939 BPR
report concluded that it would be impossible to finance a national system of highways strictly through
15charging tolls, but did recommend that the U.S. build a system of approximately 26,700 miles of
transcontinental highways. The BPR report also called for many of the design elements found on
modern Interstate highways, including limited access, which separates highway traffic from other
traffic and from trains. The report also suggested that the nation’s highways should connect with the
center of large cities, include beltways around large urban areas, and bypass small towns.
Further attempts to develop a national highway system were interrupted by World War II. But,
as the Allies gained the upper hand in the war, Congress started to turn its attention to post-war
challenges, including consideration of a modern highway system to support the nation’s growing
economy and improve safety and mobility. The Federal-Aid Highway Act of 1944 authorized the BPR to
designate a system of approximately 40,000 miles of Interstate highways, which proved very similar to
the routes ultimately approved as the national Interstate system. But, the 1944 highway bill did not
specify any additional funds for construction of the highways, other than the small amount of funds
then made available by the federal government for highway construction.
The 1944 Highway Act identified the need for a national system of interconnected highways,
but left out a key piece of the puzzle – how to fund a uniformly designed national highway system,
which would have significant differences in construction costs and traffic volume, depending on
location. Even without significant federal funding available, cities and states began to move forward on
their own, with some additional highway networks being built or planned in current Interstate
corridors, under various financing mechanisms. These early highway projects included toll highways,
such as the Pennsylvania Turnpike and the New York Thruway, and early urban highways including the
Los Angeles Freeway System and the Detroit Expressway System. However, for most motorists and
businesses, the inadequate roadway system of the late 1940s and early 1950s contributed to growing
human and economic losses, as cars and trucks jostled for position on the nation’s inadequate, narrow
and winding roads and streets.
In 1954 President Eisenhower appointed a committee to draft a proposal to fund a national
system of Interstate Highways. Eisenhower noted that the nation’s obsolete highway system penalized
Americans through increased traffic deaths, the waste of time caused by traffic delays, the increased
cost of freight movement, and the inability of the nation’s highways to meet the mobility demands that
would be caused by a regional catastrophe or national defense emergency.
The initial plan prepared for President Eisenhower called for funding a national Interstate
System through bond financing, but Congress dismissed the use of bond revenue as the primary source
of Interstate highway financing. In 1956, Congress overwhelmingly approved the construction of a
national Interstate Highway System when the financing was changed to a pay-as-you-go format that
would collect a series of user fees -- most notably a three cents-per-gallon tax on motor fuel -- into a
national Highway Trust Fund.
The Federal-Aid Highway Act of 1956 called for the construction of a 41,000-mile Interstate
Highway System, which was to be completed by 1970 at a cost of approximately $27 billion. The design
of the system was very similar to the initial 1944 plan, which called for connecting large urban areas,
including routing highways into central cities, largely at the request of mayors and other local
politicians who feared that their communities would be left behind without modern highway access.
The Interstate system was designated to incorporate approximately 2,000 miles of existing highways,
including the Pennsylvania Turnpike and the New York Thruway. The highways were to be built to high
design standards that would reduce traffic deaths and increase the amount and speed of traffic that
could be carried. These design standards included: full access control to limit entrance and exit to on
and off ramps, a minimum of four lanes, medians to separate oncoming lanes, and moderate curves.
16Construction of the Interstate System
Following President Eisenhower’s signing of the Federal-Aid Highway Act of 1956 on June 29,
1956, the nation moved quickly to orient its highway program toward the enormous task of planning
and constructing the nation’s eventual 48,482-mile Interstate system.
The first construction contracts awarded under the provisions of the 1956 Interstate legislation
were in Missouri in August of 1956,for portions of Interstate 44 in Laclede County and a portion of
Interstate 70 in St. Charles County.3 The first section of Interstate highway on which construction was
completed under the provisions of the Federal -Aid Highway Act of 1956 was a portion of Interstate 70
in Northeast Kansas, which was completed in November, 1956.4 The majority of the nation’s Interstate
system was completed by 1986, when 92 percent of the Interstate system’s current length and 86
percent of lane miles were complete. By 1996, 98 percent of the Interstate system’s current length and
96 percent of lane miles were complete.5
The Interstate Highway System
Today, the 48,482-mile Interstate Highway System includes 10 transcontinental routes and
highways varying in length from 18 miles to more than 3,000 miles. The Interstate Highway System
includes three east-west transcontinental routes: Interstate 10 from Los Angeles, California to
Jacksonville, Florida; Interstate 80 from San Francisco, California to Teaneck, New Jersey; and,
Interstate 90 from Seattle, Washington to Boston, Massachusetts.
The Interstate Highway System also includes seven north-south transcontinental routes:
Interstate 5 from San Diego, California to Blaine, Washington; Interstate 15 from San Diego, California
to Sweetgrass, Montana; Interstate 35 from Laredo, Texas to Duluth, Minnesota; Interstate 55 from
New Orleans, Louisiana to Chicago, Illinois; Interstate 65 from Mobile, Alabama to Gary, Indiana;
Interstate 75 from Miami, Florida to Sault Ste. Marie, Michigan; and, Interstate 95 from Miami, Florida
to Houlton, Maine.
The longest Interstate route, excluding three-digit urban routes, is Interstate 90 from Seattle,
Washington to Boston, Massachusetts, which is 3,021 miles in length. The shortest Interstate route,
excluding three-digit urban routes, is Interstate 97 in Maryland, which runs 18 miles from Annapolis to
Baltimore.
The Interstate route that traverses the most states is Interstate 95, which passes through 15
states: Florida, Georgia, South Carolina, North Carolina, Virginia, Maryland, Delaware, Pennsylvania,
New Jersey, New York, Connecticut, Rhode Island, Massachusetts, New Hampshire and Maine.
Trends in Interstate Travel and Capacity
Since the beginning of the Interstate era 65 years ago, the U.S. has seen enormous increases in
population, motor vehicles and vehicle travel. From 1956 to 2020, the nation’s population increased
by 96 percent, from 168 million to 329 million.6 From 1956 to 2019, the number of motor vehicles
increased by 324 percent, from 65 million to 276 million7, and vehicle travel increased by 427 percent,
from 626 billion miles driven annually to approximately 3.3 trillion. 8
17Chart 1. Increase since 1956 in Population, Vehicles and Vehicle Travel in the U.S. (1 = 1956 level).
Source: TRIP analysis of U.S. Census and Federal Highway Administration data.
The Interstate Highway System remains the most critical component of the nation’s
transportation system. While Interstate highways account for only 2.6 percent of all lane miles of
roads in the U.S., they carry 26 percent of all travel.9
Travel on Interstate highways is growing at nearly triple the rate that new lane capacity is being
added. From 2000 to 2019, vehicle travel on Interstate highways increased 26 percent, from 662
billion miles traveled annually to 837 billion miles.10 Yet, during the same period, total lanes miles on
the nation’s Interstate system increased by nine percent, from 208,502 miles to 227,129. 11
18Chart 2. Increase in Interstate vehicle travel vs. lane miles from 2000 to 2019.
Source: TRIP analysis of FHWA data.
As a result of the increase in travel on the nation’s Interstate system without a corresponding
increase in Interstate lane mileage, these highways are more crowded than in the past. The average
annual amount of travel per Interstate lane-mile increased 16 percent from 2000 to 2019. 12
The chart below shows the states with the greatest increase in vehicle miles of travel (VMT) on
their Interstate highways from 2000 to 2019. Data for all states can be found in the Appendix.
Chart 3. States with Largest Increase in Interstate Vehicle Travel from 2000 to 2019.
Source: TRIP analysis of FHWA data
19Due to the COVID-19 pandemic, vehicle travel on the U.S. Highway System dropped by as much
as 45 percent in April 2020 (as compared to vehicle travel during the same month the previous year)
but rebounded to six percent below April 2019 (the previous pre-COVID-19 April) levels by April 2021. 13
Pavement Conditions on the Interstate System
The lifecycle of highway pavements is greatly affected by a transportation agency’s ability to
perform timely maintenance and upgrades to ensure that surfaces remain smooth as long as possible.
The pavement condition of major roads is evaluated and classified as being in poor, mediocre, fair or
good condition.
In 2019, pavement on 11 percent of the nation’s Interstate highways was rated in poor or
mediocre condition, with three percent rated poor and eight percent rated mediocre. 14 Roads rated
poor often have pavements that are cracked or broken. In some cases, poor roads can be resurfaced,
but often are too deteriorated and must be reconstructed. Roads rated in mediocre condition show
signs of significant wear and may also have some visible pavement distress. Most pavements in
mediocre condition can be repaired by resurfacing, but some may need more extensive reconstruction
to return them to good condition. An additional nine percent of Interstate pavements are rated in fair
condition and the remaining 80 percent are rated in good condition.15
Pavement deterioration is caused by a combination of traffic, moisture and climate. Moisture
often works its way into road surfaces and the materials that form the road’s foundation. Road
surfaces at intersections are even more prone to deterioration because the slow-moving or standing
loads occurring at these sites subject the pavement to higher levels of stress. It is critical that roads are
fixed before they require major repairs because reconstructing roads costs approximately four times
more than resurfacing them.16
The chart below shows the states with the greatest share of their Interstate highways with
pavements in poor condition. Data for all states can be found in the Appendix.
20Chart 4. States with greatest share of Interstate highways with pavements in poor condition (2019).
Source: TRIP analysis of FHWA data.
The 2019 TRB Interstate report found that more than half a century of intensive use has taken a
toll on the system, and that most segments of the system need to be rebuilt from the subbase up. The
report found that most of the nation’s Interstate miles have been subject to age and wear with only
periodic resurfacing, resulting in a significant backlog of needed reconstruction of the roadway’s
original underlying structure.17 The TRB report found that the repeated resurfacing of Interstate
highways is not addressing the deterioration of subbases of the roadways and results in diminishing
returns. This leads to shorter periods of serviceability between successive overlays and can produce
higher life-cycle costs relative to full-depth periodic pavement reconstruction. 18
Interstate Bridge Conditions
Of the 58,470 bridges on the U.S. Interstate system, three percent are rated in poor/structurally
deficient condition and 57 percent are rated in fair condition. 19
Bridges that are rated poor/structurally deficient show significant signs of deterioration as a
result of use and exposure. The FHWA defines a poor/structurally deficient bridge as one that requires
immediate rehabilitation to remain open, is restricted to carrying lighter- weight vehicles, or is closed.
The chart below shows states with the greatest share of Interstate bridges in poor/structurally
deficient condition. Data for all states can be found in the Appendix.
21Chart 5. States with greatest share of Interstate bridges rated poor/structurally deficient (2020).
Source: TRIP analysis of National Bridge Inventory data.
The average lifespan of the nation’s Interstate bridges is 50 years.20 Older bridges often need
significant repairs or rehabilitation or may need to be replaced to continue to provide adequate
service. The average age of the nation’s Interstate bridges is 46 years. Fifty-four percent of the nation’s
Interstate bridges are at least 50 years old. The chart below shows states with the highest share of
Interstate bridges that are 50 years old or older. Data for all states can be found in the Appendix.
22Chart 6. States with greatest share of Interstate bridges that are 50 years old or older (2019).
Share of bridges
RANK STATE
50+ Years
1 Wyoming 76%
2 Connecticut 74%
3 Massachusetts 73%
4 Oklahoma 68%
5 Arizona 67%
6 Ohio 66%
7 Maine 66%
8 Rhode Island 66%
9 New Hampshire 65%
10 Vermont 65%
11 Idaho 65%
12 New Jersey 63%
13 California 63%
14 Mississippi 61%
15 Kansas 61%
16 North Dakota 60%
17 Pennsylvania 60%
18 Indiana 60%
19 New Mexico 60%
20 Delaware 58%
Source: TRIP analysis of National Bridge Inventory data.
Traffic Congestion on the Interstates
The Interstate Highway System was initially designed to provide transportation between the
nation’s urban areas and to support national defense. But, as Interstate highways were ultimately built
around and through many cities, they became the nation’s most critical transportation corridors
between, and often within, urban areas.
The continued increase in Interstate highway travel has resulted in a surge in traffic congestion
levels. Forty-seven percent of the nation’s urban Interstates (9,046 of 19,177 miles) are considered
congested because they carry traffic levels that result in delays during peak travel hours. 21 The chart
below shows states with the greatest share of congested urban Interstates.22 Data for all states can be
found in the Appendix.
23Chart 7. States with Greatest Share of Urban Interstates That Experience Congestion during Peak Hours, 2019.
Source: TRIP analysis of FHWA data.
The chart below details states with the busiest urban Interstates, as measured by the number
of vehicles carried daily per Interstate lane mile. 23 Data for all states can be found in the Appendix.
24Chart 8. States with Greatest Daily Travel Per-Lane-Mile on Urban Interstates, 2019.
Source: TRIP analysis of FHWA data.
Freight Shipment by Large Trucks on the Interstates
Every year, $18.9 trillion in goods are shipped from sites in the U.S., to domestic and
international destinations.24 Seventy-two percent of the goods shipped annually from sites in the U.S.
are carried by trucks and another 14 percent are carried by courier services, which use trucks for part
of their deliveries.25
The Interstate Highway System is the nation’s most critical set of highways for goods shipment.
Interstate highways carried 55 percent of all combination truck travel, measured by vehicle miles of
travel in the U.S. in 2019.26
Travel by combination trucks, which are the large trucks that carry the majority of freight
shipped in the U.S., accounted for 12 percent of all vehicle miles of travel on the Interstate Highway
System in 2019.27 The chart below shows states with the largest share of Interstate vehicle miles of
travel attributed to combination trucks in 2019.28 Data for all states can be found in the Appendix.
25Chart 9. States with Largest Share of Vehicle Miles of Travel Attributed to Combination Trucks (2019).
Source: TRIP analysis of FHWA data.
Travel by combination trucks on the Interstate Highway System increased 43 percent from 2000
to 2019, while overall vehicle travel increased 26 percent during the same time.29 From 2010 to 2019,
travel by combination trucks on the Interstate Highway System increased 14 percent, outpacing the 10
percent rate of growth for all vehicle travel during the same period. 30
The American Transportation Research Institute (ATRI) prepares an annual list of the nation’s
top 100 truck bottlenecks, based on the analysis of a massive database of truck GPS data, to quantify
the impact of traffic congestion on truck-borne freight. Forty-nine of the 50 top truck bottlenecks rated
by ATRI, based on congestion levels, are on Interstate Highways. The chart below includes the top 20
truck bottlenecks. A list of the top 50 bottlenecks is included in the Appendix.
26Chart 10. ATRI Top 20 Freight Bottlenecks (2021).
RANK STATE Top Bottlenecks
1 NJ Fort Lee, NJ I-95 at SR 4
2 OH Cincinnati, OH I-71 at I-75
3 GA Atlanta, GA I-285 at I-85 (North)
4 GA Atlanta, GA I-20 at I-285 (West)
5 TX Houston, TX I-45 at I-69/US 59
6 IL Chicago, IL I-290 at I-90/I-94
7 TN Chattanooga, TN I-75 at I-24
8 MO St. Louis, MO I-64/I-55 at I-44
9 NY Rye, NY I-95 at I-287
10 CA San Bernardino, CA I-10 at I-15
11 CA Los Angeles, CA SR 60 at SR 57
12 TX Dallas, TX I-45 at I-30
13 TN Nashville, TN I-24/I-40 at I-440 (East)
14 NY Brooklyn, NY I-278 at Belt Parkway
15 TX Austin, TX I-35
16 GA Atlanta, GA I-75 at I-285 (North)
17 TX Houston, TX I-45 at I-610 (North)
18 LA Baton Rouge, LA I-10 at I-110
19 IL Chicago, IL I-90 at I-94 (South)
20 CO Denver, CO I-70 at I-25
Source: ATRI.
The approximately 15,000 Interstate highway interchanges are a significant source of traffic
delays and are the location of almost all of the nation’s worst bottlenecks. Reconstructing and
reconfiguring these interchanges would result in improved physical conditions, reduced travel delays
and improved traffic safety.31
Traffic Safety on Interstate Highways
Perhaps the most significant benefit of the Interstate system is that it has greatly improved
traffic safety throughout the nation by providing travelers with a network of highways with a variety of
safety designs that significantly reduce the likelihood of serious accidents.
The safety features that are required on Interstates include a separation from other roads,
streets and rail lines; access limited to on and off ramps; a minimum of four-lanes to prevent the need
to enter oncoming lanes for passing; and, gentler curves. Most Interstate highways also have paved
shoulders, and many have median barriers to avoid cross-over crashes and rumble strips to warn
drivers if they are leaving the roadway. The result of the high level of safety design standards on the
Interstate is that travel on the nation’s Interstate highways is more than twice as safe as travel on all
other roads and highways.
The Interstate Highway System, which carried 26 percent of the nation’s travel in 2019,
accounted for only 13 percent of the nation’s traffic fatalities as a result of superior safety features. 32
There were 4,644 traffic fatalities on the nation’s Interstate highways in 2019 – 13 percent of the
36,096 traffic fatalities that occurred in the U.S. in 2019.33
27The traffic fatality rate per 100 million vehicle miles of travel on Interstate highways was 0.55
in 2019.34 The fatality rate per 100 million vehicle miles of travel in 2019 on non-Interstate routes was
1.30 – nearly triple the rate on the nation’s Interstates. 35
Chart 11. Fatality rate per 100 Million Vehicle Miles of Travel for Interstate and Non-Interstate roadways, 2019.
Source: TRIP analysis of FHWA data.
The chart below shows states with the highest traffic fatality rates on their Interstate highways
in 2018, and the fatality rate on all other roads in those states.36 Data for all states can be found in the
Appendix.
Chart 12. States with Highest Traffic Fatality Rate per 100 Million Vehicle Miles of Travel on its Interstate system and
Traffic Fatality Rate on non-Interstate roadways (2019).
Source: TRIP analysis of FHWA and NHTSA data.
28Lives Saved by Interstate Highway System
Because it carries significant
volumes of traffic on roadways with
higher safety standards and lower
traffic fatality rates, the Interstate
Highway System saves thousands of
lives annually. TRIP estimates that the
Interstate Highway System saved
6,555 lives in 2019.37 This estimate is
based on a comparison of the annual
fatality rate on the nation’s Interstate
highways compared to the fatality rate
each year on other major roads in the
state. Interstate safety benefits were
estimated by calculating the additional
fatalities that would have occurred
each year if the travel that occurred on Interstate highways had instead been carried by other major
roads, many of which often lack some of the safety features found on Interstate highways and have a
significantly higher traffic fatality rate.
The chart below shows states that TRIP estimates had the most lives saved in 2019 due to the
increased traffic safety provided by the Interstate Highway System.38 Data for all states can be found in
the Appendix.
Chart 13. States with the greatest number of lives saved in 2019 as a result of the increased traffic safety provided by the
Interstate Highway System.
Source: TRIP estimate based on FHWA and NHTSA data.
29Economic Benefits of the Interstate System
The construction of the Interstate Highway System has had a profound impact on the nation’s
development, affecting the quality of life of Americans in numerous ways including increased safety,
expanded lifestyle choices and an enhanced standard of living.
By greatly increasing the number of areas that are within a reasonable driving distance, the
Interstate system has significantly increased access to jobs, housing, recreation, healthcare, shopping
and other amenities.
Similarly, the construction of the Interstate Highway System has benefited the nation’s
economy by reducing the costs of and increasing the speed of goods movement. The ability to cheaply
and quickly ship products to or from domestic and international sites has resulted in lower costs and
greater selection to consumers, while opening up new markets to U.S. businesses. The completion of
the vast majority of the Interstate system by the 1980s, and the deregulation of the U.S. trucking
industry, resulted in a significant improvement in the competitiveness of U.S. business. The cost of
moving freight, as measured by U.S. business logistics costs, dropped from 16 percent of U.S. Gross
Domestic Product (GDP) in 1980 to eight percent in 2018.39
Interstate access has a significant impact on the competitiveness of a region’s economy
Increasingly, companies are looking at the quality of a region’s transportation system when deciding
where to re-locate or expand. Regions with congested or poorly maintained roads may see businesses
relocate to areas with a smoother, more efficient and more modern transportation system. Highway
access has a significant impact on the competitiveness of a region’s economy. Not surprisingly,
highway accessibility was ranked the number two site selection factor in the 2021 survey of corporate
executives by Area Development Magazine, behind only skilled labor.40
The TRB report found that U.S. counties either on an Interstate highway or within 20 miles of
an Interstate are anticipated to grow in population through 2060 at a rate approximately seven times
greater than counties that are at least 20 miles from an Interstate highway (36 percent versus five
percent).41
While additional segments have been added to the Interstate Highway System to provide
access to more communities, in 2019, 37 urban areas with populations of at least 50,000 did not have
access to the Interstate Highway System, defined as being at least 25 miles from an Interstate. 42
30Chart 14. Urbanized Areas with a Population 50,000 or Greater that are more than 25 Miles from an Interstate Highway.
Urban Area Population
Fresno, CA 654,628
Oxnard, CA 367,260
Santa Rosa, CA 308,321
Atlantic City, NJ 248,402
Visalia, CA 219,454
Myrtle Beach–Socastee, SC–NC 215,304
Santa Barbara, CA 195,861
Salinas, CA 184,809
College Station–Bryan, TX 171,345
Panama City, FL 143,280
Merced, CA 139,969
Santa Maria, CA 130,447
Greenville, NC 117,798
Seaside–Monterey, CA 114,237
Salisbury, MD–DE 98,081
Bend, OR 83,794
Madera, CA 78,413
Florence, AL 77,074
Lake Jackson–Angleton, TX 74,830
Porterville, CA 70,272
Dothan, AL 68,781
Dubuque, IA–IL 67,818
El Paso de Robles (Paso Robles)–Atascadero, CA 65,088
Victoria, TX 63,683
Kokomo, IN 62,182
Sherman, TX 61,900
Sebring–Avon Park, FL 61,625
San Luis Obispo, CA 59,219
Lexington Park–California–Chesapeake Ranch Estates, MD 58,875
Mankato, MN 57,584
Kahului, HI 55,934
Farmington, NM 53,049
Arroyo Grande–Grover Beach, CA 52,000
Lewiston, ID–WA 51,924
Lompoc, CA 51,509
Villas, NJ 51,291
New Bern, NC 50,503
Source: TRB.
The tremendous increase in freight deliveries over recent years has been partly fueled by
improved communications and the need for greater economic competitiveness. Improved
communications provided by the Internet are integrating producers, wholesalers, retailers and
consumers. Businesses have responded to improved communications and the necessity to cut costs
with a variety of innovations, including just-in-time delivery, increased small package delivery,
demand-side inventory management and e-commerce.
31The result of these changes has been a significant improvement in logistics efficiency as
businesses move away from a push-style distribution system, which relies on large-scale warehousing
of materials, to a pull-style distribution system, which relies on smaller, more strategic movement of
goods. These improvements have made mobile inventories the norm, resulting in the nation’s trucks
literally becoming rolling warehouses.
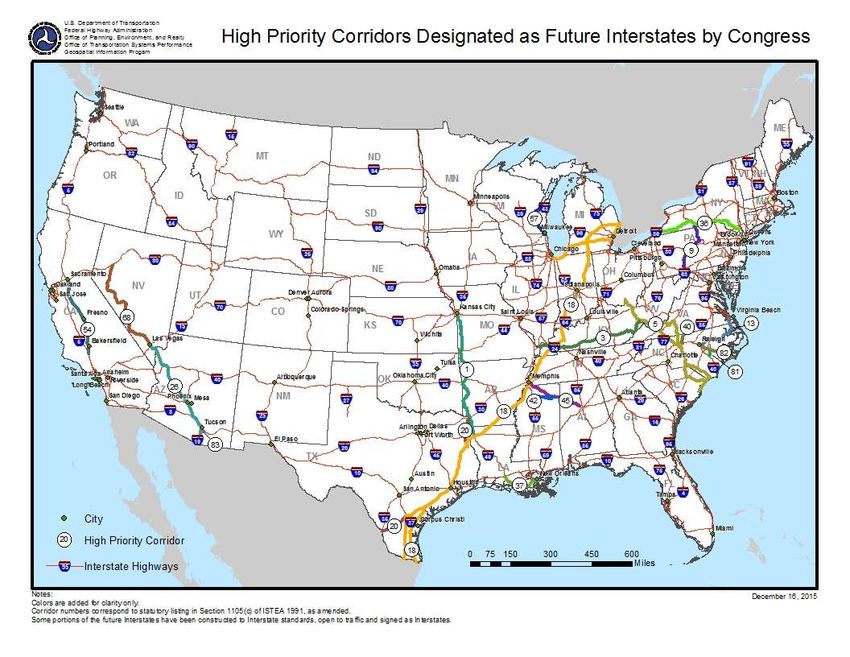
Recognizing the critical importance of access to an Interstate highway to increase a region’s
economic competitiveness and support growth and development, Congress has identified high-priority
corridors for designation as future Interstate highways. These designated future Interstate corridors,
which are in various phases of development, include I-69 from Michigan to the Texas-Mexico border, I-
11, which would connect Phoenix and Las Vegas, and I-49 from Kansas City to Houston.
Chart 15. High Priority Corridors Designated as Future Interstate Highways by Congress
32Corridors States
North-South Corridor (I-49) Missouri, Arkansas, Louisiana
United States Route 220 and the Appalachan Thruway Corridor (I-99) (I-99) Pennsylvbania and New York
Raleigh-Norfolk Corridor North Carolina and Virginia
Michigan, Illinois, Indiana, Kentucky, Tennessee, Mississippi,
I-69 Corridor
Arkansas, Louisiana and Texas
United States Route 59 Corridor (I-69) Texas
New York and Pennsylvania State Route 17 (I-86) New York and Pennsylvania
I-11 from Nogales, Arizona to Las Vegas, Nevada Arizona, Nevada
Ohio, Kentucky, West Virginia, Virginia, North Carolina and
I-73/74 Corridor
South Carolina
Edwart T. Breathitt Parkway from I-24 to I-69 (I-169) Kentucky
United States Route 90 Louisiana
The Greensboro Corridor Virginia and North Carolina
Portion of Corridor V of the Appalachian Development Highway System Mississippi
United States Route 78 Corridor and Corridor X of the Appalachian
Louisiana
Development Highway System (I-22)
California Farm-to-Market Corridor California
U.S. 41 Wisconsin
United States Route 117/Interstate Route 795 Corridor North Carolina
Sonoran Corridor Arizona
I-57 Corridor Extension Arkansas , Missouri
Wendell H. Ford Parkway (I-569) Kentucky
Source: U.S. Department of Transportation.
Funding of the Interstate System
The primary source of revenue for the Interstate Highway System is the Fixing America’s
Surface Transportation (FAST Act), the nation’s current federal surface transportation program, which
was authorized in 2015 and was set to expire on September 30, 2020. Congress extended the
legislation for one year to September 30, 2021. The FAST Act provides modest increases in federal
highway and transit spending. The bill also provides states with greater funding certainty and
streamlines the federal project approval process. But, the FAST Act does not provide adequate funding
to meet the nation’s need for highway and transit improvements and does not include a long-term and
sustainable funding source.
Revenue collected from the 18.4 cents-per-gallon federal motor fuel tax and the 24.4 cents-per-
gallon federal diesel fuel tax are the primary sources of funding for the federal Highway Trust Fund,
which distributes funds to state and local governments for highway and bridge repairs and other
surface transportation improvements, including public transit, pedestrian and bicycling facilities.
Meeting Future Interstate Travel Needs
The U.S. faces a significant challenge in maintaining and rebuilding its aging Interstate Highway
System and providing additional lane capacity to meet growing travel demand.
The most recent U.S. Department of Transportation (USDOT) analysis of the condition of the
nation’s surface transportation system found that the nation faces a significant backlog in needed
improvements to the Interstate Highway System.
33You can also read