Investments in Active Transportation - Volume 1 - Caa
←
→
Page content transcription
If your browser does not render page correctly, please read the page content below
Investments in
Active Transportation
Volume 1
THE PROBLEM OF URBAN CONGESTION IN CANADA
The recent CAA study Grinding to a Halt: Evaluating Canada’s Worst Bottlenecks took a new perspective on a
problem that Canadians know all too well: urban congestion is a growing strain on our economy and well-being.
Canada’s worst traffic bottlenecks are almost as bad as bottlenecks in Chicago, Los Angeles and New York.
Bottlenecks affect Canadians in every major urban area, increasing commute times by as much as 50%.
This CAA briefing on investments in active transportation is one in a series that explore potential solutions to
the problem of urban congestion in Canada. These briefings delve into solutions not only to highway congestion,
but also to congestion on urban streets. Taken together the solutions explored in these briefings represent a
toolkit to address this problem. The objective is to inform policy makers and the public about options to reduce
congestion and key considerations for when and where a particular solution might be the right fit.
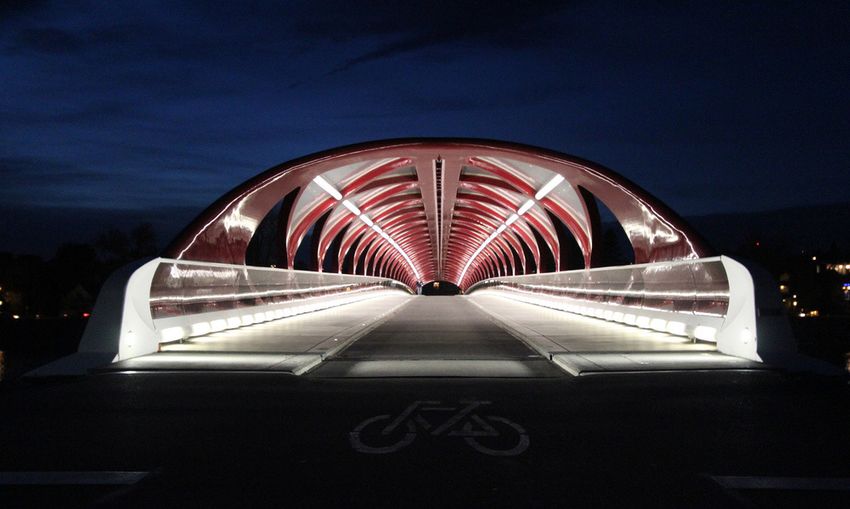
Active transportation refers to non-motorized modes of transportation,
most notably walking and biking. Under the right conditions, policies
and projects benefiting active transportation can be a useful tool in
reducing traffic congestion, particularly in the highly congested central
parts of Canadian cities. The potential to alleviate urban highway
congestion with active transportation is likely a longer term and more
limited opportunity.
This briefing explores
While the benefits of investing in active transportation can take two types of active
many forms – such as urban livability and beautification of the public transportation solution:
realm – this briefing focuses specifically on commuters (rather than bicycle infrastructure (such
recreational users) and on the transportation system. Although there as bike lanes and cycle
are some steps that could be taken to enhance walking (mentioned tracks – also known as
incidentally through the briefing), most of the focus is on cycling, which segregated bike lanes) and
bike share systems, which
with its faster speed offers greater potential for congestion reduction.
can serve as practical and
healthy solutions
This briefing explores two types of active transportation solution:
to the problem of urban
bicycle infrastructure (such as bike lanes and cycle tracks – also known congestion in Canada
as segregated bike lanes) and bike share systems, which can serve as
practical and healthy solutions to the problem of urban congestion in
Canada.
The examples provided in this briefing are illustrative of the full range
of ways in which active transportation solutions can be implemented.
European and Asian cities have made active transportation a
core part of their identity, with transformational investments in
50%
bike infrastructure (even “bike highways”), supportive policies and Bottlenecks affect
education, and even full integration of active transportation into Canadians in every major
public transit systems. In other places, the focus has been on localized urban area, increasing
smart, targeted investments. As with other modes, the private sector commute times by
as much as 50%
is not waiting around. Innovative programs like Drop Bike, funded by
venture capital, are already starting to shake up Canadian cities.
CONGESTION SOLUTIONS:
INVESTMENTS IN ACTIVE TRANSPORTATION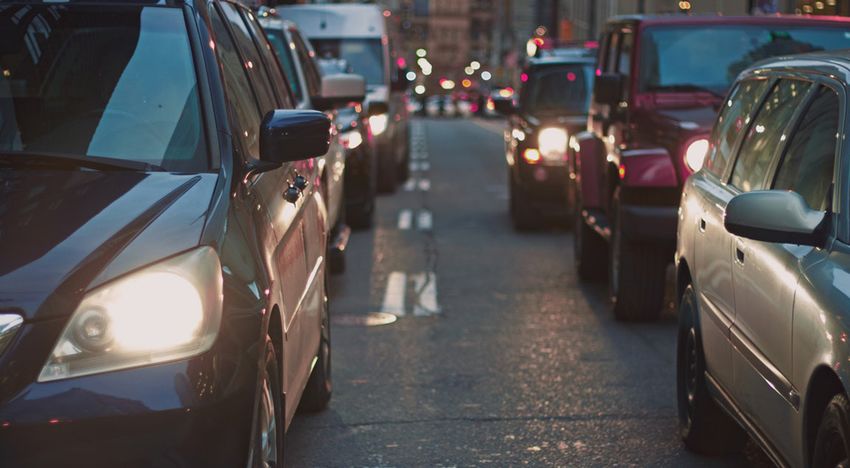
PROBLEM: CONGESTION ON URBAN STREETS
POTENTIAL SOLUTION: BIKE LANES AND CYCLE TRACKS

Bike lanes and cycle tracks have greater capacity than vehicle lanes
with single-occupancy cars. Bicycle facilities also handle crowding
more resiliently than vehicle lanes.

Examples: Cycle tracks in New York City have been found to
reduce injuries, while traffic speeds remained steady. Large German
cities have invested in a full suite of solutions, including bike lanes,
supporting facilities and cuclist and driver education. This has helped
significantly increase biking over the last decade. (+7% in Munich).

CONSIDERATIONS:
  • Most successful where biking has a speed, reliability
     and/or cost advantage over other modes (autos, transit)
  • Less successful where they reduce road capacity without
                                                                                   INNOVATIVE IDEA:
     attracting significant bike traffic                                             Higher-order “bicycle
  • Biggest benefit is improved public health and safety - potentially              highways” designed for
                                                                                  speed, reliability and safety
     in the billions of dollars for a large shift to cycling
                                                                                    have been show to be
  • Important to ensure a well-connected and planned network
                                                                                      successful in Chine,
     of bike lanes and cycle tracks if full benefits are to be achieved            Germany and Denmark.
  • Weather - and topography-dependant - should not be considered
     in isolation of other modes                                                           See page 7
  • Electric bikes can increase capacity but also reduce public health benefit

POTENTIAL SOLUTION: BIKE SHARE

Bike share systems provide flexible short-term use of bicycles within
defined geographic zones to members or paying customers. These
systems are growing rapidly: in the US alone, bike share trips have
increased by more than 12-fold in the past five years. Bike share
currently exists in five Canadian cities.

Examples: SoBi Hamilton is an example of bike share implemented in
a moderately-sized Canadian city; it is self-sufficient for operating costs.

CONSIDERATIONS:
  • Similar benefits in terms of public health as with bicycle facilities          INNOVATIVE IDEA:
  • Additional benefits include flexibility, and being able to provide last-
                                                                                 Hangzhou Public Bicycle is the
     mile connectivity to homes and businesses from transit stations
                                                                                   largest bike share system in
  • Challenge can be unbalanced demand - trips clustering in particular
                                                                                   the world, and operates in a
     locations at particular times. Can result in needing to reposition            fully integrated manner with
     bicycle, an added cost                                                         the public transit network.
  • May not reduce congestion much if trips displace transit, walking,           “Dockless” bike share systems
     or private bike trips, rather than auto trips - whether this happens         (such as Dropbike in Canada)
     depends on city and context                                                     are financed with venture
                                                                                 capital, and require no public
  • The business model is relatively new. Large Canadian bike share
                                                                                              subsidy.
     systems have had financial and perational challenges before being
     transferred to new owners. However, customer usage of thes systems                   See page 11
     does continue to increase.

CONGESTION SOLUTIONS: INVESTMENTS IN ACTIVE TRANSPORTATION                                                        2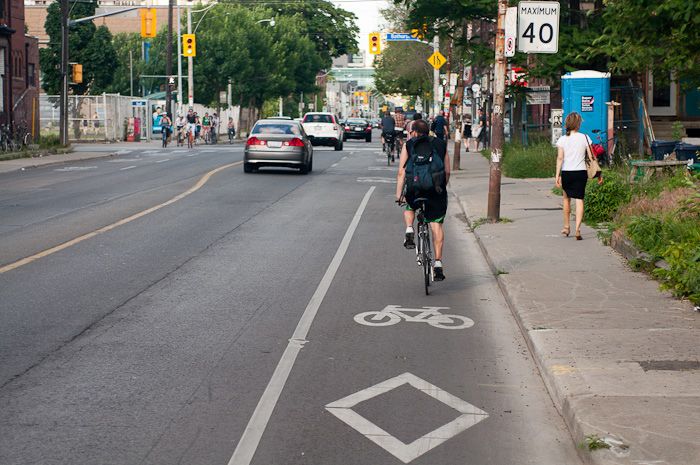
A C T IV E T R A N S P O RTAT I O N I N
CANADIAN COMMUTING PATTERNS
Across Canada to get to work 1.1 million people use active transportation – 6.9% of commuters (5.5% walked,
1.4% cycled). The share of commuters using active transportation ranges from under 4% (Abbotsford, BC
and Oshawa, ON) to 17% (Victoria, BC). Active transportation commuting shares for major metropolitan
areas of over one million people are shown in Figure 1 (range from 9% for Vancouver to 5% for Edmonton).

           Figure 1: Active Transportation Commuting Mode Shares
           in Major Canadian Metropolitan Areas

                                        8%
     Percentage of Work Trips by Mode

                                        7%

                                        6%

                                        5%

                                        4%
                                        3%
                                        2%
                                        1%
                                        0%

                                             Toronto, ON   Montreal, QC   Vancouver, BC    Calgary, AB      Ottawa, ON        Edmonton, AB

                                         Walked        Biked
                                                                                   Source: CPCS analysis of Statistics Canada 2016 Census data

Although the share of commuters cycling to work hovers around 1-2% for major cities, this figure is
significantly higher for the dense urban cores of many of these cities. For example, there are 45 census
tracts in Montréal, 29 in Toronto, and 10 in Vancouver in which more than 10% of working residents
commute by bicycle (each census tract generally has between 2,500 and 8,000 residents).

Some occupations lend themselves to walking and cycling better than others – as shown in Figure 2. The
share of commuters using active transportation ranges from a high of 13% for Art, Culture, Recreation and
Sport occupations to as low as 2% for Trades and Transport occupations.

Another important dimension is duration of commute – particularly for walking. Walking as a mode of
commuting is mostly only competitive for short distances. Nationally, 57% of people who walked to work
commuted less than 15 minutes and 89% had a commuting duration of under half an hour. Assuming a
typical walking speed of 5 km/h, walking is not a competitive option for people whose commute to work is
much longer than 2.5 km.

CONGESTION SOLUTIONS: INVESTMENTS IN ACTIVE TRANSPORTATION                                                                                       3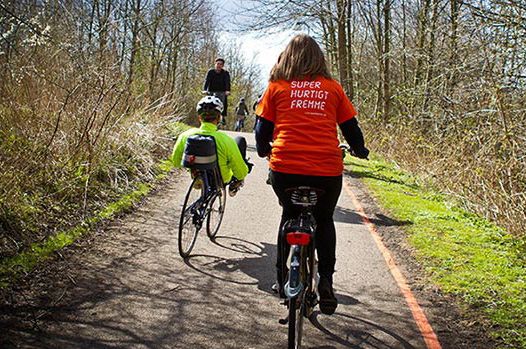
In contrast, the average commuting duration for cycling was 21 minutes, which for a typical cycling speed
of 15 km/h corresponds to 5 km. Fully 26% of commuters cycling to work had a commuting duration of 30
minutes or longer. These statistics imply that targeting cycling, more than walking, offers greater potential

    Figure 2: Active Transportation Mode Share by
    Occupation and Duration of Commute

      NATIONAL OCCUPATIONAL CLASSIFICATION         15-1        15-1         15-1        15-1        15-1        15-1

      MANAGEMENT                                    13%          6%          3%          1%           1%          6%

      BUSINESS, FINANCE, ADMINISTRATION             11%          7%          3%          1%           1%          6%

      NATURAL AND APPLIED SCIENCES                  13%          9%          4%          2%           1%          7%

      HEALTH                                        10%          6%          3%          2%           1%          6%

      EDUCATION, LAW, SOCIAL, GOVERNMENT            14%          9%          5%          3%           1%          9%

      ART, CULTURE, RECREATION, SPORT               21%         14 %         9%          4%           2%         13%

      SALES AND SERVICE                             16%         10 %         5%          3%           2%         10%

      THE STANDARD CHUNK OF LOREM IPSUM
                                                     6%          2%          1%          1%           0%          2%
      USED SINCE

      NATURAL RESOURCES, AGRICULTURE                12 %         3%          2%          1%           1%          5%

      MANUFACTURING, UTILITIES                       7%          3%          2%          1%           1%          4%

      ALL OCCUPATIONS                               13 %         7%          4%          2%           1%          7%

                                              Source: CPCS analysis of Statistics Canada 2016 Census data. All of Canada.

CONGESTION SOLUTIONS: INVESTMENTS IN ACTIVE TRANSPORTATION                                                                  4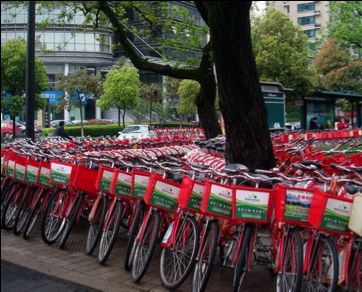
B IC Y C L E
INFRASTRUCTURE

Bicycle infrastructure comes in several basic forms:
•      Cycle tracks (segregated bike lanes) are dedicated bicycle lanes physically separated from vehicle
       traffic by curbs, bollards, or other dividers. Cycle tracks can be one- or bidirectional and offer the
       greatest protection for cyclists from motor vehicles.
•      Bike lanes are dedicated lanes demarcated by painting or striping, typically adjacent to the right curb
       lane of a roadway but not physically separated from vehicle traffic.
•      Multi-use trails are off-street paths that are commonly located adjacent to major roads or within
       parks. Typically bidirectional, these paths are often shared with pedestrians and other non-motorized
       uses, and may be equally or more targeted to recreational cyclists as to commuters.

       Figure 3: Examples of Bicycle Infrastructure in Canada

                                                                                      Photo Sources: NACTO (left), Wikimedia (right)

Figure 4 shows the existing scope of bicycle infrastructure in major Canadian Cities, as of 2015. The
largest US cities, many of which have been heavily investing in bicycle infrastructure, are also shown for
comparison.

Bicycle lanes and cycle tracks can reduce congestion by incenting drivers to switch to cycling and thereby
reducing the number of vehicles on the road. The effective capacity of dedicated bike lanes or cycle tracks
is on the order of 1,600 bicycles per hour per lane with signalized intersections and higher without.3 This
capacity is higher than what is attainable on arterial roads (in terms of vehicles per hour per lane), and
significantly higher than what is attainable in highly congested stop-and-go conditions. Thus, bicycle lanes
and cycle tracks can be more efficient at transporting people than private vehicles with a vehicle occupancy
of one or two. In addition, bicycle lanes and cycle tracks handle crowding more resiliently than vehicle lanes,
the effective capacity of which can be reduced substantially as a result of bottlenecks, turning vehicles, and
parked cars, among other impediments.

3
    Zhou (2015) – referencing sources from the US (Highway Capacity Manual), Europe and China

CONGESTION SOLUTIONS: INVESTMENTS IN ACTIVE TRANSPORTATION                                                                             5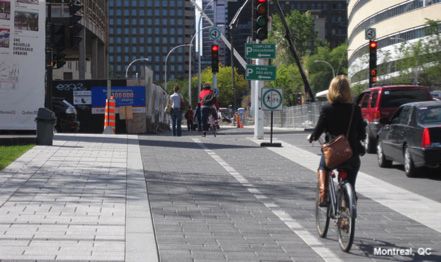
Figure 4: Bicycle Infrastructure in Major Canadian and US Cities
1,200 1,200
1,000 1,000
800 800
600 600
400 400
200 200
0 0
Y
CA
IL
X
PA
C
BC
B
N
N
N
,T
,Q
A
o,
O
,O
a,
s,
,
on
rk
r,
y,
ag
a,
le
l
hi
ea
ve
to
ar
Yo
st
aw
ic
ge
lp
n
ou
tr
lg
ou
Ch
de
An
ro
ew
tt
on
Ca
nc
H
O
To
ila
N
M
s
Va
Lo
Ph
On-Street Bike Lanes or Cycle Tracks, lane-km Multi-Use Trails, centreline km
Sources: Vijayakumar (2015) for Canadian Cities (p.3), Alliance for Biking & Walking (2014) for US cities (2011-12 data) (p. 156)
The congestion relief benefits of bike infrastructure are highest in dense, urban areas where commutes
tend to be shorter and where the high cost of parking and pervasive stop-and-go congestion on roadways
make driving and public transit less attractive to commuters. However, bicycle infrastructure can also be
a worthwhile investment in suburban areas, especially where implemented in such a way that it does not
reduce road capacity (e.g. multi-use paths adjacent to roadways, bike lanes on collector roads).
Whether bike volumes on bike lanes or cycle tracks reach capacity, there can be considerable benefits
to building this infrastructure in the domain of health and safety. Biking and walking are among the most
practical and effective ways to improve physical fitness and health. The economic burden of physical
inactivity or excess weight in Canada was estimated to be $34.1 billion in 2013.4 As a reference point, one
study of 11 Midwestern US metropolitan areas found that shifting 50% of short (under 4 km one-way) car
trips to bicycle would result in mortality declines of 1,295 deaths per year due to improved air quality and
increased physical activity. For that study area of 31.3 million people, the value of these savings would
exceed $10 billion annually.5
Separating bicycles from cars and trucks has significant safety benefits, although careful attention to
design – especially at intersections – is important. Studies of Montréal, Toronto and Vancouver have found
that bike lanes and cycle tracks reduce the risk of serious bicycle accidents by 14% to 31% compared to
mixed traffic, while mixed-use paths offer a safety improvement of 9% to 16% compared to biking on
sidewalks.6,7 In addition, there is a well-documented “safety in numbers” benefit to cycling in metropolitan
areas: as the amount of kilometres of walking or cycling per person doubles, the injury rate per kilometre
walked or cycled declines by 34%.8 One of the reasons behind this phenomenon is that as drivers’ familiarity
with pedestrians and cyclists increases, drivers become better at anticipating their movements.
The costs of constructing bike lanes is on the order of $70,000 per kilometre (higher for cycle tracks), while
the cost of constructing multiuse paths is on the order of $200,000 per kilometre.9
4
Krueger (2015) 6
Teschke (2012) 9
Bushell et al (2013)
5
Grabow (2012). $8.7 billion USD converted 7
Lusk (2011)
to CAD using 2017 exchange rates. 8
Jacobsen (2003)
CONGESTION SOLUTIONS: INVESTMENTS IN ACTIVE TRANSPORTATION 6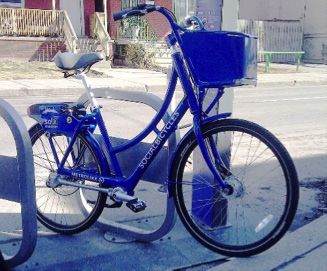
E X AM P L E S

Cycle Tracks in New York City: Lessons from a Dense North American City
New York City is an example of a large city that has been investing in bike lanes and cycle tracks. In 2014,
the New York City Department of Transportation (NYC DOT) undertook a detailed study of how their cycle
tracks had impacted safety, mobility and economic vitality. The study assessed 12 projects on six avenues
in Manhattan, on which the cycle tracks were at least three years old. NYC DOT found that pedestrian
injuries were down by 22% and cyclist injuries showed a minor decrease, even as bicycle volumes increased
dramatically. The study also found that vehicle travel speeds in the central business district were largely
unchanged and that stores on streets with cycle tracks saw an increase in retail sales.10

Cycling Investments in German Cities: Beyond Infrastructure
Cities in Germany including Munich, Berlin and Hamburg have significantly reduced the share of trips made
by automobiles over the past 20 years despite high rates of car ownership and high incomes. For example,
between 2002 and 2011, the share of trips made by automobile in Munich has decreased from 41% to
33% and the share by bicycle has increased from 10% to 17%. These gains have been achieved through
the implementation of a comprehensive package of policies supportive of active transportation, including
investments in bike lanes, bike share, bike parking, traffic calming, widened sidewalks, and promotional
events and education (including cycling training as part of traffic education). Academic studies attribute
the success of these programs to their coordinated implementation, including multimodal coordination.11
Bicycle-supportive policies in Germany have been applied not just in large cities, but also widely in small-
and medium-sized cities. For example, a “bike station” adjacent to the main train station in the city of
Münster (population 300,000) offers secure, indoor parking for 3,300 bikes in addition to bicycle sales,
repair and washing services.12

Bicycle Highways: A Paradigm Shift
Bicycle highways refer to higher-order bike infrastructure designed to provide superior speed, safety,
and directness. Bicycle highways are generally conceived of as fully separated bicycle lanes designed for
reduced conflicts with other road users, including cross-movements, whether grade-separated or at-
grade. The specific applications vary with some notable examples described below.

One of the most ambitious applications of a bike highway is in the Chinese city of Xiamen. The 7.6-kilometre
Xiamen Bicycle Skyway is an elevated bicycle route that runs parallel to (and partly underneath) an elevated
bus rapid transit line in the city’s downtown area. The 4.8-metre wide skyway opened in 2017 and features
eleven entry and exit points.13

Germany has recently opened the first 11 kilometres of a planned 100-km bike highway (also termed a
“bike autobahn”) from Hamm to Duisburg in the Rhine-Ruhr region, the country’s most populated urban

10
     NYC DOT (2014)                  12
                                          Pucher and Buehler (2008)
11
     Buehler (2016)                  13
                                          Gibson (2017)

CONGESTION SOLUTIONS: INVESTMENTS IN ACTIVE TRANSPORTATION                                                7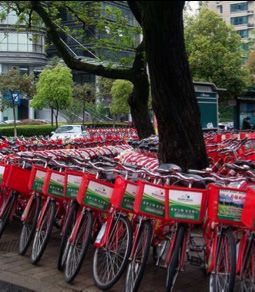
area. The dedicated thoroughfare runs along an abandoned rail line parallel to a major highway and will
connect cities, suburbs, farmland, and four major universities.14

Copenhagen, Denmark is rolling out an expansive “Supercykelstier” (Bicycle Super Highway) network,
currently comprising eight routes covering over 100 km (with five routes completed in 2017 and more
planned for 2018). This network is not generally grade-separated but features upgrades such as innovative
sensor-based lighting and “green wave” technology that times traffic lights to match average bicycling
speeds for smooth, uninterrupted peak bike flow. 15, 16

        Figure 5: Bicycle Highways

                                                                     Photo Sources: NACTO (left), Wikimedia (right)

London’s “cycle superhighway” network consists of six routes. One of the challenges is that specific
improvements are controlled by individual boroughs, which manage 95% of London’s roads.17 Thus,
the actual implementation of this system varies from wide segregated lanes along the Thames River
embankment to pavement markings in shared road lanes (not reflective of a true bicycle highway).

Technical Feasibility, Limitations and Trends
At a city-wide level, the full benefit of bicycle infrastructure may not be realized if the bike network as a
whole is discontinuous. A dense bike network supports greater usage than a more geographically sparse
network of the same total mileage. Additionally, gaps and discontinuities along individual corridors have an
outsized negative impact on use. One study of 74 US cities found that bike network density, connectivity,
fragmentation and directness all have a significant impact on a city’s bicycle commuting rate.18

Neighbourhood factors also affect the attractiveness of biking. Beyond the quantity and quality of
available bicycle infrastructure, other significant factors affecting neighbourhood “bikeability” include
street connectivity, topography, and land use.19 In other words, cycling levels are likely to be lower in
neighbourhoods with circuitous street networks, variable elevation, and low population and employment
density.

Biking is also weather-dependent. Both precipitation and temperature significantly impact cycling levels20
(some climate-dependent effects can be offset by the availability of trip-end facilities such as showers,

14
     Schwägerl (2016)                      17
                                                Laker (2014)               20
                                                                                Winters (2007)
15
     Copenhagenize Design Company (2017)   18
                                                Schoner (2014)
16
     Urban Land Institute (2016)           19
                                                Winters (2013)

CONGESTION SOLUTIONS: INVESTMENTS IN ACTIVE TRANSPORTATION                                                            8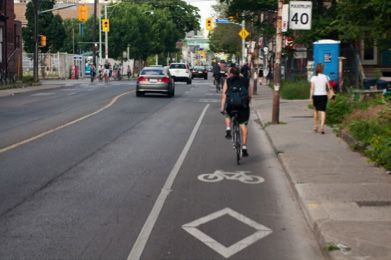
which have been shown to be a significant determinant of cycling levels).21 In addition, although cycling
corridors can move more people than roadways congested with single occupancy vehicles, they may not
be more efficient than high-capacity transit. For these reasons, active transportation does not necessarily
fully replace other modes and should not be considered in isolation of other multimodal transportation
solutions.

Electric bicycles (“e-bikes”) can increase the capacity of bike infrastructure.22 However, e-bike usage
does not provide the public health benefits of active transportation, diminishing the business case for
these investments. It is also not clear whether safety benefits are reduced as a result of e-bikes sharing
infrastructure with regular bicycles.

As with any transportation investments, it is difficult to generalize about the benefits and costs of bicycle
infrastructure, as these are highly site-specific and dependent on a variety of factors. Done wrong, bike
lanes can reduce road capacity without attracting significant bike traffic. Key factors for consideration
are highlighted in Figure 6. For any application, there are likely to be some factors supportive of cycling
and other factors less supportive. Whether the business case overall is positive depends on the total net
benefits for a specific corridor, taking into account all factors.

        Figure 6: Summary of Key Factors Affecting Business Case for Specific Bike Lanes

          FACTOR                                    CONDITIONS MORE SUPPORTIVE OF CYCLING

          ORIGIN-DESTINATION COMMUTING               •   High “latent demand” - potential to serve a lot of trips
          PATTERNS                                   •   Trip distances competitive for cycling (e.g. 7.5-1 km)

          COMPETITIVENESS OF OTHER MODES OF          •   Other modes slower, less reliable or more costly than
          TRANSPORT (DRIVING, TRANSIT)                   biking

          AVAILABILITY OF ALTERNATE ROUTES           •   Area is underserved in terms of parallel bike corridors

                                                     •   Corridor is flat and direct
                                                     •   Weather is supportive
                                                     •   Snow and ice control measures
          CONTEXTUAL FACTORS                         •   Community engagement and public buy-in
                                                     •   Awareness and education regarding rules of the road and
                                                         interaction between modes (e.g. cars and bikes)

          OPPORTUNITY COST OF BICYCLE                •   Bike lanes do not reduce road capacity
          INFRASTRUCTURE                             •   Bike lanes replace highly-congested lane of traffic

                                                                                                         Source: CPCS

21
     Buehler (2012)
22
     Zhou (2015)

CONGESTION SOLUTIONS: INVESTMENTS IN ACTIVE TRANSPORTATION                                                              9
B IKE
SHARE SYSTEMS
Bicycle sharing systems are services that provide short-term use of bicycles within defined geographic
zones to members or paying customers. These systems have gained popularity worldwide as an urban
solution to mobility challenges, including in some of the world’s largest cities (e.g. Vélib in Paris, France has
20,000 bikes and Santander Cycles in London, UK has 13,600). Existing publically supported bike share
systems in Canada are listed in Figure 7.
Figure 7: Existing Bike Share Systems in Canada
CITY SYSTEM FLEET SIZE
MONTREAL, QC BIXI Montreal 6,250
TORONTO, ON Bike Share Toronto 2,750
VANCOUVER, BC Mobi 1,200
CONTEXTUAL FACTORS SoBi Hamilton 825
OPPORTUNITY COST OF BICYCLE
VeloGo 300
INFRASTRUCTURE
Photo Sources: NACTO (left), Wikimedia (right)
Although a relatively new phenomenon, bike share systems are growing at a rapid rate. For example,
across the United States, the number of total trips taken by bike share increased from just 2.3 million
in 2011 to 28 million in 2016, a more than 12-fold increase in just five years. The 28 million trips in 2016
corresponds approximately to the annual ridership of the entire Amtrak (intercity rail) system.23
Bike share systems are run under a variety of business models. Costs are typically covered through some
combination of membership/user fees, public subsidies, and corporate sponsorship (often in exchange
for branding or advertising). One study of North American bike share systems found that sponsorship
accounts for on average 42% of operating revenue. The same study also appraised the cost of expansion
as $55,000 per new kiosk (hub), $4,000 per new dock, and $7,250 per bicycle.24
Bike share systems complement investments in bicycle infrastructure such as bike lanes and cycle tracks,
and thus the benefits described above related to congestion relief and public health apply similarly to bike
share systems.
23
NACTO (2016)
24
Mineta Transportation Institute (2014)
Converted from USD to CAD at 2017
exchange rates
CONGESTION SOLUTIONS: INVESTMENTS IN ACTIVE TRANSPORTATION 10E X AM P L E S
Social Bicycles Hamilton: A Medium-Sized Canadian City
Social Bicycles Hamilton (SoBi Hamilton), which started operations in 2015, is an example of a bike share
system in a moderately-sized Canadian city. Membership costs $4 per hour, $15 per month, or $85
annually (the latter two with 60 minutes of free usage per day). A “Power User” plan targeted to commuters
costs $125 annually with 90 free minutes per day. There are also discounts for university students and
low-income residents and the option to pay by the minute. One interesting feature is the ability to lock to
a regular bike rack for a $1 convenience fee (because the technology is in the bike rather than the dock,
the bike comes equipped with a “U-bar” lock that can be attached both to designated docks and regular
bike rings). SoBi Hamilton uses “smart bike” technology that allows them to collect route data for trips
(as distinct from many other systems which can only track origins and destinations). SoBi is self-sufficient
for operating costs and relies on public support for capital costs (having received $1.6 million through a
Metrolinx Quick Wins program to fund the purchase of bikes and station infrastructure).25
Figure 8: Sobi Hamilton Bicycle Figure 9: Hangzhou Public Bicycle –
Manned Station for Greater Efficiency
Photo Sources: Wikimedia (left), USE Today (right)
Hangzhou Public Bicycle: A Prime Example of Multimodal Coordination
Hangzhou Public Bicycle in Hangzhou, China, is considered to be the largest bike share system in the
world. Launched in 2008, the system has grown to over 84,000 bicycles as of May 2016. In Hangzhou, the
bike share system is operated by the Hangzhou Public Transport Corporation and is fully integrated with
public transit – bike use is free for the first 90 minutes after payment for a bus ride. By providing last-mile
connectivity on both ends of transit commutes, the bike share system helps to reduce gridlock on the
city’s roads. According to local polls, 78% of car owner respondents used the bike share system for trips
previously taken by autos. Another feature of this system is that it operates manned service stations in
dense urban locations where high demand for docks would be an issue.26
25
Sobi Hamilton website: hamilton.socialbicycles.com
26
Energy Smart Communities Initiative (2016)
CONGESTION SOLUTIONS: INVESTMENTS IN ACTIVE TRANSPORTATION 11TECH N I C A L F E A S I B I L I T Y, L IMITATI O N A ND TREND S
Compared to privately owned bicycles, bike share systems have several notable benefits as well as
drawbacks, as listed in Figure 10.
Figure 10: Benefits and Drawbacks of Bike Share Compared to Private Bicycles
CITY SYSTEM FLEET SIZE
• Ability to eliminate the costs of • Can be more expensive than
purchasing and maintaining a purchasing a bicycle, over several
bicycle and the space needs for years
storing a bicycle • Can be expensive for trips longer than
COST • Marginal cost of usage is low or the free window
zero (e.g. free under 30 minutes) • Can require a public subsidy to
• Reduces the risk of bicycle theft operate
or vandalism
• More flexible – can be used for • May be less comfortable than private
one-way trips, e.g. where a return bikes (“one size fits all” bikes)
trip is not planned or where the • Docking stations may not be
weather is anticipated to change conveniently located for all trips
• Can be used on the “spur of the • Limited to a concentrated geographic
CONVENIENCE moment” area
• Easy access with smartphone • Docking stations have limited
apps capacity and can fill up or be
• Can be combined with public empty, exacerbated by geographic
transit to provide “last-mile” imbalances in trip patterns
connectivity from transit stations
Bike share systems are relatively new and business models are evolving rapidly. One of the issues with bike
share is that it typically requires a public subsidy. Bike share systems also have to hit a “critical density” to
achieve a high level of utilization. Finding the right business model has not always been a smooth process.
Toronto’s bike share system, launched as Bixi in 2011, struggled financially and was transferred to the city-
owned Toronto Parking Authority in 2013. However, as the system has densified it is now hitting new highs
in ridership.27 Similarly, the company owning Bixi Montréal filed for bankruptcy in 2013, selling its assets
to the City of Montréal. Despite a small increase in the number of bikes, Bixi Montréal’s ridership has risen
from 1.1 million to 4.1 million between 2009 and 2016, while membership has increased from around
11,000 to nearly 40,000 in that same span.28 This shows that while the operations of large Canadian bike
share systems have not been immediate successes, these systems have been far from a failure in terms
of customer usage.
One very recent innovative phenomenon is the development of “dockless” bike share systems that operate
privately, typically funded by venture capital rather than government initiatives. One example is Dropbike,
which has launched in 2017 in Toronto, Kingston, ON and Westmount, QC. These systems place the “smart”
technology in the bike itself – the bike is unlocked with a smartphone Quick Response (QR) code and can
be left free-standing within designated zones – eliminating the problem of docks filling up. Similar systems
have launched in 2017 in cities like Seattle, Washington DC, the Bay Area, and London (UK), and have
existed for many years in cities in China.
27
Rider (2017)
28
Symon (2017). Also, Riga (2016)
CONGESTION SOLUTIONS: INVESTMENTS IN ACTIVE TRANSPORTATION 12One of the traditional issues with bike share systems is that demand is often unbalanced, with, for example, many people travelling to the central business district or popular recreational destinations at the same time. As a consequence, docks in these locations fill up quickly, and docks near residential areas go empty. Similar issues apply to trips to and from major transportation hubs, as well as areas with large elevation differences (users may bike downhill and take other modes of transportation back). This can result in the bike share agency having to manually reposition bikes by truck throughout the day, an added expense (averaging about $8,000 per month in a study of US cities).29 The extent to which bike share rides displace auto trips as opposed to transit, walking or private bicycle trips depends on the city. One user survey-based study of five North American cities (including Toronto and Montréal), found that bike share reduced driving in all five cities, and mostly reduced rail and bus commuting (with some exceptions). In Toronto and Montréal the effect was muted, as a large proportion of bike share users were not owners of vehicles and therefore not switching from driving. However, in Salt Lake City and Minneapolis a majority of users reported driving less frequently.30 Bike share systems are not always year-round solutions: in Montréal the bike share system shuts down for the winter season. One of the greatest potentials for bike share, in terms of reducing traffic congestion, is by providing “last- mile” connectivity to and from public transit stations (including commuter rail), thereby encouraging drivers of very long trips to shift away from driving. A challenge is the imbalance in demand issue described above. Another important challenge is having docks not only at the station but in convenient locations close enough to commuters’ destinations.
CONCLUSION
Not all commuters can switch to cycling, particularly those who must travel long distances, who are
physically less mobile, or whose job requires use of a vehicle. Nonetheless, active transportation can
be an important part of a congestion solutions toolkit. Active transportation solutions can range from
infrastructure investments to educational policies, to more transformative investments such as bicycle
superhighways and public transit integration.

Bicycle infrastructure typically requires public investment, although the magnitude of funds involved
remains quite small compared to public expenditures on other modes. For example, recently the City of
Toronto doubled its annual budget for cycling infrastructure to $16 million,31 and the Province of Ontario
announced an additional $25.6 million. For reference, the Toronto Transit Commission’s annual operating
budget is $2.0 billion ($688 million net of revenues),33 and its planned capital budget is $9.4 billion over
10 years.34 Cycling investments can be a relatively low-cost solution that, properly targeted, can reduce
congestion and increase health and safety for the residents of Canadian cities.

28
     Mineta Transportation Institute (2014).             32
                                                              Spurr, Ben (2017). Toronto Star. “Province to give Toronto
     Converted from USD to CAD at 2017 exchange rates.        $25.6 million for bicycle infrastructure.”
29
     Mineta Transportation Institute (2014)              33
                                                              City of Toronto (2017)
30
     Mineta Transportation Institute (2014)              34
                                                              Toronto Transit Commission (2016)
31
     Toronto Centre for Active Transportation (2016)

CONGESTION SOLUTIONS: INVESTMENTS IN ACTIVE TRANSPORTATION                                                                 14
S O U R CE S
Alliance for Biking & Walking (2014), “Bicycling and Walking in the Pucher, J. and R. Buehler (2008), “Making cycling irresistible:
United States: 2014 Benchmarking Report.” Lessons from the Netherlands, Denmark, and Germany.” Transport
Reviews 28(4), pp. 495-528.
Buehler, R. (2012), “Determinants of bicycle commuting in the
Washington, DC region: The role of bicycle parking, cyclist showers, Rider, D. (2017), “Bike Share Toronto hits ridership record, offers
and free car parking at work.” Transportation Research Part D: free Wednesday rides in July.” Toronto Star.
Transport and Environment 17(7), pp. 525-531.
Riga, A. (2016), “Bixi has come a long way since 2009.” Montreal
Buehler, R. et al (2016), “Reducing car dependence in the heart Gazette.
of Europe: lessons from Germany, Austria, and Switzerland.”
Transport Reviews, 27(1), pp. 4-28. Schoner, J. and D. Levinson (2014), “The Missing Link:
Bicycle Infrastructure Networks and Ridership in 74 US Cities.”
Bushell, M. et al (2013), “Costs for Pedestrian and Bicyclist Transportation 41(6) pp. 1187-1204.
Infrastructure Improvements: A Resource for researchers, Engineers,
Planners, and the General Public.” Prepared by the UNC Highway Statistics Canada (2017), Canada 2016 Census, Commuting to
Safety Research Center, for the Federal Highway Administration. Work
City of Toronto (2017), “City Budget: 2017 Toronto Transit Schwägerl, C. (2016), “Moving Beyond the Autobahn: Germany’s
Commission” New Bike Highways.” Yale Environment 360.
Copenhagenize Design Company (2017), “Bicycle Superhighways Spurr, Ben (2017). “Province to give Toronto $25.6 million for
in Copenhagen Capital Region.” bicycle infrastructure.” Toronto Star.
Energy Smart Communities Initiative, Smart Transportation Symon, J. (2017), “Bixi to open April 15 for 2017.” Montreal Times.
– Energy Efficient Urban Transport Network: ST-1.5 Bikes and
Teschke, K. et al (2012), “Route Infrastructure and the Risk of
Walkways: Hangzhou Public Bicycle.
Injuries to Bicyclists: A Case-Crossover Study.” American Journal of
Gibson, E. (2017), “Dissing + Weitling completes ‘world’s longest’ Public Health, 102(12), pp. 2336-2343.
elevated cycling path in China.” Dezeen Magazine.
Toronto Centre for Active Transportation (2016), “Toronto City
Grabow, M. et al (2012), “Air quality and Exercise-Related Health Council approves doubling budget to 16M for new bike plan”
Benefits from Reduced Car travel in the Midwestern United States.”
Toronto Transit Commission (2016), “Staff Report: Proposed
Environmental Health Perspectives, 120(1), pp. 68-76.
2017-2026 TTC Capital Budget”
Jacobsen, P. (2003), “Safety in numbers: more walkers and
Urban Land Institute (2016), “Cycle Superhighways
bicyclists, safer walking and bicycling,” Injury Prevention 2003; 9,
(Supercykelstier).” Active Transportation and Real Estate: The
pp. 205-209.
Next Frontier.
Krueger, H. et al (2015), “Variation across Canada in the economic
Vijayakumar, N. and C. Burda (2015), “Cycle Cities: Supporting
burden attributable to excess weight, tobacco smoking and physical
cycling in Canadian cities.” Pembina Institute.
inactivity.” Canadian Journal of Public Health, 106(4), pp. 171-177
Winters, M. et al (2007), “Utilitarian bicycling: a multilevel
Laker, L. (2014), “Superhighways, Crossrail and Quietways: A
analysis of climate and personal influences.” American Journal of
complete guide to London cycleways.” Cycling Weekly.
Preventive Medicine, 32(1), pp. 52-60.
Lusk, A. et al (2011), “Risk of injury for bicycling on cycle tracks
Winters, M. et al (2013), “Mapping Bikeability: A Spatial Tool to
versus in the street.” Injury Prevention 17, pp. 131-135.
Support Sustainable Travel.” Environ Planning B: Planning and
Mineta Transportation Institute (2014), “Public Bikesharing in Design, 40(5), pp. 865-83.
North America During a Period of Rapid Expansion: Understanding
Zhou, D. et al (2015), “Estimating Capacity on Bicycle Path on
Business Models, Industry Trends and User Impacts.”
Urban Roads in Hangzhou, China.” 94th Annual Meeting of the
New York City Department of Transportation (2014), “Protected Transportation Research Board.
Bicycle Lanes in NYC,” Presentation by the CommissionerYou can also read


