CYCLING AT A CROSSROADS - The Design Future of New York City Intersections September 2018 - NYC.gov
←
→
Page content transcription
If your browser does not render page correctly, please read the page content below
CYCLING AT A CROSSROADS
The Design Future of New York City Intersections

                 September 2018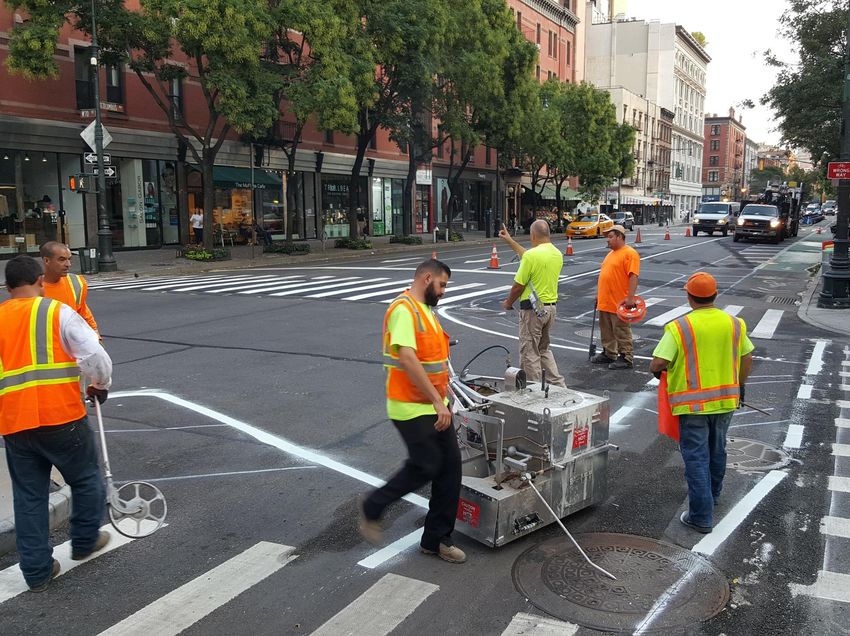
CONTENTS
    2    ….   Letter from the Commissioner
    3    ….   Executive Summary
    6    ….   Background & Purpose
    8    ….   Protected Bike Lane Intersection Designs
    13   ….   Study Design
    18   ….   Key Findings
                  Safety
                  Conflicts
                  Comfort
    23   …. Key Findings by Treatment
                  Mixing Zone
                  Fully Split Phase
                  Delayed Turn
                  Offset Crossing
    36   …. Recommendations
                  Intersection Design Matrix
                  Actions
                  Next Steps

nyc.gov/dot                                              1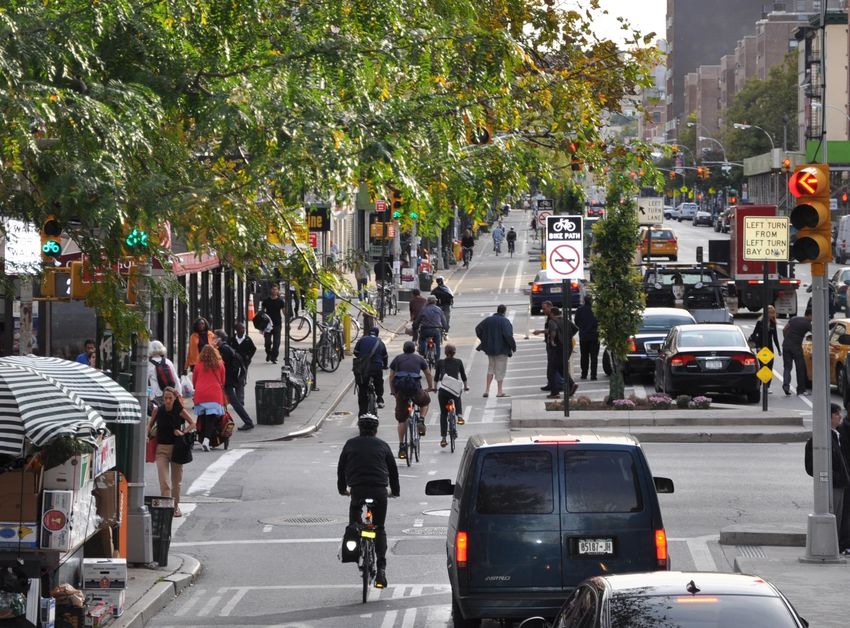
LETTER FROM THE COMMISSIONER
              Dear Fellow New Yorker:

              It is hard to believe that only a decade ago, New York      With the goal of reversing that trend, DOT has taken a
              City installed its first protected bike lanes along 9th     closer look at cyclist safety. And specifically, because
              Avenue on the West Side of Manhattan, separating            89 percent of crashes occur within intersections, our
              bikes from other vehicle traffic along a major street for   Transportation Planning and Management team was
              the first time. In the years since, lanes like the 9th      charged with doing a clear-eyed analysis of how we
              Avenue bike lane have become a deeply ingrained             could further improve intersections to keep cyclists
              part of the City’s streetscape. In fact, lane miles         safe, especially as vehicles turn.
              dedicated to cyclists have expanded far beyond those
              two lane-miles in Chelsea to now more than 100 miles        The study that follows, Cycling at a Crossroads: The
              Citywide, including the addition of a record 25             Design Future of New York City Intersections, is a
              protected lane-miles in 2017.                               detailed and data-driven look at various designs, and
                                                                          keeps with the spirit with which DOT has generally
              Since 2014, under the leadership of Mayor Bill de           approached Vision Zero. That is, we live in a diverse
              Blasio and his signature Vision Zero program, DOT           City with tens of thousands of intersections, and DOT
              has fast-tracked the construction of protected bike         plans to continue our aggressive pace of protected
              lanes. Simply put, these lanes have been central to         bike lane construction. Having transparent design
              the promising results we have had in reducing               guidelines is a must, because where safety and
              fatalities, which have declined in New York City for        intersection design are concerned, one size most
              four-and-a-half years, bucking national trends. Our         definitely will not fit all.
              data clearly show that the addition of a new protected
              bike lane – that makes crosswalks shorter and               I want to thank the DOT planners who painstakingly
              narrows driving space -- increases street safety for all    constructed this study, another product of their
              users: pedestrian, motorist, and cyclist alike.             passion for the safety of all New Yorkers. The
                                                                          recommendations they make here will inform future
              However, as overall traffic fatalities have declined and    planning and design decisions, in the hope that we
              cycling has increased within New York City under            can continue the incredible progress New York City
              Vision Zero, the number of cyclists lost in fatal           has made -- both around meeting our critical Vision
              crashes has remained stubbornly and tragically high,        Zero goals and becoming a safer and more
              with deaths actually increasing over the last several       welcoming city for cyclists.
              years.
                                                                          Polly Trottenberg
                                                                          Commissioner

nyc.gov/dot                                                                                                                          2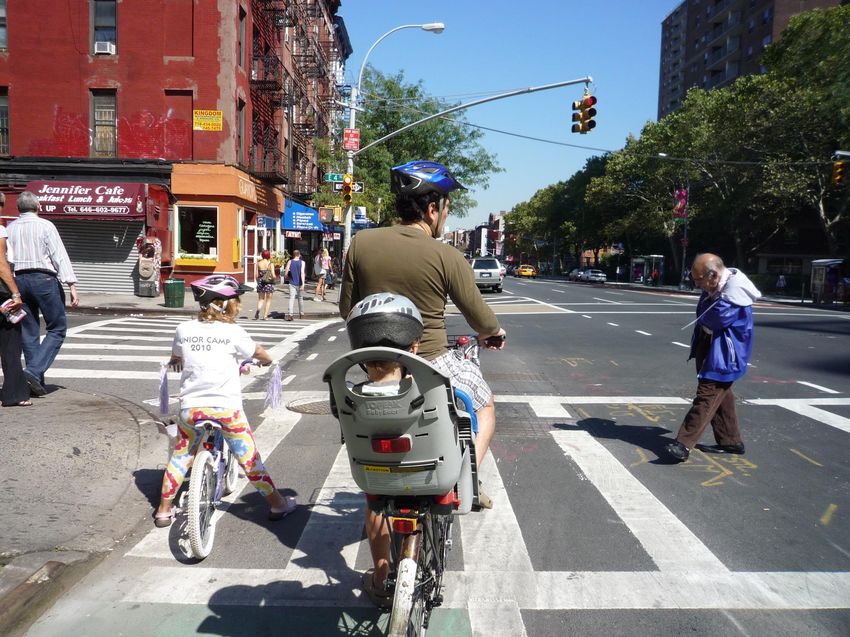
EXECUTIVE SUMMARY
    STUDY OVERVIEW
    With turning vehicle conflicts combined with the high
    demand for street space, intersections remain one of
    the primary design challenges for creating a safe and
    comfortable bicycle network in New York City. This
    study aims to evaluate both new and traditional intersection
    design treatments and provide recommendations on their
    design and use.

    Overall, this study's findings show that both Mixing
    Zones and Fully Split Phase intersections have
    substantial bicycle crash rate reductions following
    their installation as part of Protected Bike Lane (PBL)
    projects. The study also found that pilot treatments
    currently being investigated by NYC DOT show promising
    results, with high levels of user comfort and low incidence
    of conflict between bicycle riders and turning drivers.
    These treatments will continue to be used in NYC bicycle
    projects while they are refined.

    The results of the study include specific design
    recommendations to modify existing designs, as well
    as a helpful new matrix to guide in the selection of a
    new project's intersection treatments. This matrix
    guides NYC DOT designers in selecting appropriate and
    consistent treatments for different street contexts and also
    provide a transparent framework to the public.

nyc.gov/dot                                                        3
EXECUTIVE SUMMARY
 This study examines four designs used to manage turning conflicts at intersections with Protected Bike Lanes (PBLs). To achieve a greater
 understanding of the safety effects, design constraints, behaviors, and bicyclist perceptions for each of these designs, a crash data analysis,
 video observations, and surveys are employed. Overall, the findings show that the standard treatments (Mixing Zones and Fully Split
 Phase) reduced the bicycle crash rate at intersections by 30% following their installation as part of a PBL project. Other key findings include:

               DESIGN                                                                KEY FINDINGS
                                                 Established Designs for Use with Protected Bicycle Lanes in New York City
                The Mixing Zone is a design where turning vehicles                   Mixing zones are a safe (27% bicycle crash rate reduction),
                and bicyclists share the same space. This design is                  efficient way for way to allow vehicles to turn across a protected bike
                intended to reduce the speed of turning vehicles and                 lane (PBL), particularly at smaller intersections where they exhibit a
                allow bicyclists to avoid being in the turning path of a             similar bicyclist crash rate to the Fully Split Phase design; however,
                motor vehicle.                                                       self-reported bicyclist comfort is lower at this type of intersection
                                                                                     compared to the Offset Crossing pilot alternative.

                 The Fully Split Phase signal separates the through-                 This type of intersection is often requested in place of a mixing zone
                 movement of bicyclists and the turning movement of                  because bicyclists are fully separated in time and space from turning
                 vehicles by giving them each separate green signal                  drivers; however, long delays experienced by bicyclists waiting for a
                 phases.                                                             green light can encourage risky behavior (red-light running). The
                                                                                     Fully Split Phase treatment should typically be prioritized at
                                                                                     wider intersections and two-way cross-streets.

                                                                              NEW: Pilot Designs
                 The Delayed Turn (AKA Split LBI) is a design that                   This intersection type is similar to the Mixing Zone in terms of
                 builds on the benefits of the Leading Pedestrian                    bicyclist behaviors and levels of user comfort. Overall the conflict
                 Interval (LPI). This design provides a conflict-free head           rate between turning vehicles and bicycles is the lowest of the
                 start for bicyclists before turning drivers are allowed to          four treatments, but an observed conflict at the start of the
                 proceed.                                                            Flashing Yellow Arrow phase needs further evaluation.

                 The Offset Crossing is a design based on Dutch                      This design is found to have the highest levels of user comfort with
                 bikeway design principles and is frequently called a                93% of bicyclists surveyed feeling safe riding through them (compared
                 Protected Intersection. This design sets the bicycle                to 65% at Mixing Zones). However, bicyclists yield more frequently to
                 facility back from the travel lane to improve visibility            turning drivers in this design possibly due to the decreased amount of
                 and slow drivers.                                                   recognition and reaction time between turning drivers and bicyclists. A
                                                                                     modified design to slow turning speeds is recommended.

nyc.gov/dot                                                                                                                                                    4
EXECUTIVE SUMMARY
    SUMMARY OF RECOMMENDATIONS

    Update designs based on the findings in the study,
    including:
    • Updating first generation mixing zones with a shorter
       mixing area, as markings are refreshed;
    • Use Left-Turn Traffic Calming methods to slow turns at
       larger intersections;
    • Develop strategies to improve signal coordination that
       reduces bicyclist stopping and delay along corridors with
       several Fully Split Phase intersections; and
    • Install higher visibility markings through conflict zones,
       such as wider peg-a-track lines or green bars.

    Continue to install and evaluate the pilot treatments,
    including the offset crossing at appropriate locations.

    Continue to upgrade 20 key cycling intersections as
    outlined in the Vision Zero Year Three Report. Upgrades of
    these 20 intersections as well as all new bicycle projects will
    be informed by the design matrix developed in this study.

    Update educational resources for people bicycling and
    driving and develop on-street and digital outreach
    events.

nyc.gov/dot                                                           5
BACKGROUND & PURPOSE
    Since 2007, NYC DOT has used Protected Bike
    Lanes (PBLs) on key corridors of NYC’s on-street
    bike network. By comfortably separating bicyclists
    from moving traffic using parked cars or other
    barriers, PBLs provide a proven (1,2) safe bike
    facility that even those who are less confident riding
    on city streets can enjoy.

    However, these benefits do not affect all parts of the
    street equally. Since the protection of the bike lane
    drops at the intersections, where conflicts with other
    road users are most likely to occur, these locations
    can be considered the “weakest link” in terms of
    bicyclist comfort and safety along PBL corridors.
    This is demonstrated by study findings in NYC
    where 89% of cyclist fatal or serious injury crashes
    occur at intersections (of all types, not just locations
    with bicycle facilities) and the percentage of the total
    cyclist crashes along a corridor that occur at
    intersections increases from 86% to 97% after the
    installation of a PBL (3,2).

    While the past corridor evaluations are instructive,
    further examination of how different features such
    as bike facility design, turn volumes, traffic signals
    and crossing distances affect the safety of bicyclists
    at intersections is needed.

                  1) New York City Department of Transportation. (2014). “Protected Bicycle Lanes in NYC.”
nyc.gov/dot       2) Rothenberg, H. D. Goodman, C. Sundstrom. Separated Bike Lane Crash Analysis. Presented at 95th Annual Meeting of the Transportation Research Board, Washington, D.C., 2016.   6
                  3) Getman, A., L. Gordon-Koven, S. Hostetter, and R. Viola. Safer Cycling: Bicycle Ridership and Safety in New York City, 2017. New York City Department of Transportation.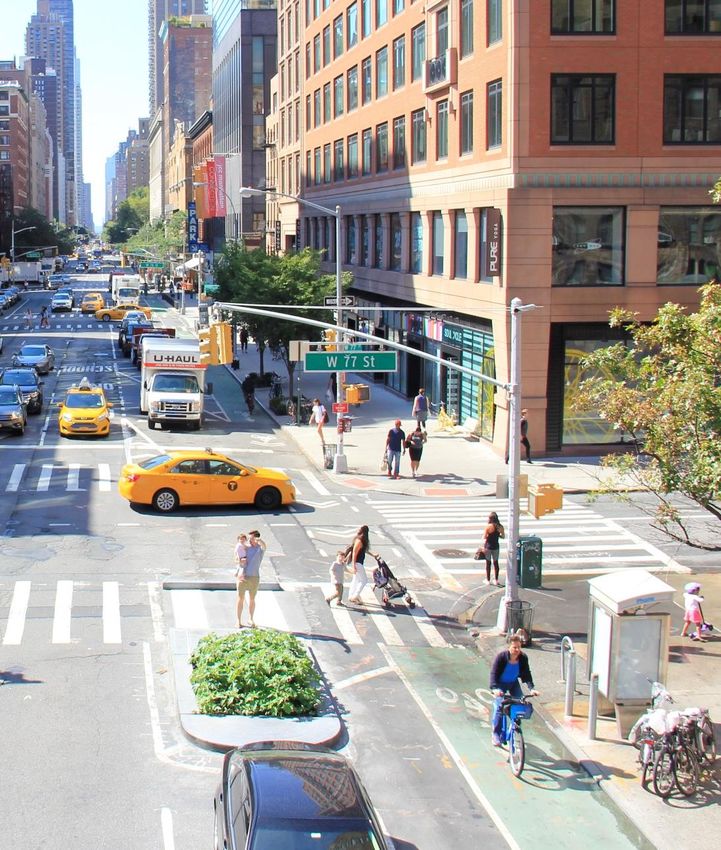
BACKGROUND & PURPOSE
    Providing safe cycling facilities is clearly critical for meeting the City’s
    Vision Zero goal. However facilities need to not only be objectively safe
    but also subjectively safe and comfortable to attract the numbers new
    riders necessary to meet the City’s goal of doubling cycling trips citywide
    and providing a new mobility option to many New Yorkers.

    The largest group of New Yorkers (52%) in a 2015 survey (3) defined
    themselves to be “Interested but Concerned” in cycling, a category defined
    as people who are willing to bicycle if high-quality bicycle infrastructure is
    provided. This large group represents a majority of New Yorkers and
    offers a huge opportunity to increase cycling by providing convenient and
    low stress facilities. PBLs and other cycling investments have clearly been
    successful at reaching this group as demonstrated by a 156% increase in
    daily cycling trips between 2006 and 2016 (4). Additionally, based on the
    drop in NYC bicycle crashes per cycling trip, there is likely also a “safety in
    numbers” benefit to encouraging more people to bicycle (5).

    Due to the inherent conflict between street users, intersections
    remain one of the primary design challenges for creating bicycle
    facilities that are both safe and comfortable for all types of bicyclists
    while supporting the competing needs for street space and mobility
    in busy, urban environments. This study aims to evaluate both new and
    traditional intersection design treatments and provide recommendations
    on their design and use.

     The intent of this study is two-fold:
     1. Develop sound findings and insights on the intersection design treatments used at intersections with Protected Bike Lanes; and
     2. Create a planning and design resource that identifies the conditions where each treatment is most appropriate.

                  3) Dill J. and N. McNeil. Revisiting the Four Types of Cyclists: Findings from a National Survey. Transportation Research Record. No. 2587, pp. 90-99, 2016.
nyc.gov/dot       4) New York City Department of Transportation. (2018). “Cycling in the City: Cycling Trends in NYC.”                                                                          7
                  5) Getman, A., L. Gordon-Koven, S. Hostetter, and R. Viola. Safer Cycling: Bicycle Ridership and Safety in New York City, 2017. New York City Department of Transportation.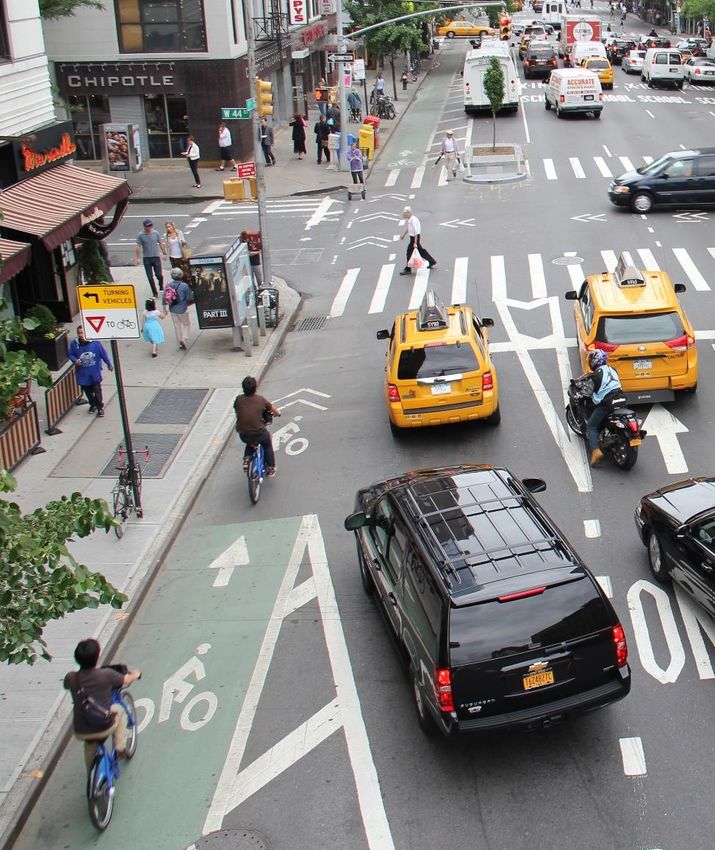
PROTECTED BIKE LANE
              INTERSECTION DESIGNS

nyc.gov/dot                          8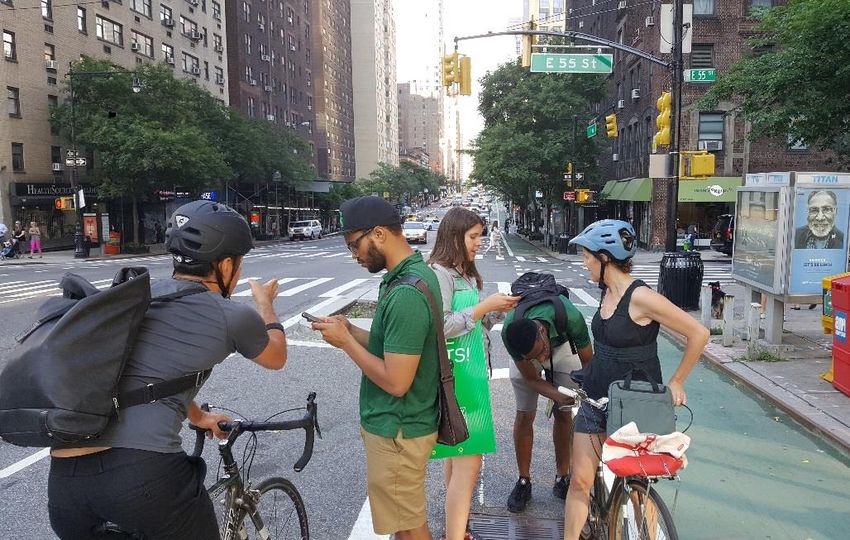
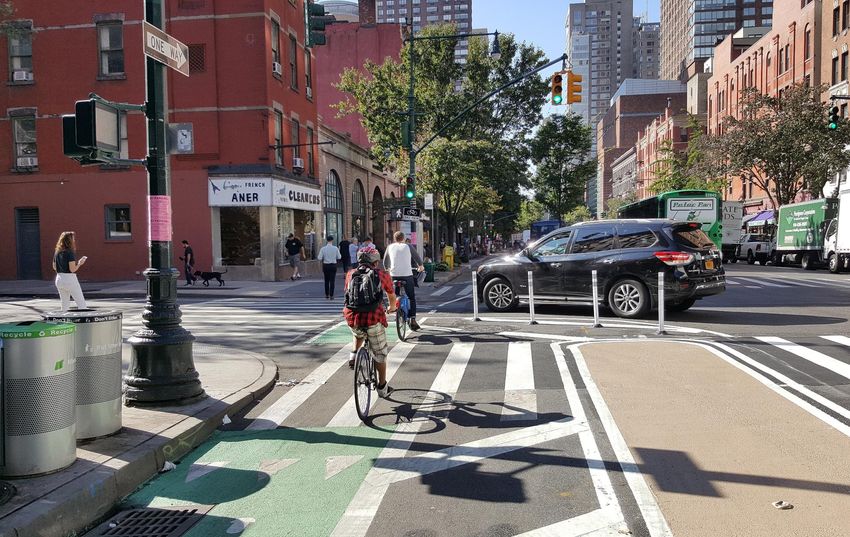
PROTECTED BIKE LANE INTERSECTION DESIGNS
    Historically, two primary design treatments have been used in NYC to mitigate
                                                                                                                                  Change in Mixing Zone from a
    the conflict at intersections between bicyclists and turning drivers at PBLs:                                                 typical 50 ft length of shared
                                                                                                                                  space between the yield
    •     The Mixing Zone is a design where turning vehicles and bicyclists share                                                 markings and the crosswalk in
          the same space. This design is intended to reduce the speed of turning                                                  the first generation design to a
          vehicles and allow bicyclists to avoid being on the turning side of a                                                   typical 35 ft in the current
          vehicle which could result in a “hook” type crash.                                                                      generation (shown).
    •     The Fully Split Phase Signal separates the through-movement of
          bicyclists and the turning movement of vehicles by giving them each
          separate green signal phases.

    With all design decisions, trade-offs must be made. For example, Fully Split
    Phase intersections provide a complete separation between bicyclists and
    turning vehicles but also create time delays for bicyclists riding through the
    corridor. The Mixing Zone design reduces bicyclist delay and preserves more
    on-street parking and loading, but allows for more conflict due to the green                        Example of a Mixing Zone intersection
    phase being shared between bicyclists and turning vehicles.

    Both designs have a long, proven history. Fully Split Phased intersections were
    first installed on 8th and 9th Avenues in 2007 and Mixing Zones on Grand Street
    in 2008. Over time, NYC DOT has modified the Mixing Zone design to reduce
    the length of the shared zone, which resulted in improved safety.

    NYC DOT is also developing two additional designs that are still in a pilot
    phase:

    •     A design that builds on the benefits of the Leading Pedestrian Interval
          (LPI), named a Delayed Turn in this study; and
    •     A design based on Dutch design principles, frequently called a Protected
          Intersection, and named an Offset Crossing in this study.

    This study evaluates the preliminary results of these pilot designs and identifies
    design modifications and other recommendations for their use.
                                                                                         Bicycle signals are installed at Fully Split Phase Signal intersections

nyc.gov/dot                                                                                                                                                    9
DEVELOPMENT OF THE OFFSET CROSSING DESIGN
As part of this study the “Offset Crossing” intersection treatment
was developed and installed in two pilot locations. Also known as
a “protected intersection” design, it is based on Dutch bikeway
design principles and rapidly gaining popularity in North American
cities.
This graphic presents many of the key design elements of this
design including the corner refuge island to slow turns and
yielding space for drivers to recognize and stop for bicyclists.
Protected intersections are designed to create clear and
predictable travel behaviors, reduce crossing distances, and
increase comfort.
Compared to other intersection designs, these design elements
likely provide a less stressful crossing for bicyclists by limiting
their interaction with turning vehicles to a single point. Other
benefits with this design include an additional pedestrian island
and a lower reduction of parking and loading space. These
benefits make the design particularly appealing. Elements of protected intersections (Source: MassDOT Separated Bike Lane
Planning & Design Guide 2015)
While these benefits are appealing, particularly at Protected Bike
Lanes (PBLs) where less confident or experienced bicyclists are A protected intersection in Chicago (Source: CDOT)
expected, the design needs to be proven both safe and feasible
in terms of design and operations. While there is limited
experience with this type of design in North America, the safety
research from urban environments in Europe provides a strong
safety performance record. This study aims to clarify how the
design performs on NYC streets, recommend a refined geometry,
and identify suitable conditions for use.
nyc.gov/dot 10DEVELOPMENT OF THE OFFSET CROSSING DESIGN
To develop a type of protected
intersection design that can be retrofitted Pilot Offset Crossing treatment at Columbus Avenue & W 70th Street
to typical NYC streets, NYC DOT
designers conducted a review of US and
international safety literature and
referenced recent design guides* from
FHWA, state and local agencies,
NACTO, and the Netherlands.
The result is a design that features a 15
ft. offset to the bike lane, painted corner
islands with vertical delineators to slow
turns, and an advanced stop bar to
improve bicyclist visibility when stopped
at a red light.
The pilot locations of Columbus Avenue
& W 70th Street and Amsterdam Avenue
& W 85th Street were selected as
suitable test sites due the existing Mixing
Zone geometry that is typical of
Manhattan avenues and turning vehicles
volumes below 120 in the peak hour.
NYC DOT has also begun experimenting
with this design at other locations
including both on and crossing two-way
streets. The results of these installations
will be studied as part of the addendum
study.
*A partial list of the design guides featuring protected intersections and similar features include: FHWA (2015) Separated Bike Lane Planning and Design Guide; FHWA (2016) Achieving
nyc.gov/dot Multimodal Networks: Applying Design Flexibility and Reducing Conflicts; NACTO (2017) Global Street Design Guide; Seattle DOT (2017) Right-of-Way Improvements Manual; MassDOT
(2015) Separated Bike Lane Planning & Design Guide; CalTrans (2018) Design Information Bulletin 89-01 Class IV Bikeway Guidance; CROW (2016) Design Manual for Bicycle Traffic
11
(The Netherlands)SUMMARY OF PROTECTED BIKE LANES INTERSECTION DESIGNS
Mixing Zone Fully Split Phase Delayed Turn (AKA Split LBI) Offset Crossing
Primary treatment Primary treatment Pilot treatment, not in widespread use Pilot treatment, not in widespread use
Description Parking is removed on the approach Provides a dedicated turn lane Bicycles receive a conflict free head Dutch style treatment within the
to the intersection to create visibility adjacent the bicycle lane. Turning start (10 sec. min.) with a green intersection that features a tight
between bicyclists and turning movements across the bike lane bicycle signal. Following this head corner radius to slow vehicle turns
motorists. Motorists are provided happen in a dedicated phase with a start, turning drivers receive a and a modest deflection of the bike
yield signs and markings while the green turn arrow during which Flashing Yellow Arrow (FYA) and lane to allow for reaction time and
bicycle lane converts to a shared bicyclists are held with a red bicycle may turn after yielding to people queuing space. The conflict between
area where motorists and bicyclists signal. walking and bicycling. cyclists and motorists is constrained
negotiate their movements. to middle of intersections.
Benefits Bicyclists receive all of the through Complete separation in time and Bicyclists proceed with no conflict for Slowed turn with a short conflict
phase green time, reducing their space between through bicyclists part of through phase. Allows for the zone between bicyclists and turning
delay. Removes the turning vehicle and turning vehicles. Removes installation of Leading Pedestrian vehicles. A continuous bike lane
from the through lane allowing the turning vehicles from through lanes Intervals with no capacity impacts for enhances the sense of security and
driver to focus on bicycle and improving traffic capacity. through vehicles. creates more predictable
pedestrian traffic. movements.
Parking loss Medium High High Low
Challenges The shared space in advance of Little green time for bicyclists (1 of 3 Driver comprehension of the FYA A new, unfamiliar design where
intersection can increase bicyclist phases) creates delay and can result may be low. The placement of the drivers may recognize bicyclists late
stress levels. The design creates in frequent non-compliance by bike lane between the curb and in turn. Requires an amount of street
unpredictable bicycle movements. bicyclists. High loss of parking and turning path of vehicles places space that may not always be
typically a reduced turning vehicle bicyclists in a potentially unexpected available and turning vehicles may
capacity. and less visible location. High block the through lanes.
parking loss.
Typical use One-lane cross streets where a Multi-lane cross-streets; higher Where a LPI is needed but some Cross streets with a low turning
Leading Pedestrian Interval (LPI) is speed roadways; locations with no curbside use needs to be retained volume and sufficient roadway width
not needed. gap in pedestrian traffic; in compared to Fully Split; moderate for design.
conjunction with a LPI. pedestrian and turning volumes.
nyc.gov/dot 12STUDY DESIGN nyc.gov/dot 13
STUDY METHODOLOGY
    This study builds on the success of NYC’s protected bike lanes
    through improving the understanding and impacts of different
    intersection designs. Specifically, to better understand safety,
    geometric and operational constraints, behaviors and preferences,
    several different data sources and research methods are combined.
    These different approaches are summarized into the following
    categories:

           SAFETY
           An evaluation of bicyclist-involved injury crashes at
           intersections with Protected Bike Lanes (PBLs);

           CONFLICTS
           An observational study using video to evaluate behaviors     An intercept survey of people on bikes is conducted at a Delayed Turn
                                                                                                     intersection
           and conflicts between people on bikes and turning drivers;
           and

           COMFORT
           An intercept survey to assess bicyclists’ comfort and
           understanding of different types of PBL intersections.

                                                                          Video screenshot: Offset Crossing at Columbus Avenue & W 70th
                                                                                                       Street

nyc.gov/dot                                                                                                                            14
METHODOLOGY: SAFETY Crash Analysis* The low number of bicyclist-involved crashes is one of the biggest barriers to conducing safety evaluations of cycling treatments. To conduct an evaluation that yields meaningful results requires a large set of locations and years after installation. For this study, the intersections from one-way Protected Bike Lanes (PBLs) installed between 2007-2014 are evaluated (184 intersections). Due to the requirement of several years of post-installation data, only the Mixing Zones and Fully Split Phase signals are evaluated with this method. Because not all of the treatment types were installed at the same time and cycling volumes changed dramatically over time, the comparative crash analysis between treatments uses crashes from 2014-2016. Bicycle volumes for all sites are estimated using known volumes along the study corridors and adjusted for seasonal and annual variations with data from permanent bicycle counters and the annual bicycle count program. A summary of the methodology, data, and results are provided in this report. For further details refer to the Appendix. Example of a current generation Mixing Zone nyc.gov/dot *Crash data source: NYPD Crash Database 15
METHODOLOGY: CONFLICTS
    Observational Study
    As a complementary approach to the crash analysis
    study, an observational study provides a method to
    evaluate more recent intersection designs that do not
    have sufficient crash data. This technique analyzes
    conflicts and interactions between turning vehicles
    and bicyclists to identify whether the designs are
    functioning safely and as intended. An additional
    benefit to using video is that observations can be
    made on other interactions and road user behaviors.
    This can help inform design modifications that
    incorporate bicyclist comfort and better guide people
    into safer behaviors.

    This study viewed 9 intersections in total using
    approximately 12 hours of peak travel period
    (morning and evening) footage.

                                                            Video screenshot: Columbus Avenue & W 70th Street

nyc.gov/dot                                                                                                     16
METHODOLOGY: COMFORT Intercept Survey To get a better understanding of bicyclists’ comfort and understanding of different types of Protected Bike Lane (PBL) intersections, an intercept survey was conducted by the NYC DOT Street Ambassadors team. The Ambassadors surveyed 515 bicyclists at Mixing Zone, Delayed Turn, and Offset Crossing intersections and asked them questions relating to their perceptions of safety, clarity of the intersection designs, and general demographic and cycling frequency questions. This survey focused on questions relating to conflicts with turning vehicles and thus Fully Split Phase intersections are not included. nyc.gov/dot 17
KEY FINDINGS

nyc.gov/dot                  18
KEY FINDINGS: SAFETY
    The following table provides a summary of bicycle crash rates by treatment for before and
    after Protected Bike Lane (PBL) projects. A key result is the overall reduction in
    intersection bicycle crashes per bicyclist by 30% after installing protected bike lanes.
                                                                                                                                   30%
                                                                                                                           Overall reduction in
    It is also interesting to compare the rates between different treatments. For example, the                            intersection crashes
    crash rate at Current Generation Mixing Zones is lower than that of Fully Split
    Phase locations (1.4 and 2.0, respectively).                                                                               per bicyclist
                                                                                                                        following PBL installations
    Crash risk factors including traffic volumes and geometry are included in the design
    decision to install a particular treatment type. This is demonstrated in the table below
    where the Fully Split Phase, typically used at wider and higher volume intersections, have
    higher before crash rates than the overall Mixing Zone locations (4.3 and 1.9,                                                    1.4
    respectively), and thus a higher reduction in crash rates when compared to the Mixing                                  Intersection injury bicycle
    Zone, is expected. Before-after comparisons between the full set of Mixing Zone and                                 crashes per million bicyclists for
    Fully Split Phase locations should not be considered an "apples-to-apples"                                          Mixing Zones (current design)
    comparison.

                   Change in Intersection Injury Bicycle Crashes                                                                      2.0
                 per Million Bicyclists from before PBL installation1                                                      Intersection injury bicycle
                                                                     Crash Rate
    Treatment                             Study Sites Before After                                                      crashes per million bicyclists for
                                                                      Change
    Current Generation Mixing Zone     2      71       1.9    1.4       -27%                                               Fully Split Phase signal
    First Generation Mixing Zone2             55       2.1    1.7       -21%                                                       locations
    Fully Split Phase                         53       4.3    2.0       -54%
    All Study Intersections3                 184       2.5    1.7       -30%
    (Mixing Zones and Fully Split Phase)
    1) Calculated from 2000-2017 bicycle crashes and volumes
    2) The first generation mixing zones are designed with a longer shared lane between cyclists and turning vehicles
    3) Includes 5 non-Mixing Zone or Fully Split Phase intersections

nyc.gov/dot                                                                                                                                          19
KEY FINDINGS: CONFLICTS
Classification of Bicycle-Motor Vehicle Interactions*
Class (Severity) Definition
- Normal traffic interaction
1 Precautionary braking or direction change with a low probability of collision Rare events
2 Controlled braking or direction change with little maneuvering time
3 Strong braking and/or rapid swerving, near-crash
4 Emergency braking or swerving, near or slight crash As presented in the table below, very
5 Crash few “serious” conflicts were
*Conflict categorization adapted from the Dutch Objective Conflict Technique for Operation and Research (DOCTOR) method observed. No Class 5 (actual
crashes) were observed. Only 2
All of the interactions between people on bicycles and turning drivers are classified based on Class 4 conflicts (1 at a Mixing Zone
the above criteria. Any unusual interaction above a normal traffic interaction is assigned a and 1 at a Delayed Turn) and 12
score based on ascending severity. Class 3 conflicts were observed.
As shown in the figure below, unusual interactions with conflicts between bicyclists and The predominate type of conflict
turning vehicles are relatively rare events occurring to less than 2.3% of bicyclists traveling identified, Class 1, are unlikely to
through any given intersection. Over half of these are simply precautionary moves with a low result in a crash and are more related
chance of collision that are more related to bicyclist comfort. to bicyclist stress and comfort.
Percentage of people bicycling through an intersection that For all observed
are involved in a conflict with a turning vehicle (all study sites) conflicts, % occurring
Minor interaction Class in each class
Conflict Class 2-4,
(Conflict Class1), 1 69%
conflict severity
0.7%
1.6%
Increasing
2 28%
3 3%
4 1%
5 0%
100%
No conflict,
97.6%
nyc.gov/dot 20KEY FINDINGS: CONFLICTS
To understand how frequently conflicts between Conflicts per turning vehicle when bicycles are present
bicyclists and turning vehicles occur, conflict rates
0.16
are calculated based on the observed conflicts and 0.01
Conflicts per turning vehicles when a bicycle is
the total number of vehicles turning while people
are bicycling near or through the intersection. 0.14
Separate rates are calculated for the Class 1 0.12
(minor interaction) conflicts and the more serious
Class 2-4 conflicts. These rates provide helpful 0.10
insights into how an intersection performs on the 0.05
present
key measures of comfort and safety. As an 0.03
0.08
example, 9% of the time that a vehicle is turning at
a Mixing Zone while a bicyclist is also present, the 0.02
0.06
result is a minor interaction.
While additional data is needed to more fully 0.04
understand the relationship, the conflict rate likely
relates to both likelihood of a collision and bicycling 0.02
stress levels, particularly for the higher class of 0.09 0.15 0.06 0.08
conflicts. Examining the difference in rates may 0.00
also explain some of the disparity between the Mixing Zone Fully Split Phase Delayed Turn Offset Crossing
findings of the crash analysis and the bicyclist-
Minor interaction (Conflict Class1) Conflict Class 2-4
reported comfort. In the following section, the
differences between treatments are discussed in
further detail.
nyc.gov/dot 21KEY FINDINGS: COMFORT
Some of the key survey results relating to bicyclist comfort levels at Response to bicyclist intercept survey question:
intersections include: "I feel safe cycling through this intersection"
100%
Most bicyclists (65% of those surveyed) report feeling safe
90%
riding through Mixing Zones with similar results at the Delayed
Turn locations. 80%
Of the three treatments evaluated where conflicting vehicle 70%
turns are allowed, the Offset Crossing is found to have the 60%
highest levels of user comfort with 93% of bicyclists surveyed
feeling safe riding through them. 50% Disagree
40% Neutral
Because the survey focused on the understanding of
Agree
intersection designs where bicyclists and turning drivers must 30%
interact, no locations of the Fully Split Phase design, with the
20%
two movements completely separated in time, are included in
the survey. However, based on the frequent community 10%
requests for Fully Split Phase intersections in place of Mixing
Zones and the separation of the bicycle phase and the turning 0%
Mixing Zone Delayed Turn Offset Crossing
vehicle phase, it is expected that this intersection design has a
high level of cyclist comfort. Note: This survey focused on questions relating to conflicts with turning
vehicles and thus Fully Split Phase intersections are not included.
nyc.gov/dot 22KEY FINDINGS: BY TREATMENT nyc.gov/dot 23
KEY FINDINGS: MIXING ZONE Treatment:
Mixing
Zone
Fully Split Delayed
Phase Turn
Offset
Crossing
Evaluation Crash Video Survey
SAFETY Methods:
Intersection Bicycle Crashes per Million Biyclists1
Current Generation First Generation
Category Sites4 Mixing Zone2 Sites4 Mixing Zone2 Sites Fully Split Phase
All Study Intersections 71 1.4 55 1.6 53 2.0
Low Vehicle Turning Vol.3 10 1.5 5 2.1 12 2.0
High Vehicle Turning Vol.3 10 1.3 8 1.6 34 2.2
1 Lane Cross-Streets 63 1.2 43 1.3 21 0.9
2 Lane Cross-Streets 7 2.7 8 2.3 9 0.6
2+ Lane Cross-Streets 8 2.7 12 2.7 32 2.8
1) Calculated from 2014-2016 bicycle crashes and volumes
2) The first generation mixing zones are designed with a longer shared lane between bicyclists and turning vehicles
3) The low turning vehicle volume subset is approximatelyKEY FINDINGS: MIXING ZONE Treatment:
Mixing
Zone
Fully Split Delayed
Phase Turn
Offset
Crossing
Evaluation Crash Video Survey
CONFLICTS Methods:
Conflicts per turning vehicle when bicycles are present
While safety is the primary concern, bicyclist comfort,
0.16 mobility, and predictable movements by all street users
Conflicts per turning vehicles
0.14 0.01
when a bicycle is present
are important considerations in intersection design.
0.12
The observational study provides details on how
0.10 0.05
0.03 frequently unusual interactions between people on
0.08 bicycles and drivers turning occur. It also examines
0.06 0.02
behaviors such as path choice through the
0.04 intersection, red light running, and yielding to
0.02 determine how people are actually using the facility.
0.09 0.15 0.06 0.08
0.00 Key findings for Mixing Zones include:
Mixing Zone Fully Split Phase Delayed Turn Offset Crossing
• There is little consistency in whether bicyclists
Minor interaction (Conflict Class1) Conflict Class 2-4 go in front or behind of turning vehicles, but
bicyclists appear to prefer going behind the path of
the turning vehicle. The intent of the Mixing Zone
design is to allow for freedom of movements to
negotiate the space between turning drivers and
Cyclist behavior through an intersection when a turning vehicle is present
bicyclists, this includes bicyclists riding behind
turning vehicles. Not all bicyclists may be aware
that this is a permitted maneuver which can make
behaviors at Mixing Zone intersections less
predictable and may add to the stress of people
bicycling.
• While still a rare event, Mixing Zones have
higher rates of the more concerning conflicts
between bicyclists and turning vehicles (conflict
scores 2-4) than the other intersection
treatments. These conflicts may not necessarily
lead to crashes but these interactions may explain
some of the disparity between the findings of the
crash analysis and the bicyclist-reported comfort.
nyc.gov/dot 25KEY FINDINGS: MIXING ZONE Treatment:
Mixing
Zone
Fully Split Delayed
Phase Turn
Offset
Crossing
Evaluation Crash Video Survey
COMFORT Methods:
Intercept survey of 265 bicyclists at Mixing Zones
100%
Disagree 15%
80% Neutral 20%
60% Agree
40% 75%
60% 65%
20% 36%
0%
It's clear how It's clear how It's clear who I feel safe
cars should cyclists must yield cycling through
turn should travel this intersection
through
Video Screenshot: Example of bicyclists in a Mixing Zone weaving
through or behind turning vehicles
The intercept survey of people who had just bicycled through the
intersection can reveal additional insights into the clarity of an
intersection design, the understanding of traffic rules, and the feeling of
safety. Key findings from the survey responses at Mixing Zones include:
• It is evident that clarification is needed on how drivers should
use the Mixing Zone and who should yield. The majority of
respondents stated that it is usually not clear who has the right-of-
way between turning drivers and people bicycling through the
intersection. This lack of clarity may lead to additional traffic conflicts,
stress, and assertive driving and bicycling behaviors.
• At Mixing Zones, 65% of the respondents stated that they feel
safe with another 20% stating that they neither feel safe or unsafe.
nyc.gov/dot 26KEY FINDINGS: FULLY SPLIT PHASE Treatment:
Mixing Fully Split Delayed Offset
Zone Phase Turn Crossing
Evaluation Crash Video Survey
SAFETY Methods:
Intersection Bicycle Crashes per Million Bicyclists1
Current Generation First Generation
Category Sites4 Mixing Zone2 Sites4 Mixing Zone2 Sites Fully Split Phase
All Study Intersections 71 1.4 55 1.6 53 2.0
Low Vehicle Turning Vol.3 10 1.5 5 2.1 12 2.0
High Vehicle Turning Vol.3 10 1.3 8 1.6 34 2.2
1 Lane Cross-Streets 63 1.2 43 1.3 21 0.9
2 Lane Cross-Streets 7 2.7 8 2.3 9 0.6
2+ Lane Cross-Streets 8 2.7 12 2.7 32 2.8
1) Calculated from 2014-2016 bicycle crashes and volumes
2) The first generation mixing zones are designed with a longer shared lane between bicyclists and turning vehicles
3) The low turning vehicle volume subset is approximatelyKEY FINDINGS: FULLY SPLIT PHASE Treatment:
Mixing Fully Split Delayed Offset
Zone Phase Turn Crossing
Evaluation Crash Video Survey
CONFLICTS Methods:
Conflicts per turning vehicle when bicycles are present
0.16
Conflicts per turning vehicles
0.14 0.01
when a bicycle is present
0.12
0.10 0.05
0.03
0.08
0.06 0.02
0.04
0.02
0.09 0.15 0.06 0.08
0.00
Mixing Zone Fully Split Phase Delayed Turn Offset Crossing
Minor interaction (Conflict Class1) Conflict Class 2-4
While safety is the primary concern, bicyclist comfort, mobility, and
predictable movements by all street users are important Video screenshot: Example of different bicyclist routes through the
considerations in intersection design. Key findings for Fully Split intersection during the turning vehicle phase
Phase intersections include:
• The Fully Split Phase location has the lowest conflict rate for
the higher scoring (conflict scores 2-4) conflicts. This is likely
due to the design providing separate signal phases for bicyclists
and turning vehicles
• The high rate of minor conflicts typically occur during the
turning vehicle phase when bicyclists would continue
through the intersection (disregarding the red bicycle signal
indication) either by entering into the turn lane upstream of the
intersection or merging through cars while in the intersection.
nyc.gov/dot 28KEY FINDINGS: FULLY SPLIT PHASE Treatment:
Mixing Fully Split Delayed Offset
Zone Phase Turn Crossing
Evaluation Crash Video Survey
COMFORT Methods:
Because the intercept survey of people bicycling focused on questions
relating to conflicts with turning vehicles, Fully Split Phase intersection
locations, with separate signal phases for bicyclists and turning vehicles,
are not included.
However, based on letters and other comments from the public received
by NYC DOT, it is clear that the Fully Split Phase design provides a
feeling of safety for many people bicycling or who are interested in
bicycling.
While this design is comfortable to many, the frequent use of this Bicycle and through-vehicle phase
treatment along a corridor, particularly at smaller cross-streets, can result
in discomfort and stress to some people bicycling due to the increased
intersection delay. This added delay can quickly compound along a
corridor which may decrease mobility and contribute to impatient bicycling
behaviors. Additionally, the implementation challenges that come from the
loss of parking and/or loading zones needed for a full turn lane may make
a Protected Bike Lane (PBL) project impractical on some corridors.
Therefore, using the results of the crash analysis as guidance, the Fully
Split Phase design is most appropriate at larger intersections where this
delay is acceptable, at higher speed locations, or where such a low stress
design makes a critical PBL or greenway connection possible.
Turning- and through-vehicle phase
(bicyclists held on red signal)
nyc.gov/dot 29Mixing Fully Split Delayed Offset
KEY FINDINGS: DELAYED TURN Treatment:
Zone Phase Turn Crossing
Evaluation Crash Video Survey
SAFETY Methods:
Because this treatment is a new design, there is with limited ‘after’ data available to conduct a
crash-based evaluation. While a minimum of 3 years of data at several sites are typically necessary for
these studies, video observations and surveys can capture valuable interim data to gain an
understanding of how the design is functioning.
The conflict study (on the following page) indicates that this design can work well, however the video
analysis revealed several interesting observations that may affect safety, including:
• At the start of the Flashing Yellow Arrow phase (from red), several conflicts were observed.
This occurred when people were bicycling adjacent to the turning vehicle at the moment that the
drivers’ light changed and the drivers entered the bike lane extension without looking.
• When the vehicle turning queue spilled out beyond the turn lane, drivers were observed to
bypass the queue and make a double turn onto the cross-street. This behavior was also observed
at high turn volume Mixing Zone locations and presents a safety concern as the view between the
double turning driver and people in the bike lane is blocked by the car in the turn lane. Leading Bicycle Interval Phase: 10+ s
Example of a driver bypassing the turning queue and
making a double turn at a Delayed Turn location Flashing Yellow Turn Phase
nyc.gov/dot 30Mixing Fully Split Delayed Offset
KEY FINDINGS: DELAYED TURN Treatment:
Zone Phase Turn Crossing
Evaluation Crash Video Survey
CONFLICTS Methods:
Conflicts per turning vehicle when bicycles are present
0.16
Conflicts per turning vehicles
0.14 0.01 The video analysis revealed several interesting
when a bicycle is present
0.12 observations on the operation of the Delayed Turn
0.10 0.05 intersection including:
0.03
0.08
0.02 • 53% of bicyclists were observed to leave the bike
0.06 lane to go behind a turning vehicle, treating it similar
0.04 to a Mixing Zone with a preference to go behind the
0.02
0.09 0.15 0.06 0.08 path of the turning vehicle.
0.00
• The Delayed Turn locations have the lowest total
Mixing Zone Fully Split Phase Delayed Turn Offset Crossing
rate of interactions between bicyclists and turning
Minor interaction (Conflict Class1) Conflict Class 2-4 vehicles. However, the conflict at the start of the
Flashing Yellow Arrow should be addressed.
Cyclist behavior through an intersection when a turning vehicle is present
nyc.gov/dot 31Mixing Fully Split Delayed Offset
KEY FINDINGS: DELAYED TURN Treatment:
Zone Phase Turn Crossing
Evaluation Crash Video Survey
COMFORT Methods:
Intercept survey of 222 cyclists at Delayed Turn intersections
100%
Disagree
18%
80% Neutral
Agree 19%
60%
40% 82%
67% 63%
20% 43%
0%
It's clear how It's clear how It's clear who I feel safe
cars should cyclists should must yield cycling through
turn travel through this intersection
The intercept survey of people who had just bicycled through the intersection Example of different bicyclist routes through the intersection
can reveal additional insights into the clarity of an intersection design, the when a turning vehicle is present
understanding of traffic rules, and the feeling of safety. This is information is
particularly helpful when evaluating the understanding and effectiveness of
new designs. Key findings from the survey responses at Delayed Turn
intersections include:
• There is slightly higher bicyclist reported rate of understanding on
how users should navigate the intersection when compared to the
Mixing Zone.
• Similar to the Mixing Zones, the majority of bicyclists stated that it is
not clear who is to yield at the intersection.
• At Delayed Turn intersections, 63% of the respondents stated that
they feel safe, thus reporting a similar feeling of comfort as the Mixing
Zone locations.
nyc.gov/dot 32KEY FINDINGS: OFFSET CROSSING Treatment:
Mixing
Zone
Fully Split Delayed
Phase Turn
Offset
Crossing
Evaluation Crash Video Survey
SAFETY Methods:
Because this treatment is a new design, there is with limited ‘after’ data available to conduct a
crash-based evaluation. However, video observations and surveys can capture valuable interim data to
gain an understanding of how the design is functioning. The conflict study (on the following page)
indicates that this design can work well, however the video analysis revealed several interesting
observations that may affect safety, including:
• Drivers are turning faster than preferred. Utilizing a design with a tighter radius will likely slow the
speeds at which drivers turn allowing for more reaction time and a greater opportunity to yield.
• The 15’ offset between the motor vehicle travel lane and bike lane provides sufficient space for
a typical vehicle to turn and yield to people walking and biking without blocking the bike and
travel lanes.
Cyclists and drivers interacting at the Columbus Avenue & W 70 Street Offset Crossing
nyc.gov/dot 33KEY FINDINGS: OFFSET CROSSING Treatment:
Mixing
Zone
Fully Split Delayed
Phase Turn
Offset
Crossing
Evaluation Crash Video Survey
CONFLICTS Methods:
Conflicts per turning vehicle when bicycles are present`
Because the Offset Crossing is a new pilot
0.16
treatment a crash analysis can not be
Conflicts per turning vehicles
0.14 0.01
when a bicycle is present
conducted. Instead, the observational study
0.12 provides an initial understanding on whether
0.10 0.05 people are using this intersection type as
0.03
0.08 designed and the type and frequency of
0.06 0.02 interactions that occur between bicyclists
0.04 and turning vehicles. Key findings include:
0.02
0.09 0.15 0.06 0.08
• Drivers are turning at a higher speed
0.00 than preferred leading to short reaction
Mixing Zone Fully Split Phase Delayed Turn Offset Crossing times and more potential crashes than if
the speeds were slower.
Minor interaction (Conflict Class1) Conflict Class 2-4
• Bicyclists are much more likely to
yield to turning vehicles (27% of the
time) than at the other intersection
designs. This is likely related to the short
Cyclist behavior through an intersection when a turning vehicle is present
reaction time, where bicyclists are unsure
whether a driver will yield to them and
thus make a cautionary stop. It is also not
designed to allow for bicyclists to go
behind the turning vehicle, the typical
movement at Mixing Zones, likely
increasing the number of bicyclists
stopping for turning traffic.
• The conflict rate can likely be reduced
through changes in the geometry that
slow turning speeds and increase the
visibility of the bicycle facility.
nyc.gov/dot 34KEY FINDINGS: OFFSET CROSSING Treatment:
Mixing
Zone
Fully Split Delayed
Phase Turn
Offset
Crossing
Evaluation Crash Video Survey
COMFORT Methods:
Intercept survey of 43 cyclists at Offset Crossings
The NYC DOT recently changed the design of this
100% 2% intersection, if you noticed a difference, which
Disagree 5%
intersection design do you prefer? (43 responses)
80% Neutral
Prefer Mixing Zone
Agree 12%
60%
88% 93%
40% 74% Neutral
18%
20% 42%
Prefer new design
0%
(Offset Crossing)
It's clear how It's clear how It's clear who I feel safe
70%
cars should cyclists should must yield cycling through
turn travel through this intersection
At Columbus Avenue & W 70th Street, the Mixing Zone was converted into a pilot Offset Crossing
location. This afforded the opportunity of conducting an intercept survey for both treatments at the same
location. This intercept survey of bicyclists at the pilot Offset Crossing found:
• The design is effective in creating a comfortable intersection for bicyclists. Where the pilot
Offset Crossing replaced a Mixing Zone, 70% of the bicyclists stated that they preferred the new
(Offset Crossing) design and 18% were neutral.
• 93% of the respondents stated that they feel safe riding through the Offset Crossing intersection.
However, that feeling of safety must also translate into actual safety for this to be an effective design.
• The Offset Crossing had the highest stated understanding of how bicyclists and drivers
should use the design.
• The clarity of who must yield at Offset Crossings is low. This is a similar finding compared to the
other intersection designs.
nyc.gov/dot 35RECOMMENDATIONS AND NEXT STEPS nyc.gov/dot 36
INTERSECTION DESIGN MATRIX FOR ONE-WAY PROTECTED BIKE LANES

    This study identified the effects, perceptions, and understanding of
    the different design treatments used for Protected Bike Lanes at
    intersections. Overall, the findings show that both Mixing Zones and Fully
    Split Phase intersections have substantial reductions in the rate of bicyclist
    crashes following their installation as part of a PBL project.

    The two pilot treatments evaluated in this study show potential to be
    valuable additions to the intersection design toolbox. When
    appropriate, these treatments will continue to be used in NYC bikeway
    projects while they are continued to be studied and refined.

    Based on results of this study, NYC DOT’s current design practices,
    and a review other research and guidance, this report developed
    interim design recommendations for selecting PBL intersection
    treatments under different conditions.

    These recommendations include a range of different street conditions
    and presents the applicability of each of the designs under those
    conditions taking into account both safety, comfort, and feasibility.
    Note that these recommendations are suggestions as a starting point for
    designers but that site- and project-specific conditions may require a
    different approach. This is particularly the case for the turning vehicle
    volumes where the recommendations are primarily based on operational
    rather than safety constraints. As the knowledge base is always evolving,
    the design matrix will be updated periodically to reflect new information and
    best practices.

    This design matrix will help guide NYC DOT designers in selecting
    appropriate and consistent designs for different street contexts and are
    intended to provide a transparent decision making framework to the public.

                                                                                      Progression of bicycle facilities on 2nd Avenue
                                                                                     (none, buffered bike lane, PBL with Mixing Zone)

nyc.gov/dot                                                                                                                         37
INTERSECTION DESIGN MATRIX FOR ONE-WAY PBLS
Application Delayed Turn (AKA Split LBI)
Mixing Zone Fully Split Phase Offset Crossing
Considerations1 Continue with limited use under specific conditions
Preferred for higher turn Preferred when a gap in ped Possible for turn volumesACTIONS: COMFORT
Under some conditions, the intersection design matrix allows for the
discretion of the street designer to select the most appropriate
treatment based on the project context. This makes understanding the
substantive safety of a bicycle facility and the amount traffic stress that it
presents to bicyclists critical to designing a bikeway network that is safe,
convenient, and attractive to bicyclists of all abilities.
Lower-stress designs can increase safety by contributing to the “safety
in numbers” effect that comes from an increase in bicyclists. But due to
a number of factors that include predictability and tolerance for delay, not all
designs that are comfortable are safe or practical in all situations.
Facility design can provide both the highest level of safety as well as comfort
and convenience. In practice however, trade-offs are often necessary based
on balancing other street users, curbside and adjacent uses, and
transportation network needs. When selecting intersection treatments, it’s
critical to understand the conditions where each design may be used safely
and the effect on bicyclist comfort and delay.
Comparing the Fully Split Phase and the Mixing Zone designs provides a
good example. While the Fully Split Phase often has a lower stress level for
bicyclists, it also creates higher bicyclist and pedestrian delay, particularly if
used frequently along a corridor. In addition, factors such as the greater
infrastructure needs and an increased loss of curbside loading zones and
parking may make the Mixing Zone a better choice at many locations.
To help with the decisions at individual intersections, a review of the crash
analysis indicates a marginally higher safety performance from the Fully Split
Phase over the Mixing Zone with minimal differences at low volume, narrow
cross-street locations. Therefore, the application of the Fully Split Phase
treatment should be prioritized to where it is most beneficial such as at
wider intersections or where a low-stress cycling connection is needed.
nyc.gov/dot 39ACTIONS: DESIGN
Mixing Zone
Design Recommendations
• The longer (older generation) Mixing Zones
should be replaced with the shorter, current
design as markings are refreshed.
• Pursue modifications to the placement of
sharrows and intersection markings and the
addition of elements in the channelized
intersection approach to maintain the clear zone
free from parking.
• Intersection crossings should be shortened to
reduce the possibility of double turns at
locations where the turning queue frequently
spills back into the travel lane.
• Include traffic calming measures at multilane
cross-streets to reduce turning speeds and
cyclist exposure to turning vehicles.
nyc.gov/dot 40ACTIONS: DESIGN
Fully Split Phase
Design Recommendations
• At locations with a high crash potential, evaluate vertical
elements between the bike lane and turn lane. Note that
increased maintenance is necessary for such a design,
including snow plowing.
• Develop strategies to improve signal coordination that
reduces bicyclist stopping and delay along corridors with
several Fully Split Phase intersections.
nyc.gov/dot 41ACTIONS: DESIGN
Delayed Turn
Design Recommendations
• Evaluate placing a small buffer between the bike
lane and turn lane to improve reaction time and
operating space.
• Employ and evaluate higher visibility markings
through the conflict zone, such as wider peg-a-
track lines or green bars.
• Intersection crossings should be shortened to
reduce the possibility of double turns at locations
where the turning queue frequently spills back into
the travel lane.
• Evaluate traffic calming measures at multilane
cross-streets to reduce turning speeds and
bicyclist exposure to turning vehicles.
nyc.gov/dot 42ACTIONS: DESIGN
Offset Crossing
Design Recommendations
• Evaluate a reduced corner radius to 12 ft
for turning passenger vehicles along with
larger radius for small trucks with traffic
calming to slow their speeds and
discourage the use of the larger radius by
passenger vehicles.
• Extend the far side channelization to
visually narrow the cross-street for turning
drivers.
• Evaluate narrower offset options (ACTIONS: EDUCATION & ENFORCEMENT
EDUCATION
• Update the Bike Smart Cycling Guide to highlight risky behaviors and clarify how to interact with drivers at
different intersection types.
• Create handouts for cyclists and drivers to clarify when and where one must yield and how to safely share the
road at intersections.
• Develop an on-street activation event (e.g. ‘Dusk and Darkness’) to engage with drivers and cyclists citywide to
promote safe intersection behaviors.
• Conduct digital outreach to share highlights from this report, provide context for bicycle project updates on social
media channels, and feature the different intersection types in NYC DOT newsletters.
ENFORCEMENT
• Continue to work with NYPD to develop actions based on the locations and behaviors found to be the most likely
to result in crashes. Tailored enforcement will focus on locations with higher traffic speeds, volumes, and
crossing distances where the cyclist risk of injury is higher.
nyc.gov/dot 44ACTIONS: KEY INTERSECTION UPGRADES
The Vision Zero Year Three Report (NYC Mayor’s
Office of Operations, February 2017) included a new
initiative for Vision Zero Year 4: Make upgrades to
at least 20 key cycling intersections within the
bike network. In 2017, NYC DOT upgraded 8
intersections. The remaining 12 intersections will be
completed in 2018. The results of this report are
being used to inform upgrades to Protected Bike
Lane intersections.
NYC DOT is committed to improving cycling safety.
Intersection upgrades will be selected based on
crash history and the high potential for crashes
based on known contributing factors such as street
design, turning traffic volumes and crossing
distances.
2017 upgrades included a bike lane to Protected Bike Lane conversion on 5th Avenue in
Manhattan, featuring both Mixing Zones and Fully Split Phase (shown) intersections
nyc.gov/dot 45You can also read