Learning How Spectator Reactions Affect Popularity on Twitch
←
→
Page content transcription
If your browser does not render page correctly, please read the page content below
Learning How Spectator Reactions Affect Popularity on Twitch

                  Jeongmin Kim∗ , Kunwoo Park† , Hyeonho Song‡¶ , Jaimie Y. Park§ and Meeyoung Cha¶‡
                                         ∗ Hyperconnect, Seoul, Republic of Korea
                                    † Qatar Computing Research Institute, Doha, Qatar
          ‡ School of Computing, Korea Advanced Institute of Science and Technology, Daejeon, Republic of Korea
                             § Mobile Division, Samsung Electronics, Seoul, Republic of Korea
                       ¶ Data Science Group, Institute for Basic Science, Daejeon, Republic of Korea
Email : jeongmin.kim@hpcnt.com , bywords.kor@gmail.com, hyun78@kaist.ac.kr, jaimie.park@samsung.com, mcha@ibs.re.kr

   Abstract—Gameplay live streaming has become a highly de-       videos are on-air. A simple solution based on the history
manded online entertainment traffic on services like Twitch.tv.   of streamers will likely perform poorly due to various en-
The live chat concurrent with on-air streams allows viewers       dogenous (e.g., content quality) and exogenous (e.g., day of
to talk about the content with each other. This new form of
online content carries numerous spectator reactions, including    the week) factors. For example, game streamers sometimes
text and emojis, and brings a unique opportunity to predict       invite other celebrities to their channel, which temporarily
which video becomes popular in the end. This study presents a     increases viewership. For example, when a famous streamer
prediction model of viewer counts on a newly compiled dataset     Ninja asked a celebrity rapper Drake to play a game on his
describing the video popularity of Twitch live streams and        channel, his viewership increased by six times.1
chat reactions of spectators. Our analysis demonstrates that
the spectator reactions captured from the early-stage of live        This study investigates how spectator reactions embedded
streams, such as the first 15 minutes out of several hours of     in live chats that come along with the live stream content are
content, hold essential markers of the eventual popularity of     related to the ultimate popularity of the video stream. Fig ??
video streams. We discuss the implications of the findings and    shows example gameplay and its spectator reactions, where
future directions.                                                viewers interact with streamers and other spectators through
   Keywords-Twitch chat analysis; User response; Live stream-     chat in real-time. Chat content on Twitch, as with comments
ing; Video popularity prediction; Big data analytics              in different services, includes all kinds of conversation from
                                                                  questions, thoughts, cheers, hate speech, to spams, and so on.
                     I. I NTRODUCTION                             The goal of this research is to identify the list of features that
Predicting the popularity of online content has drawn a lot       capture such diverse types of viewer reactions for predicting
of attention from both academia and industry. One notable         the popularity of live streams and test its effectiveness. The
study was by Szabo and Huberman [1], who proposed an              key findings and contributions of this work are summarized
innovative way to predict popularity in Digg and YouTube          below:
only by observing the first few hours since content upload.         1) We release an extensive collection of data describing
Content characteristics on the internet since have become               66 million chat lines or utterances gathered from 2162
more diverse from user-generated short texts to ephemeral               live videos posted by the top 100 streamers on Twitch.
live streams, which makes popularity prediction more chal-          2) We examine diverse spectator reactions and categorize
lenging.                                                                them into 218 textual and non-textual features. Textual
   This paper focuses on a new kind of content: game-                   features represent utterance-level information such as
play live streaming. This content type, led by services                 Ngram, sentiments, and hate speech. Non-textual fea-
like Twitch.tv, has grown into a significant form of online             tures include information that cannot be captured by
entertainment. As of 2018, Twitch had more than 3.2 million             a single utterance such as chat intensity, subscriptions,
independent broadcasters and 45 billion minutes watched                 and social interaction. The model comparison experi-
per month. Gameplay streaming services offer a unique                   ment shows Random Forest performs well for the task.
experience to the audience by providing multiple interfaces         3) The popularity of live streams that typically last several
for them to communicate with broadcasters (i.e., streamers).            hours could be predicted with high accuracy as early
At any given moment, Twitch serves more than 40,000                     as the first 15 minutes. While textual features (e.g.,
concurrent live streams that are watched by millions of                 meme, Ngrams) are the most predictive when the entire
viewers.                                                                chat data are utilized, non-textual features (e.g., chat
   Compared to the prediction task on conventional web                  frequency, presence of loyal fans) become more critical
services, it is more challenging to forecast the popularity of
live streams because the prediction should be made while          1 https://tinyurl.com/yxjcl54s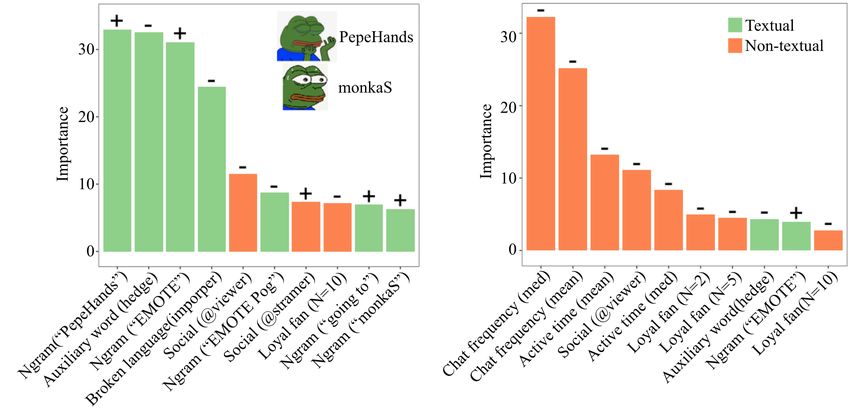
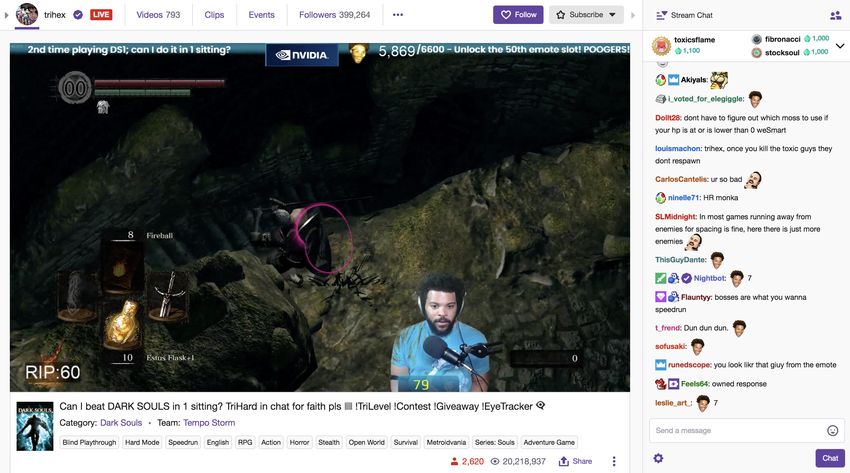
Figure 1: User interface of Twitch.tv with its main screen and the chat interface

     for the prediction in the first 15 minutes.                 language & embodied conduct, and the audience’s written
                                                                 chat messages and the annotation of game events. Most
                    II. R ELATED W ORK
                                                                 recently, a study proposed methods for encouraging and dis-
Online live streaming platforms are different from traditional   couraging specific behaviors [8], including taking advantage
broadcasting systems or content sharing websites. Viewers        of imitation effects by setting positive examples and using
can watch content while interacting with content producers       moderation tools to discourage antisocial behaviors.
and other viewers, as seen in Figure 1. Therefore, previous
research investigated how Twitch users are engaged in               While the above studies provide an essential view of
such chat conversations and what promotes and prevents           streamers and viewers on Twitch, most of them relied on
persistent engagements.                                          approaches based on self-reports such as questionnaires
   A line of research investigated which factors motivate        and in-depth interviews. Another line of studies employed
people to watch gameplay by streamers in online streaming.       quantitative methods on digital logs through web scrap-
A study investigated why users watch videos, subscribe, or       ping and API provided by services. One study provided
donate money on Twitch [2] and explained their behavior          a general overview of the Twitch community [9]. They
in terms of socialization, entertainment, and information        characterized video streams by a mixed-method approach
(i.e., learning new gaming strategies). A study suggests that    (i.e., viewer counts, duration, and audience characteristics).
a virtual community form around shared experiences in            Another group of researchers marked Netflix and Twitch
the same channel [3] such that the users feel a sense of         traffic using longitudinal traffic data [10], and described
belonging, which was explained by Social Identity theory         similarities and differences between the two. Another line
in another study [4]. Other researchers discovered five          of research focused on linguistic characteristics from real-
classes of gratification as motivating factors into persistent   time chat logs that represent viewer reactions. A study
engagement: cognitive, affective, social, tension release, and   investigated how the gender of streamers is associated with
personal integrative [5].                                        the nature of conversation through analyzing large-scale
   In addition to the viewer’s motivation, another line of       chat messages from Twitch [11] and found that gendered
studies focused on why streamers participate in broadcasting     communication and objectification are prevalent in chats.
and how a platform supports them. As motivating factors          More recently, a study examined the emote usage of Twitch
driving persistent streaming, a study identified ease-of-use,    audiences and showed its effectiveness in detecting trolling
self-presentation, boredom, and intended acceptance by the       behaviors through recurrent neural networks [12].
community. Another study also found that streaming helps            This paper attempts to predict the popularity of Twitch
broadcasters build their brand [6]. One study proposed a         live streams from viewer reactions on concurrent chat con-
multi-column transcription scheme that facilitates effective     versation. While there was a sizable amount of studies on
communication between the broadcaster and audience [7].          predicting content popularity in other online platforms (e.g.,
The proposed method includes the broadcaster’s spoken            Facebook videos [13], [14]), few studies have paid attention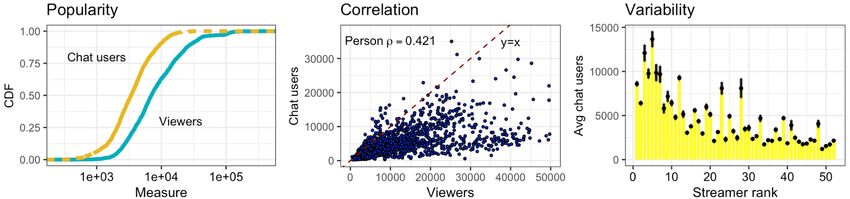
Table I: Description of Twitch chat data                    Table II: Descriptive statistics of Twitch streams (N=2,162)

                                      Description                                Type                  Mean      Median        Min       Max
   Column
                                                                        Viewer counts per video        14,121     7,013        458     407,047
 body         Actual content of a chat (string)                         Video length (min)                398       387         31       1,911
 channel_id   Channel identifier (integer)                              Chat users per video            4,600     3,395        244      35,000
 user_id      Chat user identifier (integer)                            Utterances per video           30,751    20,944        910     354,964
 user_type    Chat user type (character)                                Words per utterance              6.87         5          1          92
 created_at   Time of chat creation (ISO 8601 date and time)
 fragments    Parsing information including emotes (JSON list)
 offset       Time offset of video start time and chat (float)        with the audience. More precisely, we ask the following
 updated_at   Time of when chat was edited (ISO 8601 date and time)   research question:
 video_id     Video identifier (integer)                                    RQ. What are the characteristics of viewer reac-
                                                                            tions on popular live streams? Can they be used
                                                                            for the early detection of popular streams?
to predicting popular live streams on Twitch. A related                  To answer these questions, we targeted popular streamers
work extracted highlighted moments by incorporating video             and gathered past video histories and their associated chat
features with chat patterns [15].                                     logs. We utilized the top-100 streamer charts from a public
                                                                      listing at www.twitchmetrics.net and, for each streamer,
                  III. P ROBLEM AND DATA
                                                                      gathered up to 100 most recent videos and their metadata.
Twitch.tv is a live streaming video platform that is popular          We did not consider official channels broadcasting e-sports
for broadcasting gameplay. It provides the first-person point         matches because it lacks interactions between a streamer
of view of a broadcaster (called ‘channels’) to spectators.           and viewers. The data collection on video metadata took
Game companies run channels (e.g., Riot games) that broad-            place during May 2018 via the Twitch API. The chat logs
cast e-sports matches or by individual streamers who want             on each video then were gathered using the npm package2 .
to share their game-playing experience.                               In addition to these logs, we also found a public repository,
   One of the unique features of Twitch is the multi-                 www.sullygnome.com, listing the number of viewers at the
directional interplay between streamers and viewers, which            time of live streaming3 . This video popularity measure is
makes watching the video more engaging. The chat interface            a time-series data in that the repository service queried the
appears on the right to the main live streaming screen in             Twitch API every 15 minutes to compile multiple snapshots
Fig 1 is one way for viewers to participate in the broadcast.         of the estimated viewer count for every channel.
Viewers may write to streamers or talk by themselves                     Unlike the bite-sized content on YouTube, popular Twitch
via chat messages. The in-screen view of the streamer is              streams are lengthy due to the nature of game-playing and
another essential feature. It is not uncommon to see a                take upon average 267 minutes with a median of 238 minutes
streamer responds to chats during live broadcasts, which              based on the gathered data. To be consistent, we only focus
goes beyond the parasocial relationships offered on many              on streamers who broadcast in English. We also omit short
other on-demand video services. The top 100 streamers on              streams that terminated before 15 minutes, because these
Twitch each has over 800,000 followers, and their streams             videos leave little room for audience engagement. These
track great attention as well as donations (i.e., payments            conditions excluded 6,326 videos from the gathered set. The
made to streamers).                                                   final dataset comprises 2,162 videos and 66,482,761 chat
   When a live broadcast terminates, the streaming video              utterances (i.e., a unit of chat message) by 52 streamers and
and its chat log get archived on the channel page. By                 2,044,260 unique viewers. Table II presents the statistics of
gathering these chat logs and the video metadata, we can              live stream videos we studied. For each video, we collected
ask relevant questions on this user-generated content system.         the complete chat logs and the video metadata. We will make
Table I presents the description of each column in our                the dataset available for the broader research community. In
Twitch chat data. This dataset includes chat time during              the subsequent section, we introduce our prediction model
the streaming and parsing information about unique Twitch             that captures various aspects of audience reactions, including
emote texts, which describe spectators’ reaction patterns.            emote usage and chat frequency.
For the platform, anticipating which streams will attract
                                                                                  IV. P OPULARITY P REDICTION M ODEL
an audience in advance is a key to service provisioning.
The platform may dedicate more network bandwidth and                  We describe our method for predicting the popularity of
resources to serve live streams with a sizeable anticipated           live Twitch streams. Before starting an investigation on the
audience. Predicting popular live streams is helpful for view-        viewership as our content popularity, we conducted a simple
ers in terms of helping long-tail content recommendations.            2 https://www.npmjs.com/package/twitch-chatlog
Finally, understanding the characteristics of popular streams         3 Once a live stream ends, Twitch does not provide information on viewer
and viewer reactions will assist streamers in engaging better          counts, but only returns view counts of the archived version of that stream.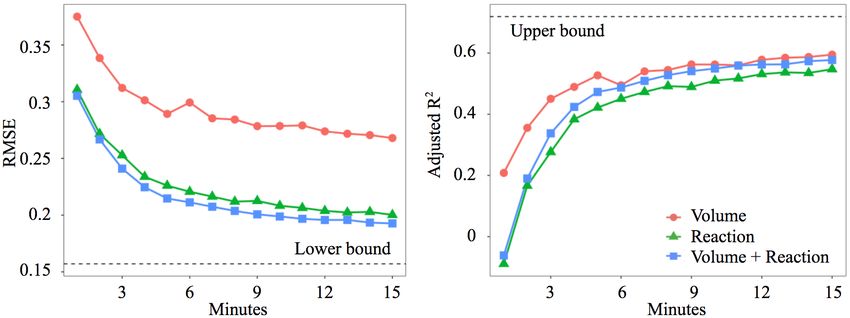
Figure 2: Measures of popularity of Twitch live streams

comparison between the viewership size, chat participants,                  fraction of utterances including slang words4 and other
and streamer rank. Since viewer count is averaged over every                broken language or irregular words were checked with
15-minute window, some of its value may be smaller than                     the pyenchant library.
the aggregate chatting user count. Fig 2(a) shows that the              2) Non-textual features:
viewer size has a significant variance even among the most
                                                                        •   Chat frequency (2 variables): To capture how active
popular videos. A similar level of variability is observed for
                                                                            the chat room is, we look at the frequency of chat
the number of participating chat users. Fig 2(b) demonstrates
                                                                            messages during the monitored time interval in terms of
that chat user count does not necessarily increase linearly
                                                                            the mean and median time interval between each user’s
with the viewership size. In particular, Fig 2(c) indicates that
                                                                            chat message arrival.
the average number of chat users is hard to be predicted by
                                                                        •   Loyal fan (3 variables): Building a community of loyal
view counts even after being aggregated at a streamer level.
                                                                            viewers is a key to sustainability [19]. We assume loyal
We hence utilize its log-transformed value with base ten as
                                                                            fans to participate in chats than other viewers actively
the dependent variable of our popularity prediction model.
                                                                            and count the fraction of those who contribute more
   Listed here is the full list of features. The chat at-                   than N utterances over chat_user_count. We include
tributes, which are the unique interaction feature provided by              three variables using N =2, 5, 10.
Twitch, can be categorized into two types: textual and non-             •   Active time (2 variables): To measure how long a viewer
textual. Features were normalized by the chat user count                    engages on the chat, we measured the time difference
(chat_user_count) or the number of chats (chat_count),                      between the first and last utterance for each user. The
to be comparable across video streams of varying popularity                 mean and median value is used for features.
level.                                                                  •   Emote-only (1 variable): Given the prevalence of
  1) Textual features:                                                      emotes in online chats, we here count the fraction
                                                                            of utterances that are only composed of emotes over
  •   Ngram (200 variables): To examine the frequent ex-                    chat_count.
      pressions that appear in chats, we utilize the 200-               •   Social interaction (3 variables): Three kinds of inter-
      dimensional TF-IDF vectors based on frequently ap-                    actions are considered. We count the number of times
      pearing unigram and bigram tokens. Due to the sheer                   the streamer or other viewers are mentioned in a chat
      number of distinct emojis, we here transform all emojis               message by examining utterances with ‘@username’
      into a single token ‘EMOTE’. All other words are                      sign. Twitch chats also allow for automatic replies by
      considered for n-gram in their original forms (e.g.,                  bots, which we also count as a third kind of interaction.
      upper case characters).                                               All variables are normalized by chat_count.
  •   Auxiliary words (3 variables): Based on the previous              •   Spamming (1 variable): Repeating identical or similar
      report on online conversations [16], we count the frac-               messages to hog the screen is a kind of spamming
      tion of chat utterances of popular linguistic markers                 act, which common on Twitch [3], [8]. We measured
      for hedge (e.g., ‘maybe’, ‘fairly’) from the word list in             utterance-level similarity over a moving window of
      github.com/words/hedges, question, and exclamation.                   length l. If similarity to any other utterance within a
  •   Word sentiment (1 variable): As a measure of audience                 window is high (i.e., above threshold t), then the ut-
      satisfaction [17], we compute the average of sentiment                terance is considered spam. The similarity is measured
      per utterance estimated by VADER [18].                                on the average of word vectors, embedded from a pre-
  •   Slang and broken language (2 variables): Slangs and
      shortened words frequently appear in online conversa-        4Acomprehensive list at www.freewebheaders.com/full-list-of-bad-words-
      tions, which also exhibit the community culture. The         banned-by-google
Table III: Evaluation of prediction performance using entire chat logs
Volume Reaction Volume + Reaction
Model
RMSE AdjR2 RMSE AdjR2 RMSE AdjR2
Linear regression 0.311 0.456 0.227 0.418 0.208 0.508
Lasso regression 0.312 0.453 0.223 0.435 0.204 0.522
Ridge regression 0.313 0.449 0.238 0.358 0.225 0.426
Random forest 0.272 0.583 0.182 0.625 0.157 0.719
Gaussian process 0.289 0.537 0.191 0.582 0.188 0.626
Feed-forward neural network 0.337 0.063 0.221 0.495 0.217 0.471
Table IV: Twitch chat example process (GP) is a nonparametric approach that learns multi-
User Content variate Gaussian distributions from given training data. We
utilized squared exponential kernel with the hyperparameters
User1 of l = 1.0, σf = 1.0, σy = 0.01. The last model is a feed-
User2 forward neural network with two densely connected layers
with the ReLU activation. The neural network was trained
User3
by stochastic gradient descent optimizer.5
User4 HE CANT LOOK AT HER IN THE EYES For comparison with the models trained on the proposed
features on spectator reactions, we trained the baseline
User5 camera shy
models using alternative popularity measures, viewer count,
User2 and chat user count, as input features, in a similar manner
User6
as suggested in previous research [21], [1]. The high corre-
lations between popularity measures allow the models to be
strong baseline though they are simple. We call the baseline
features as Volume and our features on spectator reactions
trained matrix using the skip-gram algorithm [20]. We
as Reaction.
set t=0.9 and l=10 seconds and count the fraction of
Experiments were conducted using 5-fold cross-
spam messages in a chat over chat_count.
validations and evaluated over two metrics: the average
The chat screen in Table IV shows an example rationale rooted mean squared value (RMSE) and the average
for utilizing non-textual features. This chat is by a star adjusted R-squared value (AdjR2 ). The former quantifies
streamer Ninja. Twitch chat patterns include unstructured differences between predicted and actual costs in absolute
texts and heavily used emotes. The emote showing a frowny scales, while the latter provides a normalized difference
face of Ninja is provided only to premium viewers who paid lower than 1. Compared to the regular R-squared value,
the channel subscription. This emote is hence a community- AdjR2 indicates the degree of variance on the dependent
specific meme. variable that is explained by the regression model while
further ruling out the effects by the number of predictors.
V. E XPERIMENTS For each experiment, we set the dependent variable as the
To predict the viewer count of a live stream based on log-transformed value of average view count on the entire
the proposed features on viewer reactions, we utilized six section of the stream, indicating the final popularity of each
different learning models: linear regression, lasso regression, video content.
ridge regression, random forest, Gaussian process, and feed- A. Performance based on the complete log
forward neural network.
Table III compares the prediction capability of models
Linear regression assumes a linear relationship between
trained on Volume, Reaction, and both. First, the baseline
the predictors and the dependent variable. Lasso and ridge
models show reasonable value of RMSE of 0.272-0.311 and
regressions regularize parameters of linear regression using
the AdjR2 of 0.449-0.583. The RMSE value indicates that
L1 and L2 norm, respectively. The first three models are
the predicted and actual outcome differ by an average of
simple but less prone to being overfitted, such that they
0.272 times, which is acceptable for predictions involving
play a role as good baselines. On the other hand, the last
humans. Also, the AdjR2 value larger than 0.1 is considered
three models are selected for their high performance across
prediction tasks. Random forest is an ensemble approach 5 We set the best hyper-parameters for each model using grid search (e.g., λ
combining predictions of multiple decision trees. Gaussian in Lasso=0.01, λ in Ridge=0.01, Number of trees in random forest=1,000).Figure 3: Early-stage prediction results
acceptable in predicting social dynamics, as a rule of thumb. tance that is measured by how much entropy is decreased on
Second, the six models trained on Reaction outperformed average when a variable is included in a tree. Fig 4 shows the
the Volume models, and random forest marked the smallest top-10 essential features, and the sign notation above each
error. The superior performance of our models strongly bar indicates the direction of correlation with viewer counts.
suggests that there exist certain viewer reactions that are In prediction using complete logs, 7 out of 10 most important
more likely to appear at popular Twitch streams. Third, features are textual ones, as denoted as green colored bars
a hybrid method combining Volume and Reaction features in the figure.
with baseline increases the prediction performance up to the The most predictive feature was Ngram “PepeHands”,
RMSE of 0.157 and the AdjR2 of 0.719. which is short for the famous ‘Pepe the Frog’ character
B. Early-stage prediction appearing to be crying with his hands in the air.6 It is
used in Twitch chat to signify sadness when something on
How early, then, can one predict popularity for live stream
stream is upsetting, or the streamer is sad. This sympathetic
videos? We repeatedly ran prediction models over varying
expression, written in community-specific expression, was
time windows, observing the first T=1,...,15 minutes of each
the most predictive of video popularity. Ngram “monkaS”
live stream, to forecast future popularity (of typically several
represents another such emoji, which is the same frog with
hour-long videos). Fig 3 shows the results of early-stage
a serious face. This emoji is used during a moment of high
prediction experiments. Here we only compare the perfor-
intense action that is anxiety-inducing (such as face-to-face
mance of Random forest by varying the feature set: Volume,
encounter). As these visual expressions imply, “relatable”
Reaction, and Volume+Reaction. Prediction accuracy within
emotion toward the streamer—rather than simple cheers or
the small time scale increases with larger window size,
happy mood—is a positive indicator of future popularity. It
indicated by the decreasing RMSE value. Lower bound and
is worth mentioning that these emotes with high predictive
upper bound in the figure indicate performance when the
power were not necessarily the most popularly used ones.
entire data is utilized. The experiment confirms a large gain
The top-5 emotes in terms of frequency were, TriHard (fea-
in prediction during the first ten minutes, after which point
turing a smiling face), LUL (indicating laughter), PogChamp
the prediction error starts to decrease gradually. With the
(surprised), DansGame (disgust), and cmonBruh (confusion
first 15 minutes of the log, the model already achieves a
or against racism), which are more associated with chats
reasonable RMSE of 0.2, in contrast to a lower bound of
rather than gameplay.
0.164 when the entire video length was utilized (i.e., mean
Among the non-textual features are social interactions,
video length is 267 minutes) for a hybrid approach. The
where calling other viewers (i.e., the appearance of @viewer
plots for AdjR2 show a similar trend of gradually increasing
syntax on chats) was negatively related to popularity. In con-
performance with a larger window size. However, the ranks
trast, interactions or mentions to streamers (i.e., @streamer)
of algorithms now differ in that Volume achieved better per-
were positively associated with popularity. Chat participation
formance than the other two. This gap may arise because the
ratio by loyal fans (i.e., loyal fans with at least ten messages)
AdjR2 metric normalizes the differences between predicted
was also negatively associated with popularity because inner
and actual outcomes by the number of features utilized in a
circle members cannot solely reach extreme popularity. It is
model. Volume and Reaction each use 2 and 218 features,
also likely that core community members tend to commu-
respectively, and hence may not be comparable.
nicate among themselves, and substantial participation by
C. Feature importance
6 Thereis a matching emoji for “PepeHands”, yet many spectators wrote
Then, what are the characteristics of popular Twitch the emoji name in text. Some third-party tools automatically transform
streams? To understand it, we measured the feature impor- emoji names to graphical emojis.(a) Complete observation (b) Early prediction (T=15 minutes)
Figure 4: Feature importance in the random forest regression model
such members could make newcomers reluctant to join the stitutes each live stream.
conversation, as similarly found in other online community This study analyzed the chat logs of videos by top-100
research [22]. streamers on Twitch to understand how and to what extent
A different set of features come up as the most predictive active audience participation determines the popularity of
for early-stage prediction, as shown in Fig 4(b). Now non- live streams. We set up four regression models to test the
textual features are predominant in the top-10 set, likely power of audience features from chat logs. We confirmed
because textual features like Ngram need enough logs to the potential for prediction at relatively early stages of
build up to be meaningful. The most predictive feature is live streams (i.e., 15 minutes). This finding sheds light on
chat frequency, measured by the total time duration over promising application scenarios such as recommending on-
which a user appeared in chats. A negative association air streams that are likely to be popular, which helps promote
between chat frequency and popularity suggests that popular engagement and boosts audience retention.
streams have lots of one-time commenters. This means Predicting content popularity has been studied extensively
that live viral streams engage a more substantial fraction for various applications (e.g., video [1], news article [23]).
of one-time spectators in chats than the remaining live However, to the best of our knowledge, no prior study
streams. Similar to observation based on complete log, social looked at the problem in the context of gameplay live
interaction among spectators (i.e., mentioning themselves via streaming, which is even more challenging because streams
@viewer) and the presence of loyal fans are inversely related are time-bounded (i.e., these gameplay streams need to be
to popularity. This finding implies that even at a very early recommended quickly during when they are on-air). The
stage of several hour-long live streams, popular streams can unique characteristic of the Twitch platform provides a rare
engage a broad set of audiences in chats. Active participation opportunity to delve into the live reaction of viewers for the
of the usual loyal spectators was not an indication of a super prediction. To facilitate future studies, we also contribute to
hit live stream. sharing the gathered dataset and codes for the experiments.
The current study bears several limitations. First, we only
VI. C ONCLUDING R EMARK investigated live streams of popular streamers, which is a
Game streaming services like Twitch uniquely demonstrates more challenging problem yet constrains the dataset to more
how gameplay as an entertainment genre can be inter- homogeneous settings. We did not talk about non-popular
mixed with spectatorship; its audience watches not only the live streams, which are still consumed collectively by a large
streamer but also other viewers who spectate the game. This number of audiences. We leave this personalizing problem
spectatorship is likely thanks to several unique interfaces as a future challenge for a game streaming recommendation.
such as first-person perspective live streaming, chatrooms, Second, future studies may consider more features. For
donations, specific emojis, and so on. The complex inter- example, loyal fan features could also discount for spammers
play between multiple stakeholders and components (i.e., who leave repeated messages on the channel. While we
streamer, spectators, gameplay, and platform) is what con- assumed all spectators who post multiple messages as fansin this research, future work can distinguish spammers from [10] M. Laterman, M. Arlitt, and C. Williamson, “A campus-level
typical spectators. Features related to social networks and view of Netflix and Twitch: Characterization and performance
visual content may also be used. implications,” in Proc. of the SPECTS, 2017, pp. 1–8.
Third, future studies may incorporate advanced models. [11] S. Nakandala, G. L. Ciampaglia, N. M. Su, and Y.-Y. Ahn,
A Twitch-specific embedding model could be devised to “Gendered conversation in a social game-streaming platform,”
learn the meaning of emote expressions [12]. Despite the arXiv:1611.06459, 2016.
limitation in performance, we believe that our feature-based
model has advantages over deep neural networks in terms [12] F. Barbieri, L. E. Anke, M. Ballesteros, J. Soler, and H. Sag-
gion, “Towards the understanding of gaming audiences by
of interpretability; feature-based models are intuitive as we modeling twitch emotes,” in Proceedings of the 3rd Workshop
ranked essential features in this paper. Such transparency on Noisy User-generated Text, 2017, pp. 11–20.
will be more useful in practice, such as providing rationales
for recommendations to users. Moreover, the investigation of [13] F. Haouari, E. Baccour, A. Erbad, A. Mohamed, and
crucial elements on viewer reactions can be further utilized M. Guizani, “Qoe-aware resource allocation for crowdsourced
live streaming: A machine learning approach,” arXiv preprint
for setting guidelines and informing novice streamers on arXiv:1906.09086, 2019.
everyday practices of successful live streams.
[14] L. Tang, Q. Huang, A. Puntambekar, Y. Vigfusson, W. Lloyd,
ACKNOWLEDGMENT and K. Li, “Popularity prediction of facebook videos for
This research was supported by Basic Science Research higher quality streaming,” in Proc. of the USENIX, 2017.
Program through the National Research Foundation of Korea
[15] C.-Y. Fu, J. Lee, M. Bansal, and A. Berg, “Video Highlight
(NRF) funded by the Ministry of Science and ICT (No. Prediction Using Audience Chat Reactions,” in Proc. of the
NRF-2017R1E1A1A01076400) EMNLP, 2017, pp. 972–978.
R EFERENCES [16] T. Althoff, K. Clark, and J. Leskovec, “Large-scale analysis of
[1] G. Szabo and B. A. Huberman, “Predicting the popularity of counseling conversations: An application of natural language
online content,” Communications of the ACM, vol. 53, no. 8, processing to mental health,” Transactions of the Association
pp. 80–88, 2010. for Computational Linguistics, vol. 4, p. 463, 2016.
[2] D. Gros, B. Wanner, A. Hackenholt, P. Zawadzki, and [17] K. Park, J. Kim, J. Park, M. Cha, J. Nam, S. Yoon, and
K. Knautz, “World of streaming. Motivation and gratification E. Rhim, “Mining the Minds of Customers from Online Chat
on Twitch,” in Proc. of the SCSM. Springer, 2017, pp. 44–57. Logs,” in Proc. of the CIKM, 2015, pp. 1879–1882.
[3] W. A. Hamilton, O. Garretson, and A. Kerne, “Streaming on [18] C. Hutto and E. Gilbert, “VADER: A Parsimonious Rule-
twitch: fostering participatory communities of play within live Based Model for Sentiment Analysis of Social Media Text,”
mixed media,” in Proc. of the CHI, 2014, pp. 1315–1324. in ICWSM, 2014.
[4] M. Hu, M. Zhang, and Y. Wang, “Why do audiences choose [19] K. Park, M. Cha, H. Kwak, and K.-T. Chen, “Achievement
to keep watching on live video streaming platforms? An and friends: key factors of player retention vary across player
explanation of dual identification framework,” Computers in levels in online multiplayer games,” in Proc. of the WWW
Human Behavior, vol. 75, pp. 594–606, 2017. Companion, 2017, pp. 445–453.
[5] M. Sjöblom and J. Hamari, “Why do people watch others [20] T. Mikolov, I. Sutskever, K. Chen, G. S. Corrado, and J. Dean,
play video games? An empirical study on the motivations of “Distributed representations of words and phrases and their
Twitch users,” Computers in Human Behavior, vol. 75, pp. compositionality,” in Proc. of the NIPS, 2013, pp. 3111–3119.
985–996, 2017.
[21] H. Pinto, J. M. Almeida, and M. A. Gonçalves, “Using early
[6] J. C. Tang, G. Venolia, and K. M. Inkpen, “Meerkat and view patterns to predict the popularity of youtube videos,” in
periscope: I stream, you stream, apps stream for live streams,” Proc. of the ACM WSDM, 2013, pp. 365–374.
in Proc. of the CHI, 2016, pp. 4770–4780.
[22] Y. Ren, R. Kraut, and S. Kiesler, “Applying common identity
[7] D. Recktenwald, “Toward a transcription and analysis of live and bond theory to design of online communities,” Organi-
streaming on Twitch,” Journal of Pragmatics, vol. 115, pp. zation studies, vol. 28, no. 3, pp. 377–408, 2007.
68–81, 2017.
[23] Y. Keneshloo, S. Wang, E.-H. Han, and N. Ramakrishnan,
[8] J. Seering, R. Kraut, and L. Dabbish, “Shaping pro and anti- “Predicting the popularity of news articles,” in Proc. of the
social behavior on twitch through moderation and example- SDM, 2016, pp. 441–449.
setting,” in Proc. of the CSCW, 2017, pp. 111–125.
¨
[9] M. Kaytoue, A. Silva, L. Cerf, W. Meira Jr, and C. Ra"ıssi,
“Watch me playing, i am a professional: a first study on video
game live streaming,” in Proc. of the WWW, 2012, pp. 1181–
1188.You can also read