Crowd Counting via Hierarchical Scale Recalibration Network - Ecai 2020
←
→
Page content transcription
If your browser does not render page correctly, please read the page content below
24th European Conference on Artificial Intelligence - ECAI 2020
Santiago de Compostela, Spain
Crowd Counting via Hierarchical Scale
Recalibration Network
Zhikang Zou1* and Yifan Liu1* and Shuangjie Xu2 and Wei Wei 1
and Shiping Wen 3 and Pan Zhou 1†
Abstract. The task of crowd counting is extremely challenging due
to complicated difficulties, especially the huge variation in vision
scale. Previous works tend to adopt a naive concatenation of multi-
scale information to tackle it, while the scale shifts between the fea-
ture maps are ignored. In this paper, we propose a novel Hierarchical
Scale Recalibration Network (HSRNet), which addresses the above
issues by modeling rich contextual dependencies and recalibrating
multiple scale-associated information. Specifically, a Scale Focus
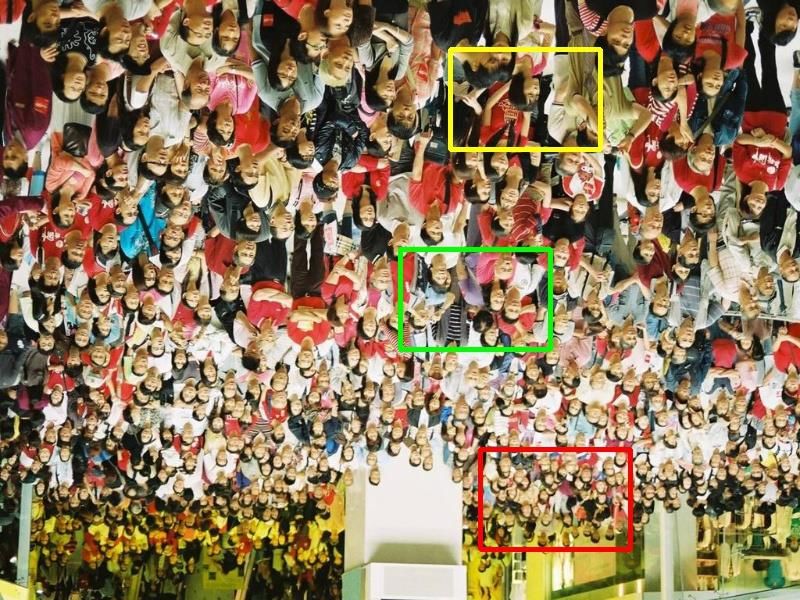
Figure 1. Regions of certain sizes exhibit diverse pedestrian distribution
Module (SFM) first integrates global context into local features by among different locations of images. This shift also exists across different
modeling the semantic inter-dependencies along channel and spatial images, which proves the huge scale variations in crowd counting.
dimensions sequentially. In order to reallocate channel-wise feature
responses, a Scale Recalibration Module (SRM) adopts a step-by-
step fusion to generate final density maps. Furthermore, we propose
a novel Scale Consistency loss to constrain that the scale-associated scale variation, substantial progress has been achieved by designing
outputs are coherent with groundtruth of different scales. With the multi-column architectures [23, 22], adaptively fusing features pyra-
proposed modules, our approach can ignore various noises selec- mid [13], and modifying the receptive fields of CNNs [17]. Although
tively and focus on appropriate crowd scales automatically. Exten- these methods alleviate the scale problem to some extent, they suf-
sive experiments on crowd counting datasets (ShanghaiTech, MALL, fer from two inherent algorithmic drawbacks. On the one hand, each
WorldEXPO’10, and UCSD) show that our HSRNet can deliver su- sub-network or each layer in these models treats every pixel of the
perior results over all state-of-the-art approaches. More remarkably, input equally while ignoring their superior particularity on the cor-
we extend experiments on an extra vehicle dataset , whose results in- responding crowd scales, thus the noises will be propagated through
dicate that the proposed model is generalized to other applications. the pipeline flow. On the other hand, directly adding or concatenat-
ing multi-scale features causes the scale chaos since each feature map
contains abundant scale shifts of different degrees.
To settle the above issues, we propose a novel Hierarchical Scale
1 Introduction Recalibration Network (HSRNet) to leverage rich contextual depen-
The task of crowd counting aims to figure out the quantity of the dencies and aggregate multiple scale-associated information. Our
pedestrians in images or videos. It has drawn much attention recently training phase contains two stages: the Scale Focus Module (SFM)
due to its broad possibilities of applications in video surveillance, and the Scale Recalibration Module (SRM). Since the receptive field
traffic control and metropolis safety. What’s more, the methods pro- sizes of the sequential convolutional layers in a deep network are in-
posed for crowd counting can be generalized to similar tasks in other creasing from shallow to deep, the scales of pedestrians they can cap-
domains, including estimating the number of cells in a microscopic ture are different from each other. This can deduce two inferences:
image [16], vehicle estimation in a traffic congestion situation [10] 1) the deeper the network flows, the wider the scale range can be
and extensive environmental investigation [9]. captured by the corresponding convolutional layers, 2) sensitivity to
With the rapid growth of convolutional neural networks, many different scales varies across different layers of the network. Thus,
CNN-based methods [18, 1, 25] have sprung up in fields of crowd we connect a Scale Focus Module (SFM) to each convolutional layer
counting and have made promising progress. However, dealing with in the backbone network, which integrates global context into lo-
the large density variations is still a difficult but attractive issue. As cal features to boost the capability of intermediate features on the
illustrated in Figure 1, the crowd density of certain sizes varies in corresponding scales. More specifically, SFM firstly compresses the
different locations of the images. Such a density shift also exists in input features in the spatial dimension and generates a set of channel-
the patches of the same sizes across different images. To address the wise focus weights, which are utilized to update each channel map.
Thus, each layer can emphasize the matching scales degree by adjust-
1 Huazhong University of Science and Technology, China. Email: zhikang- ing channel-wise feature responses adaptively. Similarly, the context
zou001@gmail.com, {u201712105,weiw,panzhou}@hust.edu.cn
2 Deeproute.ai,China. Email:shuangjiexu@deeproute.ai along the channel axis in the feature map is squeezed to generate
3 University of Electronic Science and Technology, China. Email: wenship- a spatial-wise focus mask and it is applied to update features at all
ing@uestc.edu.cn positions using element-wise multiplication. Note that this strategy
∗ Equal contributions. † Corresponding author enhances that the output features focus more on the patches of im-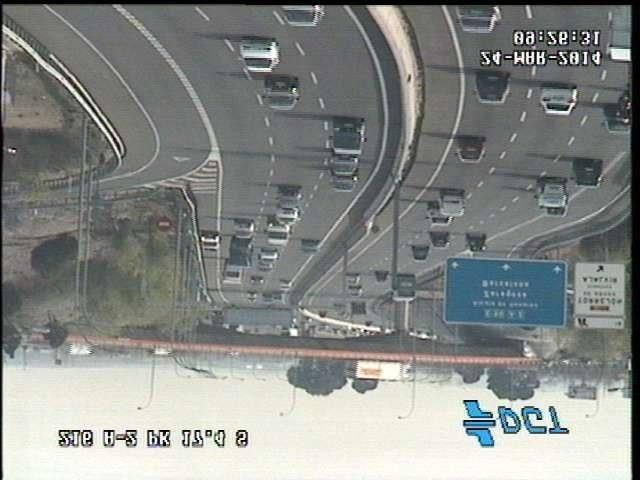
24th European Conference on Artificial Intelligence - ECAI 2020
                                                         Santiago de Compostela, Spain

ages with appropriate scales instead of treating every pixel equally.       et al. [32] propose an architecture which extracts and fuses feature
By incorporating this module in the network, intermediate layers can        maps from different layers to generate high-quality density maps.
focus on ’which’ scale degree and ’where’ scale distributes simul-          In SANet [4], Cao et al. deploy an encoder-decoder architecture, in
taneously and hence enhance the discriminant power of the feature           which the encoder part utilizes scale aggregation modules to extract
representations.                                                            multi-scale features and the decoder part generates high-resolution
   In a hierarchical architecture, the scale space is increasing from       density maps via transposed convolutions. Li et al. [17] replace pool-
shallow to deep, which means feature maps from different layers             ing layers with dilated kernels to deliver larger receptive fields, which
contain scale asymmetry. Due to this, naive average or concatena-           effectively capture more spatial information. After this, Kang et al.
tion of multiple features is not an optimal solution. We propose a          [14] design two different networks and evaluate the quality of gener-
novel Scale Recalibration Module (SRM) to further achieve adaptive          ated density maps on three crowd analysis tasks.
scale recalibration and generate multi-scale predictions at different          However, all these methods directly fuse multi-layer or multi-
stages. Specifically, this module takes the feature maps processed by       column features to generate the final density maps. It ignores the
the SFM as input and then slice these features in channel dimen-            unique perception of each part to the scale diversity and thus causes
sion. Since each channel is associated with a certain scale, the pieces     the scale chaos in the output result. Besides, attention-based meth-
represented by the corresponding scales can be recombined through           ods [11, 26] have proved their effectiveness in several deep learning
stacking to obtain scale-associated outputs. In this case, each output      tasks. These approaches work by allocating computational resources
can capture a certain scale of crowds and give an accurate predic-          towards the most relevant part of information. In this paper, we pro-
tion on the patches of that scale. We fuse these outputs to generate        pose a novel Hierarchical Scale Recalibration Network (HSRNet) to
the final density map, which could have accurate responses on crowd         resolve the severe difficulties of scale variations. Our method dif-
images of diverse scales. To enforce the network produces consistent        fers in two aspects: firstly, instead of treating the whole images, our
multi-scale density maps, we propose a Scale Consistency loss to            method is able to focus on the appropriate scale of the crowds; sec-
pose supervision on scale-associated outputs. It is computed by gen-        ondly, the scale recalibration takes place to effectively exploit the
erating multi-scale groundtruth density maps and optimizing each            specialization of the components in the whole architecture.
side output towards the corresponding scale maps.
   In general, the contributions of our work are three-folds:
• We propose a Scale Focus Module (SFM) to enhance the represen-            3   Our Approach
  tation power of local features. By modeling rich contextual depen-
  dencies among channel and spatial dimensions, different layers in
  the network can focus on the appropriate scales of pedestrians.           The primary objective of our model is to learn a mapping F : X →
• We propose a Scale Recalibration Module (SRM) to recalibrate              Y , in which X means input image data, and the learning object Y has
  and aggregate multi-scale features from sequential layers at dif-         two choices: density map or total crowd counting number. Motivated
  ferent stages. It significantly enhances the adaption ability of the      by the aforementioned observations, we choose the density map as
  structure to the complicated scenes with diverse scale variations.        the main task of our model in the training phase to involve the spatial
• We propose a Scale Consistency loss to supervise the scale-               distribution information for a better representation of crowds, which
  associated outputs at different scale level, which enforces the net-      is realizable with a network of fully convolutional structure. In this
  work produces consistent density maps with multiple scales.               paper, we propose a novel proposed Hierarchical Scale Recalibration
                                                                            Network (HSRNet) to address the scale variations in crowd count-
                                                                            ing, the overall architecture of which is shown in Figure 2. For fair
2   Related Work
                                                                            comparison with previous works [20, 17, 2], we choose VGG-16 [21]
The previous frameworks are mainly composed of two paradigms:               network as the backbone by reason of its strong representative ability
1) people detection or tracking [27], 2) feature-based regression [6].      and adjustable structure for subsequent feature fusion. The last pool-
However, these methods are generally unpractical due to their poor          ing layer and the classification part composed of fully-connected lay-
performance and high computation. As the utilization of Convolu-            ers are removed for the task of counting requires pixel-level predic-
tional Neural Network (CNN) has boosted improvements in various             tions and preventing spatial information loss. Thereby our backbone
computer vision tasks [29, 36, 3, 18], most recent works are inclined       consists of five stages (Conv1 ∼ Conv5 respectively). To focus on
to use CNN-based methods. They tend to generate accurate density            the appropriate scales of pedestrians, we connect the proposed Scale
maps whose integral indicates the total number of crowds. However,          Focus Module (SFM) to the last convolutional layer in each stage
it is still challenging to achieve precise pedestrians counting in ex-      except for the first one to obtain the fine-grained features from mul-
tremely complicated scenes for the presence of various complexities,        tiple layers. The reason why we carve the first stage is the receptive
especially scale variations.                                                field sizes of the first convolutional layers are too small to obtain any
    To tackle the above issues, many existing approaches focus on im-       information of crowds. Since the scales of pedestrians the convolu-
proving the scale variance of features using multi-column structures        tional layers can capture varies across different stages, we send these
for crowd counting [34, 23, 22, 7]. Specifically, they utilize multi-       features after the process of SFM to the Scale Recalibration Module
ple branches, each of which has its own filter size, to strengthen the      (SRM) to reallocate scale-aware responses by a slice/stack strategy.
ability of learning density variations across diverse feature resolu-       Thus each side output corresponds to a certain scale and provides an
tions. Despite the promising results, these methods are limited by          accurate crowd prediction of that scale. With the utilization of de-
two drawbacks: 1) a large amount of parameters usually results in           convolutional layer, each prediction stays the same resolution as the
difficulties for training, 2) the existence of ineffective branches leads   input image. The final density map can be generated by fusing these
to structure redundancy.                                                    scale-associated outputs. To guarantee that each scale-associated out-
    In addition to multi-column networks, some methods adopt multi-         put is optimized towards a specific direction, we propose a Scale
scale but single-column architecture [35, 37]. For instance, Zhang          Consistency loss to supervise the target learning.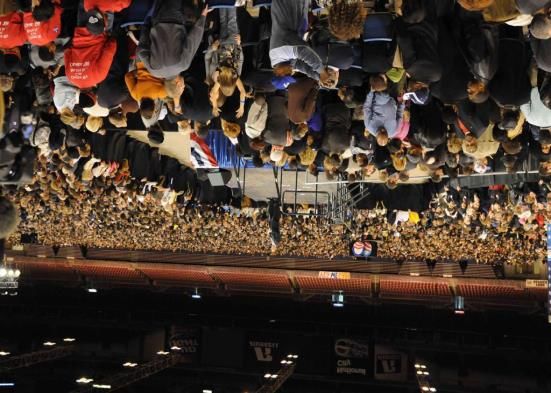
24th European Conference on Artificial Intelligence - ECAI 2020
                                                           Santiago de Compostela, Spain

                                                                                              Conv         Average pooling     Deconv     Fully connected layer

                                                                              SFM
                                                                              SFM                                                        L2
                                                                                              SRM
                                                                              SFM
                                                                              SFM                                     Final predition         Ground truth
                               Conv1 Conv2 Conv3 Conv4 Conv5
                                                                                                                                                             AP

                                                                                                                                                    L2

                               Scale Focus Module                                          Scale Recalibration Module                     Scale Consistency

 Figure 2. The detailed structure of the proposed Hierarchical Scale Recalibration Network (HSRNet). The single column baseline network on the top is
VGG-16, at the end of each convolutional layer, feature maps are sent to Scale Focus Module (SFM) to get refined feature maps. Then, the Scale Recalibration
    Module (SRM) process these features to get multi-scale predictions, which are finally fused by a 1x1 convolution to generate the final density map.

3.1    Scale Focus Module                                                       j-th channel of Fi . Such channel statistic merely collects local spatial
                                                                                information and views each channel independently, which fails to
The Scale Focus Module is designed to enforce sequential layers at              express the global context. Therefore, we add fully-connected layers
different stages focus on the appropriate scales of pedestrians by en-          and introduce a gating mechanism to further capture channel-wise
coding the global contextual information into local features. Since             dependencies. The gating mechanism is supposed to meet with two
the receptive fields of each convolutional layer are accumulating               criteria: first, it should be capable to exploit a nonlinear interaction
from shallow to deep, the scale space they are able to cope with in-            among channels; second, to emphasize multiple channels, it should
creases accordingly. Besides, there are specific shifts between their           capture a non-mutually-exclusive relationship. We use the sigmoid
representation ability on crowd scales, which indicates that different          activation to realize the gating mechanism:
stages should be responsible for the corresponding scales. With these
observations, we generate adaptive weights to emphasize feature re-                              Si = Sigmoid (W2 · ReLU (W1 Zi ))                                (2)
sponses in the channel and spatial dimension respectively.                      where W1 ∈ R         Ci /r×Ci
                                                                                                         , W2 ∈ R            Ci ×Ci /r
                                                                                                                               . This operation can be
   In channel dimension, each channel map of immediate features                 parameterized as two fully-connected (FC) layers, with one defines
can be regarded as a scale-aware response. For a high-level feature,            channel-reduction layer (reduction radio r = 64) and the other rep-
different channels are associated with each other in terms of seman-            resents channel-increasing layer. After this non-linear activation, we
tics information. By exploring the inter-channel interdependencies,             combine the channel-focus weights Si and the input feature Fi using
we could generate channel-focus weights to modify the ratio of dif-             the element-wise multiplication operation to generate the immediate
ferent channels with corresponding scales. Similar strategy for spa-            feature Ŝi .
tial dimension, treating the whole images equally is improper since                                Ŝi = Si · Fi , i ∈ {1, 2, 3, 4}                 (3)
the various crowd distribution leads to different scale space in lo-
                                                                                Thus, the global channel information is encoded into local features.
cal patches. However, local features generated merely by standard
                                                                                Then we take the mean value of Ŝi among channels to generate
convolutions are not able to express the whole semantic information.                                      1× H × W
Thus, we generate spatial-focus weights to select attentive regions             spatial statistic Mi ∈ R 2i 2i . After squeezing the information
in the feature maps, which enhances the representative capability of            among channels, we feed the spatial statistic Mi into a convolutional
features. Since the channel-focus and spatial-focus weights attend to           layer to generate a spatial-focus weight M̂i :
’which’ scale degree and ’where’ scale distributes, they are comple-                              1 XCi
mentary to each other and the combination of them could boost the                        Mi =               Ŝi , M̂i = Sigmoid(Hc (Mi ))         (4)
                                                                                                  Ci    i=1
discriminant power of the feature representations.                              where Hc indicates the convolution process. Here, the kernel size of
   Formally, given an image X of size 3 × H × W , the output                    the convolutional layer is set to 7, which is capable of providing a
features from the Conv(i+1) layer of the backbone are defined as                broader view. Then we perform an element-wise multiplication op-
F = {Fi , i = 1, 2, 3, 4}. Due to the existence of pooling layers, Fi           eration between M̂i and Ŝi to obtain the final output F̂i :
                                                              C ×H ×W
has a resolution of 2Hi × W
                          2i
                             . For the output feature Fi ∈ R i 2i 2i ,
                                                                                                       F̂i = M̂i · Ŝi , i ∈ {1, 2, 3, 4}                         (5)
we first squeeze the global spatial information to generate channel-
wise statics Zi ∈ RCi by utilizing global average pooling function              Noted that the spatial-focus weight is copied to apply on each chan-
Havg . Thus the j-th channel of Zi is defined as                                nel of the input in the same way.
                                             H   W
                                             2i X
                                                2i
                                      1      X
                                                                                3.2     Scale Recalibration Module
         Zij = Havg (Fij ) =     H        W
                                                       Fij (m, n)       (1)
                                 2i
                                      ×   2i m=1 n=1                            With the network getting deeper, deep layers can capture more com-
where Fij (m, n) represents the pixel value at position (m, n) of the           plex and high-level features while shallow layers can reserve more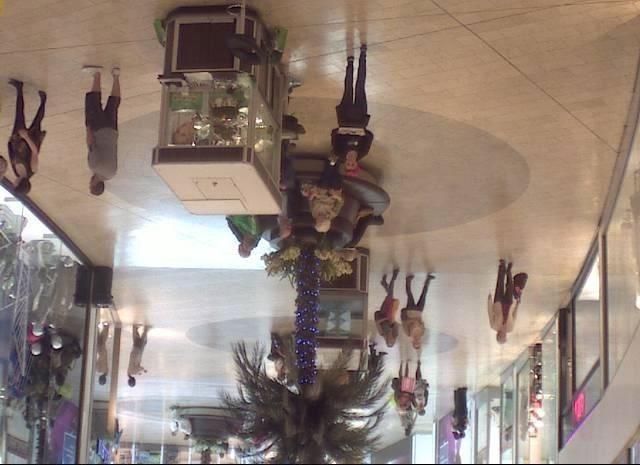
24th European Conference on Artificial Intelligence - ECAI 2020
                                                         Santiago de Compostela, Spain

spatial information. Therefore, by fusing features from low-level lay-     where θ denotes the parameters of the network and N is the amount
ers with those from high-level layers, our network can extract stable      of image pixels. Usually, this loss is merely calculated between the
features no matter how complicated the crowd scenes are. Unlike pre-       final density map and the groudtruth map. In this paper, we pro-
vious works [23, 13], We design a scale recalibration module (SRM)         pose a novel Scale Consistency loss to guide the multi-scale predic-
to recalibrate and aggregate multi-scale features rather than direct       tions to be optimized towards its corresponding scale map. Specif-
average or concatenation.                                                  ically, we use the average pooling to obtain the groundtruth pyra-
   Based on the above analysis, the deep layer has a wider range of        mid DiGT , i = 1, 2, 3, 4, 5. The receptive fields of filters are 1, 2,
scale space and meanwhile has a stronger response on the larger scale      4, 8, 16, respectively. Then these maps are upsampled to the same
of crowds. Formally, assuming that the outputs of the Scale Focus          size as the original image through a bilinear interpolation. We can
Module are F̂ = {F̂i , i = 1, 2, 3, 4}, we first send these features       compute the loss pairs {Di , DiGT } and obtain the loss pyramid
into a 1 × 1 convolutional layer and then a deconvolutional layer          {L0 , L1 , L2 , L3 , L4 , L5 }. The total loss of our model can be defined
respectively to obtain multi-scale score maps Ei ,                         as:
                                                                                             L = L0 + λi · Li , i ∈ {1, 2, 3, 4, 5}                (9)
                        Ei+1 = Hdc (Hc (F̂i ))                      (6)
                                                                           where λi is a scale-specific weight. It can be gradually optimized and
where Hdc is the deconvolution operation. Here, the channel num-           adaptively adjust the ratio between losses.
bers of the sequential layers are 2, 3, 4, 5 from E2 to E5 respec-
tively, which corresponds to the scale space contained in each stage.
The obtained multi-scale score maps Ei contain multi-scale infor-          4     Experiments
mation from layers of different depths. However, the information is
chaotic. For instance, E5 captures multi-scale information delivered       In this section, we evaluate our method on four publicly available
from Conv {1,2,3,4,5} since low-level features are transmitted to          crowd counting datasets: ShanghaiTech, WorldExpo’10, UCSD and
the latter stages in the backbone. To recalibrate channel-level statis-    MALL. Compared with previous approaches, the proposed HSRNet
tics, we adopt a slice/stack strategy. Specifically, we slice each score   achieves state-of-the-art performance. Besides, experiments on a ve-
map into piece along its channel dimension to obtain a feature map         hicle dataset TRANCOS are performed to testify the generalization
Eij where j means the channel number, and then group them into             capability of our model. Furthermore, we conduct throughout ab-
five multi-scale features sets from E2 to E5 : {E21 ,E31 ,E41 ,E51 },      lation studies to verify the effectiveness of each component in our
{E22 ,E32 ,E42 ,E52 },{E33 ,E43 ,E53 },{E44 ,E54 },{E55 }. Each set is     model. Experimental settings and results are detailed below.
associated with a certain scale and we stacked features in each set
respectively to generate the corresponding multi-scale predictions
D = {Di , i = 1, 2, 3, 4, 5}. By utilizing this strategy, each predic-     4.1    Implementation Details
tion is able to provide an accurate number of pedestrians on a certain
scale. These predictions are complementary to each other and the           Data Augmentation. We first crop four patches at four quarters of
combination of them will cover the crowd distributions with various        the image without overlapping which is 1/4 size of the original im-
scale variations. Thus we send them into a 1×1 convolutional layer to      age resolution. By this operation, our training datasets can cover the
generate the final density map D0 . Overall, the scale-specific predic-    whole images. Then, we crop 10 patches at random locations of each
tion is obtained only with convolutional layer and slice/stack strategy,   image with the same size. Also, random scaling is utilized to con-
which is parameter-saving and time-efficiency. With the Scale Recal-       struct multi-scale image pyramid with scales of 0.8-1.2 incremented
ibration Module, the final output is robust to diverse crowd scales in     in interval of 0.2 times the original image. During test, the whole
highly complicated scenes.                                                 images are fed into the network rather than cropped patches.
                                                                           Training Phase. We train the proposed HSRNet in an end-to-end
                                                                           manner. The first ten convolutional layers of our model are initialized
3.3    Scale Consistency loss                                              from the pre-trained VGG-16 [21] while the rest of convolutional
The groundtruth density map DGT can be converted from the dot              layers are initialized by a Gaussian distribution with zero mean a
maps which contain the labeled location at the center of the pedes-        standard deviation of 0.01. We use the Adam optimizer [15] with an
trian head. Suppose a pedestrian head at a pixel xi , we represent each    initial learning rate of 1e-5. In Eqn. 7, k is set to 3 and β is set to 0.3
head annotation of the image as a delta function δ(x − xi ) and blur it    following MCNN [34].
with Gaussian kernel Gσ (σ refers to the standard deviation). So that      Evaluation Metrics. Following existing state-of-the-art methods
the density map DGT is obtained via the formula below:                     [17, 22], the mean absolute error (MAE) and the mean squared er-
                                                                           ror (MSE) are used to evaluate the performance on the test dataset,
                     X
         DGT (x) =       δ(x − xi ) ∗ Gσi , with σi = β d¯i         (7)    which can be described as follows:
                      i∈S
                                                                                                               N
                                                                                                            1 X
Where S is the amount of head annotations, d¯i refers to the average                             MAE =            |zi − zˆi |,                   (10)
                                                                                                            N i=1
distance among xi and its k nearest annotations and β is a parame-
ter. We use this geometry-adaptive kernels following MCNN [34] to                                     v
                                                                                                      u    N
tackle the perspective distortion in highly complicated scenes. The                                   u1 X
Euclidean distance is utilized to define the density map loss, which                            MSE = t       (zi − zˆi )2                       (11)
                                                                                                        N i=1
can be formulated as follows:
                            N                                              where N means numbers of image, zi means the total count of the
                         1 X
               L(θ) =          ||D(Xi ; θ) − DiGT ||22              (8)    image, and zˆi refers to the total count of corresponding estimated
                        2N i=1                                             density map.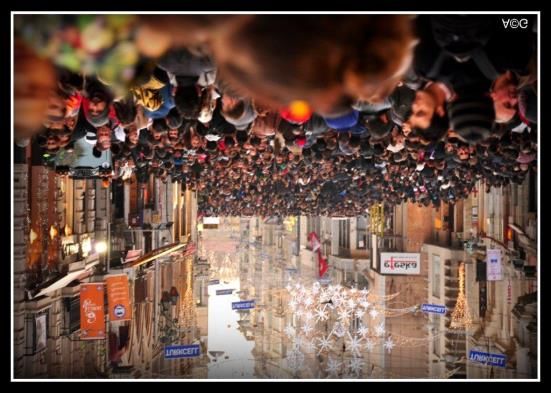
24th European Conference on Artificial Intelligence - ECAI 2020
                                                              Santiago de Compostela, Spain

          Table 1. Experimental results on ShanghaiTech dataset.                       Table 3. Estimation results on WorldExpo’10 dataset.

                           ShanghaiTech Part A    ShanghaiTech Part B                  Method           S1       S2          S3   S4     S5    Ave
          Method
                           MAE        MSE         MAE        MSE                     MCNN [34]          3.4     20.6      12.9    13.0   8.1   11.6
      MCNN [34]            110.2      173.2          26.4          41.3          Switching-CNN [20]     4.4     15.7      10.0    11.0   5.9   9.4
  Switching-CNN [20]       90.4       135.0          21.6          33.4              IG-CNN [1]         2.6     16.1     10.15    20.2   7.6   11.3
      IG-CNN[1]            72.5       118.2          13.6          21.1             CSRNet [17]         2.9     11.5      8.6     16.6   3.4   8.6
     CSRNet [17]           68.2       115.0          10.6          16.0               SANet [4]         2.6     13.2      9.0     13.3   3.0   8.2
       SANet [4]           67.0       104.5          8.4           13.6             TEDnet [12]         2.3     10.1      11.3    13.8   2.6   8.0
     TEDnet [12]           64.2       109.1          8.2           12.8               ANF [30]          2.1     10.6      15.1    9.6    3.1   8.1
      SFCN [25]            64.8       107.5          7.6           13.0            HSRNet (ours)        2.3      9.6      12.7    9.4    3.2   7.44
    HSRNet (ours)          62.3       100.3          7.2           11.8
                                                                              to compose the training set and the remaining 1,200 are considered
                                                                              as the testing set. As shown in Table 2, we beat the second best ap-
        Table 2. Experimental results on UCSD and MALL dataset.
                                                                              proach by a 14.3% improvement in MAE and 70% improvement in
                                                                              MSE.
                                     UCSD dataset       MALL dataset          WorldExpo’10. The WorldExpo’10 dataset is introduced by Zhang
                Method
                                     MAE    MSE         MAE   MSE             et al. [31], consisting of total 3980 frames extracted from 1132 video
          Ridge Regression [6]        2.25    7.82          3.59   19.0       sequences captured with 108 surveillance equipment in Shanghai
           CNN-Boosting [24]          1.10      -           2.01     -        2010 WorldExpo. Each sequence has 50 frame rates and a resolu-
               MCNN [34]              1.07    1.35          2.24    8.5       tion of 576x720 pixels. For the test set, those frames are split into
           ConvLSTM-nt [28]           1.73    3.52          2.53   11.12      five scenes, named S1 ∼ S5 respectively. Besides, the ROI (region
      Bidirectional ConvLSTM [28]     1.13    1.43          2.10    7.6       of interest) and the perspective maps are provided for this dataset.
               CSRNet [17]            1.16    1.47            -      -        Due to the abundant surveillance video data, this dataset is suitable
             HSRNet (ours)            1.03    1.32          1.80   2.28       to verify our model in visual surveillance. The comparison results
                                                                              of performance between our HSRNet with some previous methods
4.2     Performance on Comparison                                             are reported in Table 3. Overall, our model achieves the best average
                                                                              MAE performance compared with existing approaches.
We evaluate the performance of our model on four benchmark                    TRANCOS. TRANCOS dataset [10] is a vehicle counting dataset
datasets and a vehicle dataset. Overall, the proposed HSRNet                  which consists of 1244 images of various traffic scenes captured by
achieves the superior results over existing state-of-the-art methods.         real video surveillance cameras with total 46796 annotated vehicles.
ShanghaiTech. The ShanghaiTech dataset [34] consists of 1198 im-              Also, the ROI per image is provided. Images in the dataset have very
ages which contains a total amount of 330165 persons. It is separated         different traffic scenarios without perspective maps. During the train-
into two parts: the one is named as Part A with 482 pictures and the          ing period, 800 patches with the size of 115x115 pixels are randomly
other is Part B with 716 pictures. Part A composed of rather con-             cropped from each image, and the ground truth density maps are gen-
gested images is randomly captured from the web while Part B is               erated via blurring annotations with 2D Gaussian Kernel. Different
comprised of images with relatively low density captured from street          from counting dataset, we use the GAME for evaluation during the
views. Following the setup in [34], we use 300 images to form the             test period which can be formulated as follows:
training set and the left 182 images for testing in Part A, while in Part
                                                                                                                        L
B, 400 images are used to compose the training set and the remaining                                             N
                                                                                                              1 X X l
                                                                                                                     4

316 are considered as testing set. The comparison results of perfor-                      GAM E(L) =               (   |DIn − DIl gt |)           (12)
                                                                                                              N n=1               n
mance between the proposed HSRNet with some previous methods                                                           l=1

are reported in Table 1. It is shown that our model achieves superior         where N denotes the amount of images. Given a specific number
performance on both parts of the Shanghaitech dataset.                        L, the GAME(L) divides each image into 4L non-overlapping re-
UCSD. The UCSD dataset[5] contains 2000 frames with size of                   gions of equal area, DIl n is the estimated count for image n within
158x238 captured by surveillance cameras. This dataset includes rel-          region l, and DIl gt is the corresponding ground truth count. Note
                                                                                                 n
atively sparse crowds with count varying from 11 to 46 per image.             that GAME(0) equals to the aforementioned MAE metric. Results
Authors also provide the ROI to discard the irrelevant areas in the im-       shown in Table 4 indicates that HSRNet achieves the state-of-art per-
age. Utilizing the vertexes of ROI given for each scene, we modify            formance on four GAME metrics, which demonstrates the general-
the last multi-scale prediction from fusing layers based on the given         ization ability of our model.
ROI mask, setting the nerve cells out of the ROI regions not work.               Qualitatively, we visualize the density maps generated by the pro-
We use frames 601 to 1400 as the training set and the rest as testing         posed HSRNet on these five datasets in Figure 3. It is worth noting
set. Table 2 illustrates that our model achieves the lowest MAE and           that our model can generate high-quality density maps and produce
MSE compared with previous works, which indicates that HSRNet                 accurate crowd counts.
can perform well in both dense and sparse scenarios.
MALL. The Mall dataset [6] is collected from a publicly accessi-
ble surveillance web camera. The dataset contains 2,000 annotated             4.3    Ablation Study
frames of static and moving pedestrians with more challenging illu-           In this section, we conduct further experiments to explore the detail
mination conditions and severer perspective distortion compared to            of the model design and network parameters. All experiments in this
the UCSD dataset. The ROI and perspective map are also provided               section are performed on ShanghaiTech dataset for its large scale
in the dataset. Following Chen et al. [6], the first 800 frames are used      variations.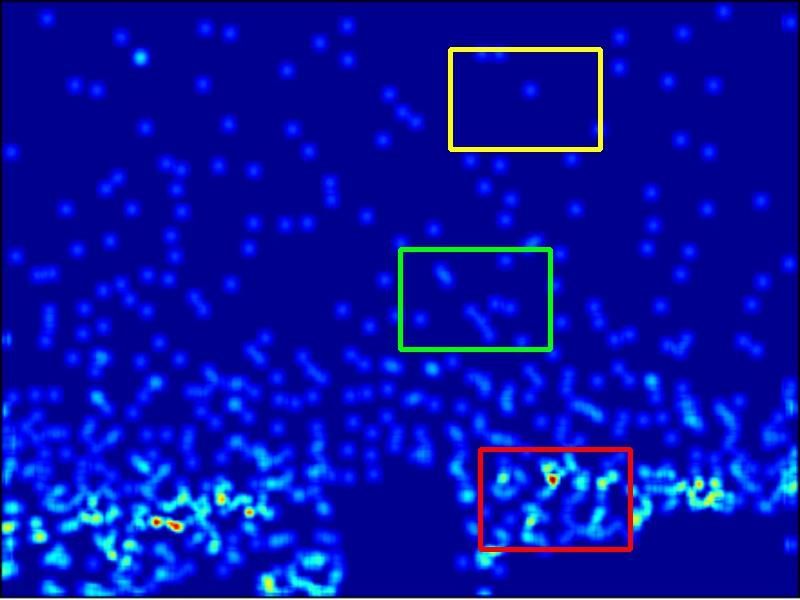
24th European Conference on Artificial Intelligence - ECAI 2020
                                                                  Santiago de Compostela, Spain

 Gt Count: 1581               Gt Count: 23                Gt Count: 28             Gt Count: 26                                     Gt Count: 23                                               Gt Count: 36

 Est Count: 1577.6            Est Count: 23.2             Est Count: 29            Est Count: 24.2                                  Est Count: 23.5                                            Est Count: 35.3

 Figure 3. From left to right, images are taken from ShanghaiTech Part A, ShanghaiTech Part B, UCSD, MALL, WorldExpo’10, TRANCOS datasets. The
             second row shows the groundtruth density maps and the third row displays the output density maps generated by our HSRNet.

                                                                                                       120                                                                    15

           Table 4.   Experimental results on the TRANCOS dataset.                                                                                                            14
                                                                                                       110
                                                                                                                                                                              13
                                                                                     Error on Part A

                                                                                                                                                            Error on Part B
                                                                                                       100                                                                    12
           Method           GAME 0              GAME 1   GAME 2           GAME 3
                                                                                                                                                                              11
                                                                                                       90
   Fiaschi et al. [8]         17.77              20.14    23.65            25.99                                                                                              10

 Lempitsky et al. [16]        13.76              16.72    20.72            24.36                       80                                                                     9

    Hydra-3s[19]              10.99              13.75    16.69            19.32                       70
                                                                                                                                                                              8

                                                                                                                 MAE                                                          7         MAE
    FCN-HA [33]               4.21                  -       -                 -                        60
                                                                                                                 MSE
                                                                                                                                                                              6
                                                                                                                                                                                        MSE

                                                                                                             2   4     8    16      32      64        128                          2       4     8       16        32    64   128
    CSRNet [17]               3.56                5.49    8.57             15.04                                           radio                                                                       radio
   HSRNet (ours)              3.03                4.57    6.46              9.68
                                                                                               Figure 4. The line chart of performance under different ratios inside the
                                                                                                     Channel Focus on ShanghaiTech Part A and Part B dataset.
Architecture learning. We first evaluate the impact of each compo-
nent in our architecture by separating all the modules and reorganiz-
ing them step by step. We perform this experiment on ShanghaiTech                   Part A and Part B of ShanghaiTech dataset when the ratio equals to
Part A dataset and the results are listed in Table 5. The backbone                  64. Therefore, this value is used for all experiments in this paper.
refers to the VGG-16 model. We add a 1 × 1 convolutional layer to
the end to generate the density map, which is defined as our base-                                Table 5. Experimental results of architecture learning on ShanghaiTech
line. It is obvious that combining backbone with the Scale Recal-                                                           Part A dataset.
ibration Module (SRM) can boost the performance (MAE 75.6 vs
                                                                                                                 Backbone          SRM           CF         SF                         SC      MAE               MSE
73.7), which verifies the effectiveness of the SRM module. We di-
vide the Scale Focus Module (SFM) into two parts: Channel Focus                                                        X           ×             ×          ×                          ×        75.6             118.7
(CF) and Spatial Focus (SF). The third row and the fourth row verify                                                   X           X             ×          ×                          ×        73.7             114.8
their respective significance (MAE 69.9,68.8 vs 73.7). Besides, the                                                    X           X             X          ×                          ×        69.9             108.9
combination of the two parts is more effective than using one of them                                                  X           X             ×          X                          ×        68.8             107.2
alone. We add the Scale Consistency loss (SC) to supervise the model                                                   X           X             X          X                          ×        65.1             104.3
learning. This strategy also brings a significant improvement to the                                                   X           X             X          X                          X        62.3             100.3
performance (MAE 65.1 vs 62.3). Overall, each part in the model is
effective and complementary to each other, which can significantly                  Sequence of SFM. We evaluate the effect of the sequence of Chan-
boost the performance on the final results.                                         nel Focus and Spatial Focus in the proposed Scale Focus Module
Ratio of Channel Focus. We measure the performance of HSRNet                        (SFM). Therefore, we design four networks which are different from
with different ratios of Channel Focus introduced in Eqn. 2. On the                 each other for the design of SFM module and experimental results are
one hand, the ratio needs to be small enough to ensure the represen-                shown in Table 6. Channel+Spatial refers to the network with Chan-
tative capability of full connections, on the other hand, if the ratio is           nel Focus module ahead Spatial Focus while Spatial+Channel refers
too small, then parameters will become more numerous and may in-                    to the opposite one. Apart from the serial settings, we also design a
troduce computational redundancy. To find a balance between capa-                   parallel one which feeds the input separately to the Channel focus
bility and computational cost, experiments are performed for a series               and Spatial focus part inside the SFM. Then we have two choices:
of ratio values. Specifically, we gradually increase the ratio at twice             the one is average their output as the final output, the other is uti-
the interval and results are shown in Figure 4. As the ratio increases,             lizing a convolution layer to process the stack of these two features.
the error estimation undergoes a process of decreasing first and then               We name these two networks as (Channel ⊕ Spatial) + average and
increasing. The proposed model delivers the best accuracy on both                   (Channel ⊕ Spatial) + Conv respectively. We conduct experiments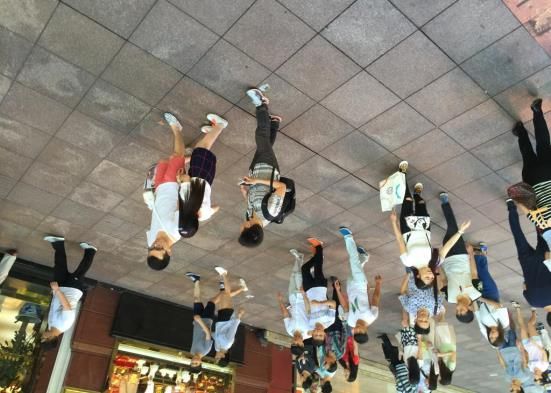
24th European Conference on Artificial Intelligence - ECAI 2020
                                                              Santiago de Compostela, Spain

                                   Original               Scale_1               Scale_2                Scale_3               Scale_4                Scale_5

             Ground Truth

              Prediction

Figure 5.   From left to right, the images pyramid contains the 1,1,1/2,1/4,1/8,1/16 size of the original image resolution. The first row indicates the groundtruth
                                    density maps while the second row is the density maps generated by the proposed HSRNet.

on ShanghaiTech Part A and Part B datasets. The results mainly il-
lustrates two aspects: 1) the stacked design of two modules are more
effective than the parallel design, 2) Channel+Spatial is the most op-
timal choice to achieve the best accuracy, which demonstrates the
validity of the model design.

Table 6.    Validation of sequences inside the proposed Scale Focus Module.

                                           Part   A            Part B
      Sequence inside the SFM
                                        MAE       MSE      MAE      MSE
          Spatial+Channel               64.9      108.3     8.1     12.1
          Channel+Spatial               62.3      100.3     7.2     11.8
    (Channel ⊕ Spatial) + average       68.8      107.2    11.0     19.8
     (Channel ⊕ Spatial) + Conv         66.2      104.3    10.2     18.9
                                                                                          Figure 6. The histogram of average counts estimated by different
Scale Consistency. To understand the effect of the Scale Consistency                      approaches on five density levels from ShanghaiTech Part A dataset.
loss more deeply, we visualization the immediate results of the pro-
posed HSRNet and compare them with the groundtruth density map
pyramid. As shown in Figure 5, the scale i represents the filter size
                                                                                    5     CONCLUSION
of the average pooling operation on the groundtruth maps. Noted                     In this paper, we propose a single column but multi-scale net-
that the scale-associated outputs are closer to their corresponding                 work named as Hierarchical Scale Recalibration Network (HSRNet),
groundtruth density maps. With the supervision of the extra Scale                   which can exploit global contextual information and aggregate multi-
Consistency loss, the responses of the immediate stages in the net-                 scale information simultaneously. The proposed HSRNet consists of
work are indeed associated with the scales of pedestrians rather than               two main parts: Stacked Focus Module (SFM) and Scale Recalibra-
stay the same with the groundtruth map. For instance, the shallow                   tion Module (SRM). Specifically, SFM models the global contex-
layers (such as Scale1 , Scale2 ) are more sensitive to the small scale             tual dependencies among channel and spatial dimensions, which con-
of pedestrians, while the deep layers (such as Scale4 , Scale5 ) per-               tributes to generating more informative feature representations. Be-
form well on the large scale of crowds. By fusing these outputs, the                sides, SRM recalibrates the feature responses generated by the SAM
final result can cover the multi-scale crowd distributions in compli-               to generate multi-scale predictions, and then utilize a scale-specific
cated scenes.                                                                       fusion strategy to aggregate scale-associated outputs to generate the
Scale Invariance. We turn to evaluate the scale invariance of the fea-              final density maps. Besides, we design a Scale Consistency loss to
ture representations from different stages in the proposed HSRNet                   enhance the learning of scale-associated outputs towards their corre-
for diverse scenes with various crowd counts. To achieve this, we di-               sponding multi-scale groundtruth density maps. With the proposed
vide the ShanghaiTech Part A test set into five groups according to                 modules combined, the network can tackle the difficulties of scale
the number of people in each scene. Each set represents a specific                  variations and generate more precise density maps in highly con-
density level. The histogram of the results can be observed in Figure               gested crowd scenes. Extensive experiments on four counting bench-
6. The increase in density level represents an increase in the aver-                mark datasets and one vehicle dataset show that our method delivers
age number of people. We compare our method with two existing                       the state-of-the-art performance over existing approaches and can be
classic representative counting networks, MCNN [34] and CSRNet                      extended to other tasks. Besides, throughout ablation studies are con-
[17]. It is obvious that MCNN performs well on the relatively sparse                ducted on ShanghaiTech dataset to validate the effectiveness of each
scenes while loses its superiority on the dense crowds. The perfor-                 part in the proposed HSRNet.
mance of the CSRNet tends to be the opposite. Noted that the pro-
posed HSRNet outperforms the two models over all groups, which
further demonstrates the scale generalization of our model on highly
complicated scenes.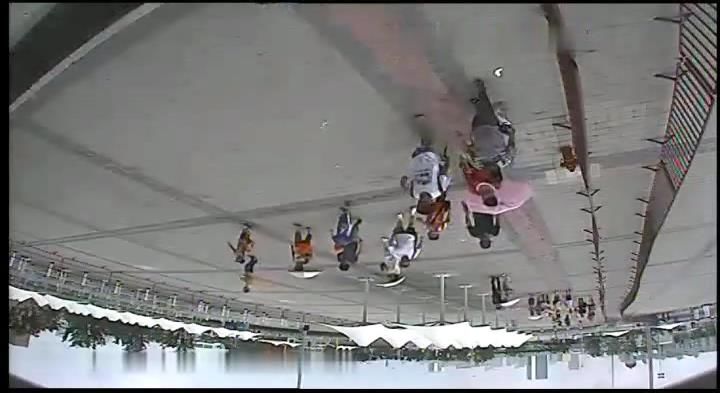
24th European Conference on Artificial Intelligence - ECAI 2020
                                                             Santiago de Compostela, Spain

REFERENCES                                                                       [20] Deepak Babu Sam, Shiv Surya, and R Venkatesh Babu, ‘Switching con-
                                                                                      volutional neural network for crowd counting’, in 2017 IEEE Confer-
                                                                                      ence on Computer Vision and Pattern Recognition (CVPR), pp. 4031–
 [1] Deepak Babu Sam, Neeraj N Sajjan, R Venkatesh Babu, and Mukund-                  4039. IEEE, (2017).
     han Srinivasan, ‘Divide and grow: Capturing huge diversity in crowd         [21] Karen Simonyan and Andrew Zisserman, ‘Very deep convolu-
     images with incrementally growing cnn’, in Proceedings of the IEEE               tional networks for large-scale image recognition’, arXiv preprint
     Conference on Computer Vision and Pattern Recognition, pp. 3618–                 arXiv:1409.1556, (2014).
     3626, (2018).                                                               [22] Vishwanath A Sindagi and Vishal M Patel, ‘Cnn-based cascaded multi-
 [2] Haoyue Bai, Song Wen, and S-H Gary Chan, ‘Crowd counting on im-                  task learning of high-level prior and density estimation for crowd count-
     ages with scale variation and isolated clusters’, in Proceedings of the          ing’, in 2017 14th IEEE International Conference on Advanced Video
     IEEE International Conference on Computer Vision Workshops, pp. 0–               and Signal Based Surveillance (AVSS), pp. 1–6. IEEE, (2017).
     0, (2019).                                                                  [23] Vishwanath A Sindagi and Vishal M Patel, ‘Generating high-quality
 [3] Karel Bartos, Michal Sofka, and Vojtech Franc, ‘Learning invariant rep-          crowd density maps using contextual pyramid cnns’, in Proceedings
     resentation for malicious network traffic detection’, in Proceedings of          of the IEEE International Conference on Computer Vision, pp. 1861–
     the Twenty-second European Conference on Artificial Intelligence, pp.            1870, (2017).
     1132–1139. IOS Press, (2016).                                               [24] Elad Walach and Lior Wolf, ‘Learning to count with cnn boosting’,
 [4] Xinkun Cao, Zhipeng Wang, Yanyun Zhao, and Fei Su, ‘Scale aggrega-               in European Conference on Computer Vision, pp. 660–676. Springer,
     tion network for accurate and efficient crowd counting’, in Proceedings          (2016).
     of the European Conference on Computer Vision (ECCV), pp. 734–750,          [25] Qi Wang, Junyu Gao, Wei Lin, and Yuan Yuan, ‘Learning from syn-
     (2018).                                                                          thetic data for crowd counting in the wild’, in Proceedings of the IEEE
 [5] Antoni B Chan, Zhang-Sheng John Liang, and Nuno Vasconcelos, ‘Pri-               Conference on Computer Vision and Pattern Recognition, pp. 8198–
     vacy preserving crowd monitoring: Counting people without people                 8207, (2019).
     models or tracking’, in 2008 IEEE Conference on Computer Vision and         [26] Sanghyun Woo, Jongchan Park, Joon-Young Lee, and In So Kweon,
     Pattern Recognition, pp. 1–7. IEEE, (2008).                                      ‘Cbam: Convolutional block attention module’, in Proceedings of the
 [6] Ke Chen, Chen Change Loy, Shaogang Gong, and Tony Xiang, ‘Feature                European Conference on Computer Vision (ECCV), pp. 3–19, (2018).
     mining for localised crowd counting.’, in BMVC, volume 1, p. 3, (2012).     [27] Bo Wu and Ramakant Nevatia, ‘Detection of multiple, partially oc-
 [7] Zhi-Qi Cheng, Jun-Xiu Li, Qi Dai, Xiao Wu, Jun-Yan He, and Alexan-               cluded humans in a single image by bayesian combination of edgelet
     der G Hauptmann, ‘Improving the learning of multi-column convolu-                part detectors’, in Tenth IEEE International Conference on Computer
     tional neural network for crowd counting’, in Proceedings of the 27th            Vision (ICCV’05) Volume 1, volume 1, pp. 90–97. IEEE, (2005).
     ACM International Conference on Multimedia, pp. 1897–1906. ACM,             [28] Feng Xiong, Xingjian Shi, and Dit-Yan Yeung, ‘Spatiotemporal mod-
     (2019).                                                                          eling for crowd counting in videos’, in Proceedings of the IEEE Inter-
 [8] Luca Fiaschi, Ullrich Köthe, Rahul Nair, and Fred A Hamprecht,                  national Conference on Computer Vision, pp. 5151–5159, (2017).
     ‘Learning to count with regression forest and structured labels’, in Pro-   [29] Mingfu Xiong, Jun Chen, Zheng Wang, Zhongyuan Wang, Ruimin Hu,
     ceedings of the 21st International Conference on Pattern Recognition             Chao Liang, and Daming Shi, ‘Person re-identification via multiple
     (ICPR2012), pp. 2685–2688. IEEE, (2012).                                         coarse-to-fine deep metrics’, in Proceedings of the Twenty-second Eu-
 [9] Geoffrey French, MH Fisher, Michal Mackiewicz, and Coby Needle,                  ropean Conference on Artificial Intelligence, pp. 355–362. IOS Press,
     ‘Convolutional neural networks for counting fish in fisheries surveil-           (2016).
     lance video’, Proceedings of the machine vision of animals and their        [30] Anran Zhang, Lei Yue, Jiayi Shen, Fan Zhu, Xiantong Zhen, Xianbin
     behaviour (MVAB), 7–1, (2015).                                                   Cao, and Ling Shao, ‘Attentional neural fields for crowd counting’, in
[10] Ricardo Guerrero-Gómez-Olmedo, Beatriz Torre-Jiménez, Roberto                  Proceedings of the IEEE International Conference on Computer Vision,
     López-Sastre, Saturnino Maldonado-Bascón, and Daniel Onoro-Rubio,              pp. 5714–5723, (2019).
     ‘Extremely overlapping vehicle counting’, in Iberian Conference on          [31] Cong Zhang, Hongsheng Li, Xiaogang Wang, and Xiaokang Yang,
     Pattern Recognition and Image Analysis, pp. 423–431. Springer,                   ‘Cross-scene crowd counting via deep convolutional neural networks’,
     (2015).                                                                          in Proceedings of the IEEE conference on computer vision and pattern
[11] J. Hu, L. Shen, and G. Sun, ‘Squeeze-and-excitation networks’, in 2018           recognition, pp. 833–841, (2015).
     IEEE/CVF Conference on Computer Vision and Pattern Recognition,             [32] Lu Zhang, Miaojing Shi, and Qiaobo Chen, ‘Crowd counting via scale-
     pp. 7132–7141, (June 2018).                                                      adaptive convolutional neural network’, in 2018 IEEE Winter Con-
[12] Xiaolong Jiang, Zehao Xiao, Baochang Zhang, Xiantong Zhen, Xian-                 ference on Applications of Computer Vision (WACV), pp. 1113–1121.
     bin Cao, David Doermann, and Ling Shao, ‘Crowd counting and den-                 IEEE, (2018).
     sity estimation by trellis encoder-decoder networks’, in Proceedings of     [33] Shanghang Zhang, Guanhang Wu, Joao P Costeira, and José MF
     the IEEE Conference on Computer Vision and Pattern Recognition, pp.              Moura, ‘Fcn-rlstm: Deep spatio-temporal neural networks for vehicle
     6133–6142, (2019).                                                               counting in city cameras’, in Proceedings of the IEEE International
[13] Di Kang and Antoni Chan, ‘Crowd counting by adaptively fusing pre-               Conference on Computer Vision, pp. 3667–3676, (2017).
     dictions from an image pyramid’, arXiv preprint arXiv:1805.06115,           [34] Y. Zhang, D. Zhou, S. Chen, S. Gao, and Y. Ma, ‘Single-image
     (2018).                                                                          crowd counting via multi-column convolutional neural network’, in
[14] Di Kang, Zheng Ma, and Antoni B Chan, ‘Beyond counting: Compar-                  2016 IEEE Conference on Computer Vision and Pattern Recognition
     isons of density maps for crowd analysis tasks—counting, detection,              (CVPR), pp. 589–597, (June 2016).
     and tracking’, IEEE Transactions on Circuits and Systems for Video          [35] Z. Zou, X. Su, X. Qu, and P. Zhou, ‘Da-net: Learning the fine-grained
     Technology, 29(5), 1408–1422, (2018).                                            density distribution with deformation aggregation network’, IEEE Ac-
[15] Diederik P Kingma and Jimmy Ba, ‘Adam: A method for stochastic                   cess, 6, 60745–60756, (2018).
     optimization’, arXiv preprint arXiv:1412.6980, (2014).                      [36] Zhikang Zou, Yu Cheng, Xiaoye Qu, Shouling Ji, Xiaoxiao Guo, and
[16] Victor Lempitsky and Andrew Zisserman, ‘Learning to count objects                Pan Zhou, ‘Attend to count: Crowd counting with adaptive capacity
     in images’, in Advances in neural information processing systems, pp.            multi-scale cnns’, Neurocomputing, 367, 75–83, (2019).
     1324–1332, (2010).                                                          [37] Zhikang Zou, Huiliang Shao, Xiaoye Qu, Wei Wei, and Pan Zhou, ‘En-
[17] Yuhong Li, Xiaofan Zhang, and Deming Chen, ‘Csrnet: Dilated con-                 hanced 3d convolutional networks for crowd counting’, arXiv preprint
     volutional neural networks for understanding the highly congested                arXiv:1908.04121, (2019).
     scenes’, in Proceedings of the IEEE conference on computer vision and
     pattern recognition, pp. 1091–1100, (2018).
[18] Xialei Liu, Joost van de Weijer, and Andrew D Bagdanov, ‘Leveraging
     unlabeled data for crowd counting by learning to rank’, in Proceedings
     of the IEEE Conference on Computer Vision and Pattern Recognition,
     pp. 7661–7669, (2018).
[19] Daniel Onoro-Rubio and Roberto J López-Sastre, ‘Towards
     perspective-free object counting with deep learning’, in European
     Conference on Computer Vision, pp. 615–629. Springer, (2016).
You can also read