Ten Fallacies of the Thrive MSP 2040 Plan - Faulty Assumptions are Leading to an Unsustainable Long-Term Plan for the Twin Cities Region
←
→
Page content transcription
If your browser does not render page correctly, please read the page content below

Ten Fallacies of the Thrive MSP 2040 Plan
Faulty Assumptions are Leading to an Unsustainable
Long-Term Plan for the Twin Cities Region

                           By Randal O’Toole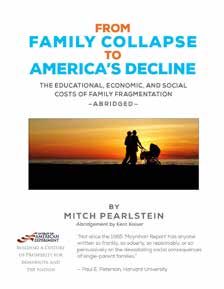
Center of the American Experiment is a nonpartisan, tax-exempt,
public policy and educational institution that brings conservative
 and free market ideas to bear on the hardest problems facing
                   Minnesota and the nation.
APril                       2014

              Ten Fallacies of the Thrive Plan
                              by Randal O’Toole, Cato Institute

                                           Introduction
The Twin Cities Metropolitan Council has                  and using tax-increment financing and other
published a “draft for public review and comment”         subsidies to persuade developers to build housing
of the “Thrive MSP 2040” plan, which will serve           that would otherwise be difficult to market;
as the “regional plan for sustainable development”    n   Discouraging driving by increasing traffic
for the seven-county metro area. While the draft          congestion in the region;
uses vague terms and generalities, it is clear that
upcoming housing, transportation, and other sub-
                                                      n   Subsidizing expensive alternatives to driving
plans will seek to dramatically alter Minnesota           such as rail transit; and
lifestyles. This includes forcing more people to      n   Diverting gas taxes and other highway funds to
live in multifamily housing and reducing personal         projects that actually reduce roadway capacities
mobility, all in the name of “sustainability.”            such as converting general-purpose lanes to
                                                          dedicated bike lanes.
This plan was partly funded by a $5 million
“sustainable communities” grant from the              The draft plan does not spell out all of these
Department of Housing and Urban Development.          features. Instead, it relies on euphemisms that are
Plans funded by similar grants written by other       used throughout the planning profession to mean
metropolitan planning organizations provide a         these things.
preview of what the details of the Thrive plan and
its sub-plans will look like. The draft Thrive plan   The Metropolitan Council argues that the Thrive
also has many hints about planners’ intentions        plan will make the Twin Cities more prosperous
buried within it.                                     and more sustainable. But a careful review of
                                                      transportation and housing data reveal that the
Based on this information, the Thrive plan and its    plan will be far from sustainable by any definition
subplans will call for:                               of the term. Moreover, the huge subsidies required
n   Increasing the cost of single-family homes        to implement the plan will reduce the region’s
    by limiting the amount of land available for      prosperity and its competitiveness with other
    development inside the municipal urban service    regions.
    area and through restrictive zoning within that
    area;                                             The Thrive plan contains numerous implicit or
                                                      explicit assumptions that are little better than
n   Promoting and subsidizing multifamily housing     myths and fallacies. This paper will address the
    by rezoning neighborhoods to higher densities     most important of these fallacies.

                                                                   Center of the American Experiment          1
Fallacy #1: Government action is                         a target of reducing the share of households living
                                                              in single-family homes from 68 percent in 1995 to
     needed to provide affordable housing.                    41 percent in 2040.2
     The Thrive plan’s stress on affordable housing is
                                                              This range of policies is reflected in the affordability
     based on an assumption that government programs
                                                              of housing in each state or region. A standard
     can make housing more affordable. In fact, the
                                                              measure of housing affordability is median home
     most affordable housing in the nation is in the
                                                              value divided by median family income, or value-
     states and regions that have the least government
                                                              to-income ratio.3 In 1969, when only Hawaii was
     involvement in land and housing markets.
                                                              engaged in restrictive land-use regulation, the
                                                              value-to-income ratio was about 2 everywhere in
     The nation’s least affordable housing is in states
                                                              the United States except Hawaii, where it was more
     like California and Hawaii, which have the nation’s
                                                              than 3. It was 2.2 in the San Francisco Bay Area,
     most heavily regulated land and housing markets.
                                                              1.8 in Seattle and the Twin Cities, 1.6 in Portland,
     Housing isn’t expensive in these areas due to land
                                                              and 1.4 in Indianapolis.4
     shortages: only 6 percent of the state of Hawaii, 36
     percent of the island of Oahu, and 17 percent of
                                                              By 2006, when about fifteen states were practicing
     the nine-county San Francisco Bay Area have been
                                                              some form of statewide land-use regulation, value-
     urbanized. But strict urban-growth boundaries have
                                                              to-income ratios in those states ranged from 3 to 9,
     prevented private property owners from using their
                                                              while they were still around 2 in most states that
     lands for their highest and best uses.
                                                              had no statewide regulation. For example, median

    “ ”
                                                              home values were more than 8 times median
         In fact, the most affordable                         family incomes in the San Francisco Bay Area
                                                              and Hawaii. The emphasis on multifamily housing
    housing in the nation is in the                           had only partially mitigated the effect on housing
                                                              affordability in Portland and Seattle, where values
    states and regions that have the                          were around 5 times incomes. Minnesota doesn’t
    least government involvement                              have statewide land-use regulation, but regulation

                                           “ ”
                                                              by the Metropolitan Council had driven Twin
    in land and housing markets.                              Cities value-to-income ratios to well above 3. In
                                                              unregulated areas such as Texas and Indiana, value-
                                                              to-income ratios never rose above 2.2.5
     At the other extreme, the nation’s most affordable
     housing is in states such as Texas, where counties
                                                              Twin Cities value-to-income ratios have fallen to
     aren’t even allowed to zone, and Indiana, where
                                                              about 2.5 today, but still remain well above those
     counties have the option to zone but not all counties
                                                              in less-regulated regions.6 According to Coldwell-
     exercise that option. Despite lack of regulation,
                                                              Banker, a four-bedroom, two-and-one-half-bath,
     urban “sprawl” is not threatening farms, forests, or
                                                              2,200-square-foot home in Minneapolis was worth
     open spaces in these states: only 6 percent of Indiana
                                                              about $595,000 in 2013. In St. Paul, that same
     and just 3 percent of Texas have been urbanized.1
                                                              home would have sold for about $476,000, while
                                                              in Bloomington it was $427,000. Meanwhile, that
     Midway between California/Hawaii and Texas
                                                              same home in Houston cost only $191,000, and in
     are Oregon and Washington, which require all
                                                              Indianapolis it was $187,000.7
     or (in Washington’s case) most cities to draw
     urban-growth boundaries. Unlike California and
                                                              A company considering whether to locate new
     Hawaii, planners in these states are attempting to
                                                              employment centers in the Twin Cities vs.
     accommodate population growth by emphasizing
                                                              Indianapolis or Houston would have to consider the
     multifamily housing. For example, Portland has set

2       Ten Fallacies of the Thrive Plan
extra money it would need to pay its workers so that for housing to be expensive or housing prices
they could afford the Twin Cities’ higher housing to be volatile are shortages of land or land-use
costs. Minneapolis-St. Paul home prices and value- regulation that prevents builders from using that
to-income ratios are almost certain to rise under the land. Minnesota has an abundance of land. The
Thrive plan, even if the plan attempts to emphasize 2010 census found that only 2.1 percent of the state
multifamily housing over single-family housing, has been urbanized.8 Even counting all rural roads,
which surveys show most Americans prefer. railroads, and developments larger than a quarter-
acre in size, the U.S. Department of Agriculture’s
Government regulation not only tends to make 2007 National Resources Inventory found that less
housing less affordable, it makes housing prices than 4.5 percent of the state has been developed.9
more volatile, thus increasing the risk that
homeowners will lose money on their investments. Yet Figure 1 shows that Twin Cities housing prices
This is because regulation makes it more difficult have been excessively volatile over the past decade.
for builders to respond to changes in demand. In This is due to the Metropolitan Council’s municipal
much of Texas, for example, someone can buy land, urban service area that limits the ability of
get all required permits, build a house, and move homebuilders to respond to fluctuating demands for
in within 120 days of purchasing the land. When housing. When demand goes up, some homebuyers
demand increases, builders simply build more are forced to buy in distant towns and commute
homes. Regulation can greatly lengthen the time many miles to work. But this is expensive, so the
required to get permits and build, so when demand increase in demand results in higher prices in the
increases, prices increase rather than supply. When Twin Cities.
demand falls, prices similarly fall rather than being
expressed by slower rates of home construction. After making housing increasingly unaffordable and
risky through land-use regulation, planners then
Since transportation of labor and construction propose to provide subsidized, affordable housing
materials is relatively inexpensive, the only reasons for a few low- and moderate-income families. This
Figure 1: Metro Area Home Price Indices
250
1995 = 100, inflation adjusted
200
150
100
50
0
1995 1997 1999 2001 2003 2005 2007 2009 2011
Columbus Houston Indianapolis Minneapolis San Francisco Seattle
Thanks to the Metropolitan Council’s land-use regulation, home prices in the Twin Cities are nearly
as volatile as they are in San Francisco and Seattle, and far more than in relatively unregulated
regions such as Columbus, Houston, and Indianapolis. Source: “Home Price Indices,” Federal
Housing Finance Agency.
Center of the American Experiment 3is what the Thrive plan proposes. But it would be A second issue is that multifamily homes are often
far more equitable for the Metropolitan Council to built near regional and town centers where there
reduce its land-use regulation and make housing is a lot of competition for land. The higher land
more affordable for everyone than to provide costs translate into higher housing costs. If the
affordable housing for a few at everyone else’s Thrive plan calls for more multifamily housing in
expense. transit corridors and near rail transit stations, it is
advocating for less-affordable housing.
Fallacy #2: Multifamily housing is
Add to this the costs of artificial land shortages
more affordable. created by urban-growth or urban-service
boundaries, and multifamily housing in areas with
In the Thrive plan, the Council says “the region strict land-use regulation can be far less affordable
needs to offer housing options that give people in than single-family housing in areas with little
all life stages and of all economic means viable regulation. An 800-square-foot condominium in
choices for safe, stable and affordable homes” (p. the San Francisco Bay Area can easily cost twice as
22). Housing options is a euphemism for multifamily much as a 2,200-square-foot single-family home in
housing and is based on an assumption that Houston or another Texas urban area.11
multifamily housing is less expensive than single-
family homes. In short, the way to create more affordable housing
“ ”
is to reduce land-use regulation, not construct more
multifamily housing. With reduced regulation,
In fact, multifamily homes people who want to live in multifamily homes can
cost more, per square foot, than choose to do so, but most people who want less-
“ ”
expensive homes will choose to buy smaller single-
single-family homes. family homes.
The Thrive document goes on to say that the
This assumption is valid only if it is also assumed Council will “invest in affordable housing
that multifamily dwellings are significantly smaller construction and preservation in higher-income
than single-family homes. In other words, what areas of the region” (p. 22). This means that
saves money is that the dwellings are smaller, not relatively wealthy neighborhoods of single-family
that they are multifamily. homes will be deemed to have “unaffordable
housing” and to remedy that the Council will
In fact, multifamily homes cost more, per square mandate the construction of multifamily housing
foot, than single-family homes for several reasons. in those neighborhoods.
First, construction costs of multifamily housing are
higher if the dwellings are more than two stories This pattern follows recent Housing and Urban
tall. A 1997 study in Portland, Oregon, found Development (HUD) proposals and actions
that two-story multifamily homes cost less, per requiring other communities in the nation to force
square foot, than single-family homes, but three- construction of multifamily housing in single-
and more-story multifamily homes cost more. On family neighborhoods. HUD’s “affirmatively
average, multifamily homes cost $91 per square foot furthering fair housing” rules would measure every
vs. $74 for single-family.10 Housing in mixed-use community’s racial and ethnic mix, and if it wasn’t
developments costs even more per square foot. If the mixed enough, would mandate the construction of
Metropolitan Council wants to see more mid-rise, “affordable” (meaning multifamily) housing in the
mixed-use developments, it is actually advocating community.12 HUD has already successfully sued
for less-affordable housing. Garden City, New Jersey, a suburb of New York
4 Ten Fallacies of the Thrive PlanCity, requiring the city to rezone for multifamily Energy says that, on a per-square-foot basis, single-
housing because single-family zoning supposedly family homes use 29 percent less energy than multi-
kept racial minorities out of the community.13 family homes.15 This counts only the energy costs
of operation, but the energy costs of constructing
The San Francisco Bay Area recently approved mid-rise and high-rise housing are also far greater,
a plan that, like the Thrive plan, was funded by per square foot, than for single-family homes.
a federal sustainable communities grant. Using
language that is almost identical to the Thrive If the goal is to save energy, then it is far more cost-
plan, the Bay Area plan requires that 80 percent effective to house more people in single-family
“ ”
of all new housing in that region be multifamily
housing.14 This will reduce the share of residents
living in single-family homes from 56 percent today The Department of Energy
to less than 48 percent by 2040.
says that, on a per-square-foot
The Thrive plan goes on to require “a mix of housing basis, single-family homes use
affordability along the region’s transit corridors”
29 percent less energy than
“ ”
(page 23). This means the Council wants to
subsidize the construction of high-density housing
along those transit corridors. This was a major focus
multi-family homes.
of the Bay Area plan, which targeted more than
200 neighborhoods along transit corridors for high- homes and to make those homes more energy
density development. But, as noted, high-density, efficient than they already are than to house people
mid-rise housing in regional and town centers in energy-inefficient multi-family homes and save
will actually be more expensive than single-family energy by making people live in smaller dwellings.
homes away from those centers.
What the Thrive plan appears to advocate, then,
Fallacy #4: Racial and ethnic
is that people live in smaller, lower-quality housing minorities prefer multifamily over
than they have in the past, with less privacy and single-family housing.
more noise than is found in typical single-family
neighborhoods. If the strategy is to make housing Though the Thrive plan doesn’t explicitly say so,
more affordable by building smaller housing units, the assumption that building more multifamily
there is no reason why it can’t be achieved with housing will somehow lead to housing equity for
smaller single-family homes. In fact, planners’ real racial minorities contains the implicit (and racist)
goal is to increase urban densities, and they merely assumption that minorities prefer multifamily
use the affordability issue as a cover for that goal. housing. This assumption was explicitly stated in
the Bay Area plan, which said that Asians and
Latinos “have demonstrated an historic preference
Fallacy #3: Multi-family housing is for multi-family housing,” and that the fact that
more sustainable. these ethnic groups are growing faster than non-
Hispanic whites “is expected to drive higher
Another implicit assumption behind the push for demand for multifamily housing.”16
multifamily housing is that it uses less energy (and
therefore is responsible for less pollution) than The reality, of course, is that the “historic preference
single-family housing. Once again, this is only true for multifamily housing” is income-related, and as
because multi-family dwellings are much smaller incomes rise the majority of all ethnic, racial, and
than single-family homes. The Department of age groups aspire to live in single-family homes.
Center of the American Experiment 5Fallacy #5: Transit is an effective prioritizing transportation investments “that
connect lower-income areas to job opportunities”
alternative to driving. (page 22). This is a euphemism for spending an
even greater share of the region’s resources on public
Transit carries less than 1.5 percent of the motorized
transit. Yet “transit is not a reasonable substitute
passenger miles in the Twin Cities region.17 Yet the
for the private vehicle for most people, poor or
Thrive plan places an undue emphasis on transit as
not poor,” says University of Southern California
a solution to any urban problem. While automobiles
planning professor Genevieve Giuliano. “In most
offer door-to-door convenience, transit is slow and
circumstances, private vehicle access is the key to
inconvenient. Given that research has found a
improved mobility for the poor.”20
strong positive correlation between commuting
speeds and worker productivity, asking people to
take transit rather than drive is the same as asking Fallacy #6: Transit is more
them to accept lower pay.18 sustainable than driving.
Transit advocates often point to European cities, An implicit assumption behind the emphasis on
which typically spend far more money subsidizing transit is that transit uses less energy than driving.
transit than American cities. Europeans drive less That may have been true in 1970, but since then
than Americans, but they don’t make up for it by cars have become far more energy efficient, while
riding transit. Instead, they simply travel less, which transit has actually gotten less energy efficient.21 At
makes them less productive and means that a wide average occupancies, the average car on the road
variety of social opportunities are less available and uses about 3,364 British Thermal Units (BTUs)
consumer goods are more expensive. per passenger mile.22 Meanwhile, the Twin Cities
Metro transit system uses an average of 3,479 BTUs
According to the European Union, the average per passenger mile.23
American travels about 15,000 miles per year by
car compared with less than 6,000 miles per year for
the average European. American travel by urban
transit and intercity rail totals less than 700 miles Figure 2: Energy Intensity of Passenger Transport
per person per year, compared with 1,300 miles per 7,000
year for the average European.19 This extra 600
miles of travel doesn’t come close to making up for 6,000 Light Trucks
BTUs Per Passenger Mile
more than 9,000 miles of lost auto travel. 5,000
Passenger cars
4,000
Europeans don’t drive less than Americans because
European nations are smaller: with open borders, Bus transit
3,000
Europe, at 3.9 million square miles, is actually Rail transit
2,000
slightly larger than the United States, at 3.7 million
square miles. Besides, the nation with the second- 1,000
highest amount of per capita driving in the world
0
is Iceland, which is less than 40,000 square miles. 1970 1975 1980 1985 1990 1995 2000 2005 2010
Differences in auto travel between Europe and the
United States are due more to high fuel taxes than
to land area, population densities, urban design, or In 1970, cars were gas guzzlers and transit was
energy efficient. Since then, cars have become
transit systems.
far more energy efficient while transit has
gotten less so. Source: Department of Energy,
Noting that some low-income households do Transportation Energy Data Book.
not own automobiles, the Thrive plan calls for
6 Ten Fallacies of the Thrive PlanMoreover, as shown in Figure 2, the energy
efficiency of cars is growing far faster than that of Figure 3: Costs & Subsidies Per Passenger Mile
transit. By 2025, the average car on the road will 200
use only about 2,400 BTUs per passenger mile.24 180
Pennies Per Passenger Mile
Meanwhile, transit technologies, particularly for 160
rail transit, improve only very slowly.25 140
120
Environmental impact statements (EISs) for 100
both the Central Corridor and Southwest LRT 80
60
projects reveal neither project should be relied
40
on to reduce energy use in the Twin Cities. In
20
fact, the Central Corridor’s Final EIS estimates 0
“[t]he additional energy used by [Central Corridor] Auto Driving Metro Bus Hiawatha Northstar
LRT is greater than the energy saved by replacing Subsidy User Fee
passenger vehicles.”26 Reductions in energy used by
passenger vehicles only offset about 25 percent of Transit fares are competitive with auto driving,
the additional energy required by LRT. but only because taxpayer subsidies to transit
are huge. On average, subsidies to Twin Cities
transit are 88 times more than subsidies to
The proposed Southwest LRT project does
driving. Source: See text.
better and is estimated to “slightly lower energy
consumption.”27 But it is maybe too slight to
Transit fares are competitive with the cost of driving.
measure. The Draft EIS admits the “the differences
But subsidies to transit are far greater per passenger
between the alternatives may not be statistically
mile. In 2011, the average fare paid by Twin Cities
significant.”28 Considering this trivial and possibly
transit riders was 25 cents per passenger mile. But
statistically insignificant improvement, Southwest
transit operations cost 79 cents per passenger mile.
LRT does not offer a dependable strategy to increase
Maintenance and capital costs added another
energy efficiency.
33 cents a passenger mile, for total subsidies of 88
cents per passenger mile, or more than 88 times
Fallacy #7: Transit is more the subsidies to highways, roads, and streets.33 Twin
affordable than driving. Cities residents travel nearly 40 billion passenger
miles per year by automobile; shifting that travel
Partly because transit is inherently inefficient and to transit would require subsidies of $35 billion per
partly because government operations make it even year.34
more inefficient, transit is far more expensive than
driving. Americans spend about a trillion dollars Fallacy #8: Improving transit is the
a year on purchasing, maintaining, operating, and
best way to provide low-income
insuring automobiles, including paying gas taxes,
tolls, and other highway user fees.29 They drive people with access to jobs.
2.6 trillion vehicle miles per year in cars and light
trucks.30 At average occupancies of 1.67 people per The Thrive plan notes that many low-income
car, they spend about 24 cents per passenger mile on households lack automobiles and strongly implies
auto travel.31 In 2011, subsidies to highways, roads, that improving transit is a good way of helping those
and streets paid out of sales taxes, property taxes, households. It specifically states that “households
or other general funds, mostly for city and county who do not own private automobiles [are] also
roads and streets, amounted to about $38 billion, or known as ‘transit dependen[t]’” (p. 22).
less than a penny per passenger mile.32
Center of the American Experiment 7Census data reveal that less than 2.8 percent of which is growing twice as fast as the Twin Cities. The
Twin Cities workers live in households that lack second-fastest growing area is Columbus (Figure 4).
automobiles. Moreover, 26 percent of those workers Neither Indianapolis nor Columbus have municipal
nevertheless drive alone to work, and 11 percent urban service areas or spend heavily on expensive
carpool. Since only 36 percent take transit to work, transit programs. Numerically, the fastest-growing
that means they actually rely more on automobiles urban area in the country is Houston, which not
than transit.35 coincidentally also has the least land-use regulation
of any urban area in the United States.
If the goal is to help poor people out of poverty,
giving them access to a car is far more likely Overall, transit spending and land-use regulation
to succeed than improving public transit. “Car are both strongly correlated with slower growth.
ownership is a significant factor in improving Transit capital spending during the 1990s has a
the employment status of welfare recipients,” say strong negative correlation with population growth
UCLA planners Paul Ong and Ellen Blumenberg.36 in the 2000s. Transit operational spending in the
One Portland study found that people without a 1990s and 2000s has strong negative correlations
high-school diploma were 80 percent more likely with population growth in the same or succeeding
to have a job and earned $1,100 more per month if decades. These strong correlations hold whether
they had a car. In fact, the study found that owning measured by the nation’s 50 largest urbanized areas
a car was more helpful to getting a job than getting or the nation’s 160 largest urbanized areas.41
a high-school-equivalent degree.37 Another study
by University of California researchers found that
closing the black-white auto ownership gap would Figure 4: Population Growth by Urbanized Area
close nearly half the black-white employment gap.38 35
30
Auto ownership is so important to helping people
out of poverty that welfare agencies in more than 25
50 urban areas in 25 states started “ways-to-work” 20
Percent
programs that help low-income people buy their
15
first cars.39 These programs offer people low-interest
loans of up to $4,000 to buy a used car or smaller 10
loans to help people repair a non-working car they 5
already own.
0
Indianapolis Columbus Minneapolis-St. Paul
Fallacy #9: Subsidizing transit and 1990-2000 2000-2010
multifamily housing will make the
region more competitive. The Indianapolis urbanized area has been
growing more than twice as fast, and Columbus
nearly twice as fast, as the Twin Cities urbanized
A major selling point for the Thrive plan is that it area. Source: Census Bureau, 1990, 2000, and
will help the Twin Cities region be more competitive 2010 censuses.
with other urban areas. In fact, the reverse appears
to be true: those urban areas that spend the least Similarly, growth is also strongly correlated with
effort meddling with land uses and subsidizing land-use regulation. The most heavily regulated
public transit are the ones that are growing the states and regions, such as California and Hawaii,
fastest.40 are growing slowest; the least heavily regulated,
such as Texas and North Carolina, are growing
On a percentage basis, the fastest-growing urban fastest; and areas of moderate regulation, such as
area in the Midwest, for example, is Indianapolis, Minnesota, have moderate growth rates.
8 Ten Fallacies of the Thrive PlanFallacy #10: Dense development per square mile. The share of commuters driving
to work in the densest area was only 9 percent less
reduces driving. than the least-dense area (Figure 5). While some
urbanized areas do have significantly lower rates
The most important fallacy underlying the Thrive
of auto commuting, the graph reveals that this
plan is the assumption that denser development,
is independent of density. In fact, the two most
especially along transit corridors, can significantly
important factors are having a large number of jobs
reduce driving and thus (if you believe Fallacy
concentrated in one place, such as Manhattan, or
#6) make the region more sustainable. Planners
having a lot of young people in the work force.
often point to studies showing that households in
Most of the urbanized areas with low rates of auto
high-density areas drive less than households in
commuting are college towns, such as Ithaca, Davis,
low-density areas. However, these studies almost
Boulder, and State College, Pennsylvania, or urban
invariably fail to account for self-selection, that
areas with large, older downtowns, such as New
is, that people who want to drive less tend to
York, Boston, San Francisco, and Washington, D.C.
choose to live in denser neighborhoods where they
can be close to transit, shops, and other services.
Like the Thrive plan, the Bay Area plan counted on
After correcting for self-selection, University of
increased densities as a way to reduce driving. Yet
California (Irvine) economist David Brownstone
the plan itself projected that densification, transit
concluded that the effects of density and urban
improvements, and transit-oriented developments
form on driving are “too small to be useful” in
in transit corridors would reduce per capita driving
saving energy or reducing pollution.42
by less than 6 percent.43 Even that is almost certainly
optimistic. Since 1980, the population density of
Census data reveal this small but measureable
the San Francisco–Oakland and San Jose urbanized
relationship between density and driving. In 2010,
areas have each grown by more than 55 percent,
the density of the 413 urbanized areas greater than
and the region has built more than 200 miles of
50,000 people ranged from 811 to 6,999 people
Figure 5: Urbanized Area Density vs. Auto Commuting in 2010
100%
Hickory, NC
Share of Commuters Who Get to Work by Car
90%
Los Angeles, CA
80% Boston, MA
Washington, DC San Fransisco, CA
Iowa City, IA Champaign, IL
Corvallis, OR
70% Boulder, CO
Minneapolis - St. Paul, MN State College, PA Davis, CA
60% New York, NY
Ithaca, NY
50%
40%
30%
20%
10%
0%
0 1,000 2,000 3,000 4,000 5,000 6,000 7,000
Population Per Square Mile
The density of an urban area has a measureable but small effect on the share of people who
commute to work by car. Source: 2010 census.
Center of the American Experiment 9new rail transit lines and scores of transit-oriented References
developments. Yet per capita transit ridership
declined by 36 percent and per capita driving grew 1 Economic Research Service, United States Department
of Agriculture, Major Land Uses, “Summary Table 1—Major
by nearly 5 percent.44 uses of land, by region and State, United States, 2007,”
available at http://www.ers.usda.gov/data-products/major-
Urban planners and planning advocates have land-uses.aspx.
a decades-long obsession with increasing urban 2 “Region 2040 Recommended Alternative Technical
densities. The reasons claimed for needing such Appendix,” Metro, Portland, Oregon, September 15, 1994,
densities change: Early reasons involved preserving Table 11.
farmland (when the United States has 1.5 acres of 3 For the purposes of this paper, my calculations of value-to-
agricultural land that lie more-or-less fallow for every income ratios rely on median family incomes, based on the
hypothesis that families are more likely to buy homes than
acre actually used to grow crops45); preserving open
non-family households. Some other researchers use median
space (when the Census Bureau says that just 3.0 household incomes, which tend to be a bit lower than
percent of the United States, and only 2.1 percent median family incomes, resulting in higher value-to-income
of Minnesota, have been urbanized46); and because ratios. This isn’t necessarily wrong but it explains why my
low-density suburbs “lack a sense of community” numbers might differ from others’.
(actual studies have found that suburbanites are 4 1970 Census of Housing, Volume 1, Housing Characteristics
more likely to be involved in their communities for States, Cities, and Counties, Part 1, United States Summary,
table 17, “Financial Characteristics for Areas and Places”;
than city residents47).
1970 Census of the Population, Volume 1, Characteristics of the
Population, Part 1, United States Summary, Section 2, table
More recently, density advocates have argued that 366, “Median Income in 1969 of Families by Type of Family
suburbs cause obesity (in fact, to the slight extent and Race of Head for Standard Metropolitan Statistical
that suburbanites weigh more than city residents, it Areas of 250,000 or More.”
is due to self-selection: suburbs don’t cause obesity, 5 U.S. Census Bureau, American Community Survey 2006,
but obese people are more likely to choose to live Tables B19113 (median family income) and B25077 (median
home value) for states and urbanized areas.
in suburbs48) or that it is expensive (in fact, the
costs of sprawl are far lower than the costs of trying 6 U.S. Census Bureau, American Community Survey 2012,
Tables B19113 (median family income) and B25077 (median
to prevent sprawl49). The truth is that as soon as home value) for urbanized areas.
one claim for the advantage of density is debunked,
7 “2013 Coldwell-Banker Home Listing Report,” Coldwell-
density advocates come up with another. Banker, 2013, available at hlr.coldwellbanker.com.
8 “Urban and Rural in 2010 by State and County,”
Whatever the real reasons—and it is likely that Bureau of the Census, 2012, www2.census.gov/geo/ua/
many planners themselves aren’t sure why they PctUrbanRural_County.xls.
support urban densification—they are almost 9 Natural Resources Conservation Service, U.S.
certainly based on fallacies such as the ones Department of Agriculture, Summary Report: 2007 National
described here. Instead of writing a plan based on Resources Inventory (2009), p. 24.
such fallacies, the Metropolitan Council should 10 William L. White, Robert Bole, and Brett Sheehan,
scrap the Thrive plan and instead investigate what “Affordable Housing Cost Study: An Analysis of Housing
policies actually contribute to urban growth and a Development Costs in Portland, Oregon,” Housing
Development Center, Portland, 1997, p. 1, http://www.hcd.
healthy environment. Such policies are likely to
ca.gov/2012_affordable_housing/portland_ah_study.pdf.
involve less planning, less land-use regulation, and
11 Compare Mark Hogan, ““Why can’t developers build
less subsidy to transit, and more efforts to improve
housing in San Francisco for the people who need it
urban mobility and reduce the barriers to residential most instead of for the rich?” Markosaurus blog, October
and commercial development. n 22, 2013, at http://markasaurus.com/2013/10/22/why-
can%E2%80%99t-developers-build-housing-in-san-
francisco-for-the-people-who-need-it-most-instead-of-for-
the-rich/ (calculating that an 800-square-foot apartment in
10 Ten Fallacies of the Thrive Planthe Bay Area costs $470,000 to build) with Coldwell Banker, Transportation Energy Data Book, Edition 32 (Department of
“Home Listing Report,” 2013, at http://hlr.coldwellbanker. Energy 2013), Tables 2–13 and 2–14, available at http://cta.
com/FullData.html (finding that a typical 2,200-square foot ornl.gov/data/chapter2.shtml.
single-family home in Dallas, Houston, or San Antonio costs 22 Ibid, Table 2–13.
less than $200,000).
23 Calculated from the U.S. Department of Transportation,
12 “Affirmatively Furthering Fair Housing: Department of 2012 National Transit Database (2013), “Table 17: Energy
Housing and Urban Development Proposed Rule,” Federal Consumption” and “Table 19: Transit Operating Statistics:
Register, July 19, 2013, pp. 43710–43743. Service Supplied and Consumed” spreadsheets, at http://
13 Will James and Josh Barnabel, “Garden City Loses www.ntdprogram.gov/ntdprogram/pubs/dt/2012/excel/
Housing-Law Case,” Wall Street Journal, December 6, 2013, DataTables.htm.
http://online.wsj.com/news/articles/SB100014240527023040 24 Calculated based on federal corporate average fuel
96104579242710500776696. economy standards and an assumption that America’s auto
14 Metropolitan Transportation Commission, Draft Plan fleet will continue to turn over at its historic rate of about
Bay Area (2013), p. 26. Draft Plan Bay Area focuses 80 5.6 percent per year. Randall O’Toole, “Obama Undercuts
percent of new housing in “Priority Development Areas” Case for HSR and Rail Transit,” August 4, 2011, at http://
(PDAs). According to analysis by John Burns Real Estate ti.org/antiplanner/?p=5487.
Consulting: “Since the PDAs are governed by the PDA 25 Steven Polzin, “Energy Crisis Solved!” Urban
types in terms of allowable densities, this effectively means Transportation Monitor, July 11, 2008, pp. 8–9.
that about 80% of future residential units in the region will
be at a minimum of 20 units per acre and at an average 26 United States Department of Transportation and
of something like 60 to 80 units to the acre.” John Burns Metropolitan Council, Central Corridor Light Rail Transit
Real Estate Consulting, “A Review of the San Francisco Project Final Environmental Impact Statement (June 2009): pp.
Bay Area’s Draft Plan Bay Area/Sustainable Communities 4.10-1 to 4.10-2, available at http://www.metrocouncil.org/
Strategy: Market Dynamics and Housing Preferences,” at pg. Transportation/Projects/Current-Projects/Central-Corridor/
5, available at http://quietandsafesanrafael.org/wp-content/ Publications-And-Resources/Environmental/CC-FEIS/
uploads/2013/05/PBA-Review-by-John-Burns.pdf. Published-FEIS/CC-FEIS-Ch4-pdf.aspx.
15 U.S. Department of Energy, 2011 Buildings Energy Data 27 United States Department of Transportation and
Book (2012), p. 2–5, http://buildingsdatabook.eren.doe.gov/ Metropolitan Council, Southwest Transitway Draft
docs/DataBooks/2011_BEDB.pdf. Environmental Impact Statement (October 2012): pp.
4-139 to 4-145, available at http://www.metrocouncil.org/
16 Metropolitan Transportation Commission, Draft Plan Transportation/Projects/Current-Projects/Southwest-LRT/
Bay Area, p. 8. Publications-And-Resources/Environmental-Documents/
17 Calculated by comparing vehicle miles in the DEIS/Published-DEIS/SW-DEIS-ch4-Environmental_
Minneapolis-St. Paul metropolitan area from U.S. Effects.aspx.
Department of Transportation, Highway Statistics 2011 28 Ibid. Note the DEIS likely overestimates the energy use
(2013), Table HM–71 with passenger miles from U.S. of passenger vehicles. Based on the energy use and passenger
Department of Transportation, National Transit Database miles listed in Tables 4.11-3 and 4.11-4, the report appears
2011 (2012), “Table 19: Transit Operating Statistics: Service to assume passenger vehicles will use about 3,700 BTUs per
Supplied and Consumed” spreadsheet. To convert vehicle passenger mile in 2030 compared to 2,600 BTUs for light
miles to passenger miles, they are multiplied by 1.67, which rail.
is the average automobile occupancy rate reported by N.
Santos, et al., Summary of Travel Trends: 2009 National 29 Bureau of Economic Analysis, National Income and
Household Travel Survey (U.S. Department of Transportation Product Account Tables: Table 2.5.5. Personal Consumption
2011), p. 39. Expenditures by Function (2012), at http://www.bea.gov/
iTable/iTable.cfm?reqid=9&step=1&acrdn=2#reqid=9&step
18 Rémy Prud’homme and Chang-Woon Lee, “Size, Sprawl, =3&isuri=1&903=74
Speed and the Efficiency of Cities,” Urban Studies, October
1999, 36(11): 1849–1858. 30 U.S. Department of Transportation, Highway Statistics
2011 (2012), Table VM-1.
19 Eurostat, Panorama of Transport: 2009 Edition (2009), p.
100. 31 N. Santos, et al., Summary of Travel Trends: 2009
National Household Travel Survey (U.S. Department of
20 Genevieve Giuliano, Hsi-Hwa Hu, and Kyoung Lee, Transportation 2011), p. 39.
“The Role of Public Transit in the Mobility of Low Income
Households,” Metrans Transportation Center, University of 32 Calculated by subtracting “amounts for non-highway
Southern California, 2001, p. ii. purposes” and “amounts for mass transportation purposes”
from “subtotal other taxes and fees” in U.S. Department of
21 Stacy C. Davis, Susan W. Diegel, and Robert G. Boundy, Transportation, Highway Statistics 2011, Table HF-10.
Center of the American Experiment 1133 Calculated from the U.S. Department of Transportation, 43 Metropolitan Transportation Commission, Plan Bay Area
2012 National Transit Database, “capital use,” “fare revenue,” Draft Environmental Impact Report (2013), Table 3.1–12.
“operating expenses,” and “service” spreadsheets. Numbers 44 U.S. Department of Transportation, Highway Statistics
may not exactly add due to rounding. Capital costs of the 1989 (1990), Table HM-72; Highway Statistics 2010 (2011),
Hiawatha and Northstar rail lines amortized over 30 years at Table HM-72; U.S. Department of Transportation, 1982
4 percent; capital costs for buses averaged over the past 19 National Transit Database (1983), Table 417282; U.S.
years. Department of Transportation, 2010 National Transit
34 U.S. Department of Transportation, 2011 Highway Database, “Table 19: Transit Operating Statistics: Service
Statistics, Table HM-71. Supplied and Consumed” spreadsheet.
35 U.S. Census Bureau, 2012 American Community Survey, 45 Natural Resources Conservation Service, U.S.
Table B08141, Minneapolis--St. Paul, MN--WI Urbanized Department of Agriculture, Summary Report: 2007 National
Area. Resources Inventory (2009), p. 44.
36 Paul Ong and Evelyn Blumenberg, “Job Access, 46 U.S. Census Bureau, “Urban and Rural in 2010 by State
Commute, and Travel Burden among Welfare Recipients,” and County,” (2012), available at www2.census.gov/geo/ua/
Urban Studies 31(1):77–93. PctUrbanRural_County.xls.
37 Kerri Sullivan, Transportation and Work: Exploring Car 47 Jan Brueckner and Ann Largey, Social Interaction
Usage and Employment Outcomes (June 2003), available at and Urban Sprawl (Center for Economic Studies 2006),
http://web.pdx.edu/~jdill/LSAL_Sullivan.pdf. available at http://papers.ssrn.com/sol3/papers.cfm?abstract_
38 Steven Raphael and Michael Stoll, “Can Boosting id=946914.
Minority Car-Ownership Rates Narrow Inter-Racial 48 Jean Eid, Henry G. Overman, Diego Puga, and Matthew
Employment Gaps?” (Berkeley Program on Housing and A. Turner, Fat City: Questioning the Relationship Between
Urban Policy June 2000), p. 2, available at http://www.uctc. Urban Sprawl and Obesity (University of Toronto, 2006),
net/papers/685.pdf. p. 1; Andrew J. Plantinga and Stephanie Bernell, “The
39 Alliance for Children and Families, “Ways to Work,” at Association Between Urban Sprawl and Obesity: Is It a
http://www.alliance1.org/alliance/waystowork. Two-Way Street?,” Journal of Regional Science, Vol. 47,
No.5 (2007) available at http://www.researchgate.net/
40 The Census Bureau reports data for places, which publication/4773712_THE_ASSOCIATION_BETWEEN_
includes incorporated cities, and metropolitan areas, which URBAN_SPRAWL_AND_OBESITY_IS_IT_A_TWO-
includes all counties that are partly urbanized. Since much WAY_STREET/file/e0b495209a33174541.pdf.
urban development is outside of incorporated cities while
large parts of partly urbanized counties remain rural, neither 49 Robert Burchell, et al., The Costs of Sprawl 2000 (2002),
is appropriate for measuring urban economies. For this, the p. 13 (finding that homes in low-density areas cost $11,000
Census Bureau uses urbanized areas, which are agglomerations more to service than homes in high-density areas, which is
of 50,000 people or more including one or more central cities an insignificant sum compared to the hundreds of thousands
(such as Minneapolis and St. Paul), incorporated suburbs of dollars added to home prices by urban containment plans).
(such as Bloomington), and contiguous development in
unincorporated areas including residential developments
denser than about 1,000 people per square mile (about one
or more homes every two acres). Most references to urban
areas in this report are based on census data for urbanized
areas.
41 Calculated from U.S. Department of Transportation,
National Transit Database (2013), historical data files; and
1990, 2000, and 2010 census populations by urbanized areas.
Correlation coefficients for the top 50 urbanized areas are
–.23 for transit capital spending in the 1990s vs. population
growth in the 2000s; –.31 for transit operating costs in the
1990s vs. population growth in the 2000s; –.22 for transit
operating costs in the 1990s vs. population growth in the
1990s; and –.26 for transit operating costs in the 2000s vs.
population growth in the 2000s.
42 David Brownstone, “Key Relationships between the
Built Environment and VMT,” (Transportation Research
Board 2008), p. 7, available at http://onlinepubs.trb.org/
Onlinepubs/sr/sr298brownstone.pdf.
12 Ten Fallacies of the Thrive PlanAbout the Author
Randal O’Toole is a Cato Institute Senior Fellow working on urban
growth, public land, and transportation issues. O’Toole’s research on
national forest management, culminating in his 1988 book, Reforming
the Forest Service, has had a major influence on Forest Service policy
and on-the-ground management. His analysis of urban land-use and
transportation issues, brought together in his 2001 book, The Vanishing
Automobile and Other Urban Myths, has influenced decisions in cities
across the country. In his book The Best-Laid Plans, O’Toole calls for
repealing federal, state, and local planning laws and proposes reforms
that can help solve social and environmental problems without heavy-
handed government regulation. O’Toole’s latest book is American
Nightmare: How Government Undermines The Dream of Homeownership.
An Oregon native, O’Toole was educated in forestry at Oregon State
University and in economics at the University of Oregon.
Center of the American Experiment 13Non-Profit org
U.S. Postage
PAID
TWIN CITIES, MN
Permit No. 4546
1024 Plymouth Building 12 South 6th Street
Minneapolis, MN 55402
www.AmericanExperiment.org
To obtain copies of any of our publications
please contact American Experiment at (612) 338-3605 or Info@AmericanExperiment.org.
Publications also can be accessed on our website at www.AmericanExperiment.org.
Center of the American Experiment is a nonpartisan, 612-338-3605
tax-exempt, public policy and educational institution that 612-338-3621 (fax)
AmericanExperiment.org
brings conservative and free market ideas to bear on the
Info@AmericanExperiment.org
most difficult issues facing Minnesota and the nation.You can also read