Genome-Wide Identification, Evolution and Expression of the Complete Set of Cytoplasmic Ribosomal Protein Genes in Nile Tilapia - MDPI
←
→
Page content transcription
If your browser does not render page correctly, please read the page content below
International Journal of
            Molecular Sciences

Article
Genome-Wide Identification, Evolution and
Expression of the Complete Set of Cytoplasmic
Ribosomal Protein Genes in Nile Tilapia
Gangqiao Kuang, Wenjing Tao, Shuqing Zheng, Xiaoshuang Wang and Deshou Wang *
 Key Laboratory of Freshwater Fish Reproduction and Development (Ministry of Education), Key Laboratory of
 Aquatic Science of Chongqing, School of Life Sciences, Southwest University, Chongqing 400715, China;
 kuanggangqiao@126.com (G.K.); enderwin@163.com (W.T.); zhengsq0825@163.com (S.Z.);
 wxs958386@163.com (X.W.)
 * Correspondence: wdeshou@swu.edu.cn; Tel.: +86-23-6825-3702

 Received: 6 January 2020; Accepted: 7 February 2020; Published: 12 February 2020

 Abstract: Ribosomal proteins (RPs) are indispensable in ribosome biogenesis and protein synthesis,
 and play a crucial role in diverse developmental processes. In the present study, we carried out a
 comprehensive analysis of RPs in chordates and examined the expression profiles of the complete set
 of 92 cytoplasmic RP genes in Nile tilapia. The RP genes were randomly distributed throughout the
 tilapia genome. Phylogenetic and syntenic analyses revealed the existence of duplicated RP genes
 from 2R (RPL3, RPL7, RPL22 and RPS27) and 3R (RPL5, RPL19, RPL22, RPL41, RPLP2, RPS17, RPS19
 and RPS27) in tilapia and even more from 4R in common carp and Atlantic salmon. The RP genes were
 found to be expressed in all tissues examined, but their expression levels differed among different
 tissues. Gonadal transcriptome analysis revealed that almost all RP genes were highly expressed, and
 their expression levels were highly variable between ovaries and testes at different developmental
 stages in tilapia. No sex- and stage-specific RP genes were found. Eleven RP genes displayed
 sexually dimorphic expression with nine higher in XY gonad and two higher in XX gonad at all stages
 examined, which were proved to be phenotypic sex dependent. Quantitative real-time PCR and
 immunohistochemistry ofRPL5b and RPL24 were performed to validate the transcriptome data. The
 genomic resources and expression data obtained in this study will contribute to a better understanding
 of RPs evolution and functions in chordates.

 Keywords: cytoplasmic ribosomal protein gene; evolution; transcriptome analysis; Nile tilapia

1. Introduction
     Ribosomes are absolutely essential for life, generating all proteins required for cell growth and
maintenance. In eukaryotes, a mature ribosome consists of four different ribosomal RNAs (rRNAs;
18S in the small subunit and 28S, 5.8S, and 5S in the large subunit), as well as ~80 ribosomal proteins
(RPs) [1]. RPs from the small and large subunits are named as RPS and RPL, respectively. Great progress
has been made in recent years in elucidating the structure and function of the RPs [2,3]. The cellular
levels of some RP transcripts change as a function of growth, development and certain tumors [4–6].
In addition, many RPs are believed to have important functions in various other cellular processes,
the so-called extraribosomal functions [7,8]. Over the past years, mutations in ribosomal proteins or
ribosomal biogenesis factors have been identified in patients with varying disease [9,10]. For example,
haploinsufficiency of the RPS4 genes has been suggested to contribute to anatomic abnormalities
associated with the Turner syndrome in humans [11]. In zebrafish, many ribosomal protein mutations
are associated with growth impairment and tumor predisposition [12]. Knockdown of RPS7 causes
developmental abnormalities via p53 dependent and independent pathways [13].

Int. J. Mol. Sci. 2020, 21, 1230; doi:10.3390/ijms21041230                          www.mdpi.com/journal/ijms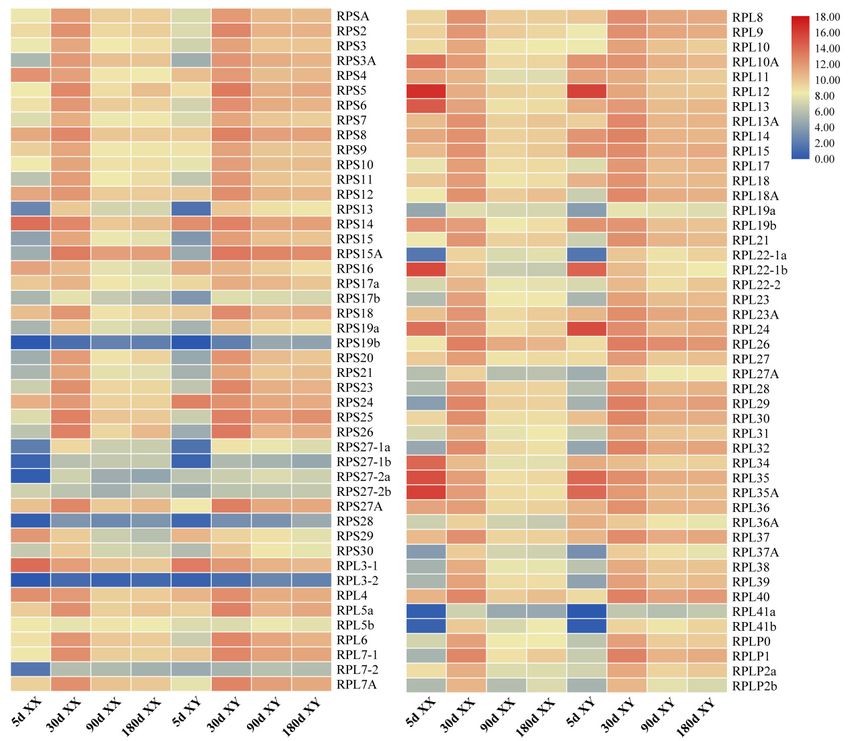
Int. J. Mol. Sci. 2020, 21, 1230                                                                    2 of 21

     Genomic mapping of the RPs is of great interest because of its value in understanding genome
evolution. The sequence information of these genes is required for mapping them onto chromosomes.
The large number of RPs has complicated the quest for a complete understanding of their sequence
information, gene structures and genomic organizations. The first complete identification of human
ribosomal proteins was published in 2001 [14,15]. Although fish represent the largest group of
vertebrates, a complete map of RP genes from any teleost species has not been available until recently.
The complete set of RP genes has been identified from cDNA library in channel catfish, Senegalese sole
and Atlantic halibut [16–19]. However, the exact number of RP genes in fish species is unclear due to
lack of complete genome sequences. The rapid development of genomics, sequencing and disclosure
of more and more animal genomes in recent years has made it feasible to elucidate the evolution of RP
genes in vertebrates.
     The expression pattern of RP genes in different tissues and developmental stages has been reported
in several species. In Haemaphysalis longicornis, RPS-27 was expressed in all life stages, and it was more
highly expressed in the salivary gland than in the midgut at the tissue level [20]. In channel catfish,
Senegalese sole and Atlantic halibut, RP genes were expressed ubiquitously at a similar level among
tissues, although they differed in the relative abundance of their transcripts [16–19]. Sexually dimorphic
expression of RP genes was also observed in some species. For example, two ribosomal proteins,
RPL17 and RPL37, were expressed higher in males compared to females in the zebra finch brain [21–23].
Later, RPS6 was also found to be enhanced in the male zebra finch brain as compared to the female’s
throughout life [24]. In marine shrimp, RPL24 was differentially expressed in ovary and testis [25].
In zebrafish, RPL39 and RPL23A were found to be the female-biased genes [26]. Existing studies on
global RP gene expression are mainly based on expressed sequence tag (EST) approach, the expression
level of genes probably not represented properly. The advances of transcriptomics make it possible to
carry out more accurate expression analyses of the complete set of RPs in different tissues and different
developmental stages in vertebrates.
     The Nile tilapia (Oreochromis niloticus) is a commercially important farmed fish species in
aquaculture worldwide, with the growth rate of males substantially higher than that of females [27].
Because of the key role RPs play in cellular growth and proliferation, it is important to elucidate
the expression pattern of RPs in different tissues in tilapia. As is known to all, during fish gonadal
differentiation and development, the male and female gonads display different gene expression profiles.
Thus, the gonadal model provides a unique opportunity to delineate the coordinated expression of
RPs and other genes during gonadal differentiation and development. However, the complete set of
Nile tilapia ribosomal protein genes has not been previously documented or characterized, and the
expression of RP genes during gonadal differentiation and development in fish has not been reported
to date. The availability of the whole genome sequences of tilapia and tissue transcriptomes [28,29],
together with gonadal transcriptomes at different developmental stages [30,31], has made it an excellent
model for genome-wide identification, tissue distribution and gonadal expression profile investigation
of RP genes involved in gonadal differentiation and development.
     RPs are highly conserved even between vertebrates and invertebrates. This sequence identity
enables us to name RPs with significant confidence and also enables the use of antibodies raised
against mouse RPs on tilapia proteins. In the present study, we carried out a comprehensive analysis
of RP genes in tilapia and other chordates, including genome-wide search, chromosomal location,
phylogeny, synteny and spatial and temporal expression profiles. Our results provided a new insight
into evolution of RPs and revealed their potential role in teleosts.

2. Results

2.1. Identification of RP Genes in Tilapia
    To obtain the complete set of RP genes, a blast search against tilapia genome sequences at NCBI
was performed using zebrafish and human RP genes as reference. A total of 92 RP genes, including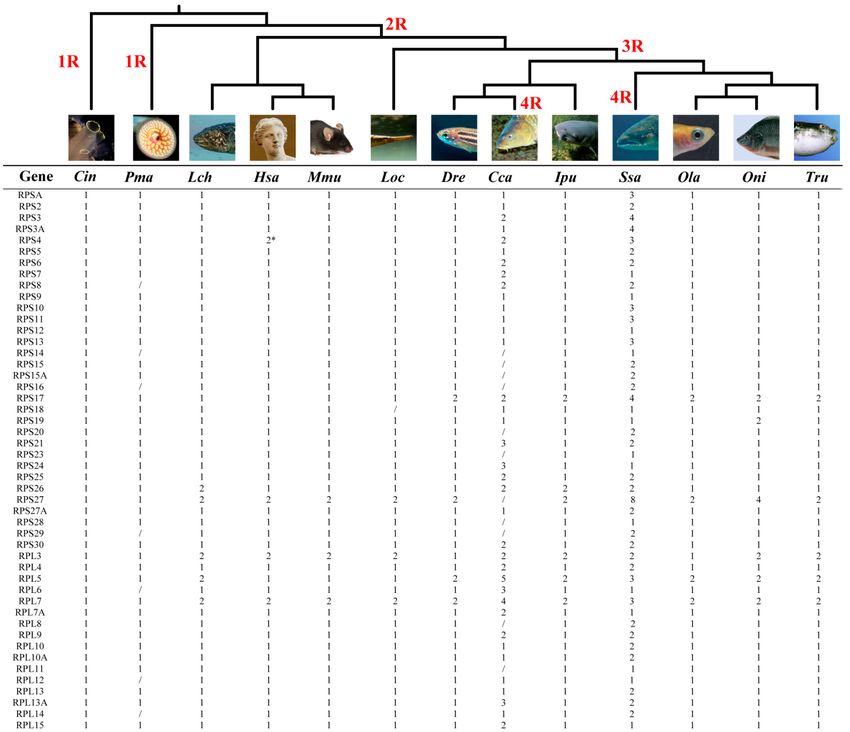
Int. J. Mol. Sci. 2020, 21, 1230                                                                                  3 of 21

55 encoding large-subunit proteins and 37 encoding small-subunit proteins (Table 1), were identified
in tilapia. The GenBank accession number, Chromosome location, number of exons, gene length (bp)
and protein length (aa) for the complete set of RP genes are shown in Table 1. All the 92 RP genes have
complete open reading frames (ORFs) and gene sequences. The average size of the genes from the
transcription start site is ~3.61 kb. RPS17a is the largest (~7.98 kb), whereas RPL41bis the smallest (only
~0.91 kb). Each gene has an average of 5.5 exons, ranging from 3 (RPL39 and RPS29) to 10 (RPL3-2
and RPL4). All of the 92 RP genes were assigned to the linkage maps of the tilapia genome (Figure 1).
The RP genes were found to be randomly distributed throughout the tilapia genome covering all 22
linkage groups (LG). Each LG carried at least one RP gene. Both the LG7 and LG22 carried a total of
nine genes. LG19 is the only example with only one RP gene (RPL13A) present.

                        Table 1. Ribosomal protein (RP) genes identified in Nile tilapia genome.

     Gene          Accession Number    Chromosome Location     Exon Count    Gene Length (bp)      Protein Length (aa)
     RPSA            LOC100707344              LG4                  8              2836                   307
     RPS2            LOC100693457              LG4                  7              2113                   279
     RPS3            LOC100696630              LG14                 7              6031                   245
    RPS3A            LOC100690034              LG6                  6              3940                   266
     RPS4            LOC100709648              LG3                  7              7165                   263
     RPS5            LOC100691205              LG22                 6              3187                   203
     RPS6            LOC100707655              LG6                  6              4440                   249
     RPS7            LOC100704343              LG15                 7              6283                   194
     RPS8            LOC100693356              LG18                 6              4026                   208
     RPS9            LOC100694704              LG11                 5              2450                   194
    RPS10            LOC100708197              LG5                  6              4577                   166
    RPS11            LOC100696602              LG4                  5              2026                   161
    RPS12            LOC100534443              LG15                 5              2914                   132
    RPS13            LOC100696829              LG7                  6              2934                   151
    RPS14            LOC100696222              LG10                 5              2925                   151
    RPS15            LOC100695708              LG18                 4              2627                   145
   RPS15A            LOC100698782              LG6                 5               5166                   130
    RPS16            LOC100703910              LG17                 6              3101                   146
    RPS17a           LOC100691912              LG7                  5              7981                   134
    RPS17b           LOC100699764              LG1                  5              5281                   134
    RPS18            LOC100699803              LG22                 6              3445                   152
    RPS19a           LOC100689943              LG11                 6              6770                   146
    RPS19b           LOC100690398              LG22                 5              7095                   152
    RPS20            LOC100696588              LG9                  4              1505                   119
    RPS21            LOC100701551              LG20                 6              4172                    83
    RPS23            LOC100690746              LG5                  4              2080                   143
    RPS24            LOC100700493              LG13                 5              4576                   131
    RPS25            LOC100690179              LG14                 5              2542                   123
    RPS26            LOC100700449              LG5                  4              1749                   115
   RPS27-1a          LOC100705775              LG11                 4              5189                    84
   RPS27-1b          LOC100696027              LG22                 4              2376                    84
   RPS27-2a          LOC100691333              LG7                  4              2298                    84
   RPS27-2b          LOC100690174              LG23                 4              2477                    84
   RPS27A            LOC100697017              LG13                6               2770                   156
    RPS28            LOC100696499              LG18                 4              2909                    69
    RPS29            LOC100703241              LG15                 3              1056                    56
    RPS30            LOC100704053              LG15                 5              1783                   133
    RPL3-1           LOC100711099              LG4                  9              4294                   403
    RPL3-2           LOC100694819              LG4                 10              3972                   408
     RPL4            LOC100694481              LG7                 10              3520                   369
    RPL5a            LOC100708520              LG23                 8              6819                   297
    RPL5b            LOC100700425              LG18                 8              3792                   298
     RPL6            LOC100699139              LG12                 6              6639                   227
    RPL7-1           LOC100702526              LG9                  7              4215                   245
    RPL7-2           LOC100700318              LG15                 7              4406                   246
    RPL7A            LOC100693537              LG7                 8               3256                   266
     RPL8            LOC100706674              LG16                 6              3269                   257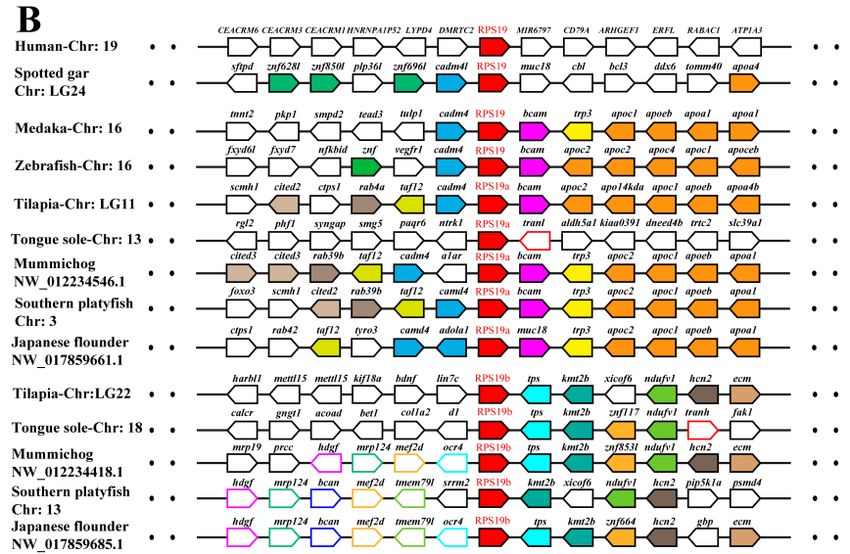
Int. J. Mol. Sci. 2020, 21, 1230                                                                             4 of 21

                                                    Table 1. Cont.

     Gene          Accession Number   Chromosome Location     Exon Count   Gene Length (bp)   Protein Length (aa)
     RPL9            LOC100703191            LG6                     8           5781                192
    RPL10            LOC100697190            LG20                    6           3989                215
   RPL10A            LOC100702190            LG20                    6           1982                216
    RPL11            LOC100695881            LG22                    6           3847                178
    RPL12            LOC100695084            LG1                     6           3525                165
    RPL13            LOC100712089            LG1                     6           4141                211
   RPL13A            LOC100708460            LG19                    7           3290                205
    RPL14            LOC100534449            LG22                    6           3561                137
    RPL15            LOC100697988            LG22                    4           2672                204
    RPL17            LOC100707041            LG7                     7           4249                184
    RPL18            LOC100534549            LG11                    7           5614                188
   RPL18A            LOC100706131            LG17                    5           3492                176
    RPL19a           LOC100706003            LG8                     6           2335                195
    RPL19b           LOC100709589            LG4                     6           3080                194
    RPL21            LOC100711190            LG9                     6           2393                160
   RPL22-1a          LOC100699599            LG20                    4           3986                129
   RPL22-1b          LOC100710673            LG5                     4           3264                129
   RPL22-2           LOC100699889            LG9                     4           2079                129
    RPL23            LOC100701640            LG4                     5           4091                140
   RPL23A            LOC100705596            LG10                    5           2677                155
    RPL24            LOC100707648            LG16                    6           3744                157
    RPL26            LOC100708525            LG2                     4           3651                145
    RPL27            LOC100711912            LG4                     5           3838                136
   RPL27A            LOC100702758            LG7                     5           6769                148
    RPL28            LOC100704095            LG7                     5           2011                137
    RPL29            LOC106098935            LG5                     4           3933                 64
    RPL30            LOC100710306            LG22                    5           3112                116
    RPL31            LOC100696251            LG23                    5           3056                124
    RPL32            LOC100534436            LG20                    4           3255                135
    RPL34            LOC109195715            LG3                     5           2953                117
    RPL35            LOC100711334            LG12                    4           2608                123
   RPL35A            LOC100711077            LG14                    5           4038                110
    RPL36            LOC 100691103           LG17                    4           3201                105
   RPL36A            LOC100690460            LG2                     5           4870                106
    RPL37            LOC100705081            LG7                     4           4669                 97
   RPL37A            LOC100692490            LG18                    4           2432                 92
    RPL38            LOC100711498            LG8                     5           3295                 70
    RPL39            LOC100692256            LG2                     3           3583                 51
    RPL40            LOC100699676            LG12                    5           3438                128
    RPL41a           LOC100711481            LG20                    4            911                 25
    RPL41b           LOC100699101            LG5                     4           1905                 25
    RPLP0            LOC100534569            LG5                     8           2532                315
    RPLP1            LOC100692069            LG22                    4           2095                114
    RPLP2a           LOC100691806            LG1                     5           2962                114
    RPLP2b           LOC100697185            LG5                     5           1987                114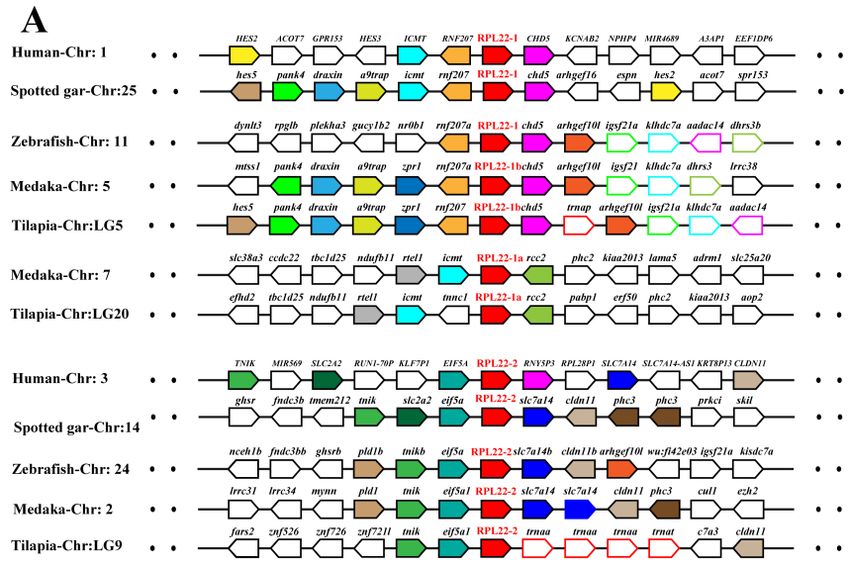
Int. J. Mol. Sci. 2020, 21, 1230                                                                                            5 of 21
Int. J. Mol. Sci. 2019, 20, x FOR PEER REVIEW                                                                               5 of 21

       Figure 1. Chromosomal maps of the RP genes in Nile tilapia. RP genes are depicted on a linkage group
      Figure 1. Chromosomal maps of the RP genes in Nile tilapia. RP genes are depicted on a linkage group
       (LG) of the genome (Release 2). LG21 is absent because it has been combined withLG16. Red and blue
      (LG) of the genome (Release 2). LG21 is absent because it has been combined withLG16. Red and blue
       horizontal lines indicate the large subunit and small subunit RP genes, respectively. Gene name in blue
      horizontal lines indicate the large subunit and small subunit RP genes, respectively. Gene name in
       indicates genes derived from 2R event. Gene name in magenta indicates genes derived from 3R event.
      blue indicates genes derived from 2R event. Gene name in magenta indicates genes derived from 3R
       Gene name in orange indicates genes derived from both 2R and 3R events.
      event. Gene name in orange indicates genes derived from both 2R and 3R events.
 2.2. Comparative Analysis of RP Genes in Chordates
2.2. Comparative Analysis of RP Genes in Chordates
       To understand the conservation of RP genes in vertebrates, the putative amino acid sequences
       To
 of tilapiaunderstand
              RPs were the       conservation
                            compared             of RPfrom
                                         with those      genesthe in zebrafish,
                                                                       vertebrates,    the putative
                                                                                    medaka,      fugu andamino   acid sequences
                                                                                                              human     (Table S1).
of  tilapiaidentities
 Overall     RPs wereofcompared
                             tilapia RPswith   those 96.5%,
                                         were97%,      from the     zebrafish,
                                                                94.1%and           medaka,
                                                                               92.7%   to those fugu    and human
                                                                                                   of medaka,     fugu,(Table    S1).
                                                                                                                          zebrafish
Overall    identities   of  tilapia RPs  were97%,     96.5%,    94.1%and      92.7%   to   those
 and human, respectively. The most conserved RPs in the five species (overall mean identity ≥98%)  of medaka,    fugu,   zebrafish
and
 werehuman,
         RPL23, respectively.
                   RPL38, RPL39,   The  most RPS13,
                                      RPL40,   conserved      RPsRPS23
                                                         RPS14,      in the and
                                                                              five RPS27A.
                                                                                    species (overall mean identity ≥98%)
were TheRPL23,    RPL38,ofRPL39,
             numbers           aminoRPL40,
                                      acids inRPS13,
                                                 the RPs RPS14,     RPS23conserved
                                                            are highly       and RPS27A.   among species. Among the five
       The   numbers      of  amino   acids  in  the RPs    are  highly
 species compared, 48 of the 92 RPs (52.2%) have the same number of amino   conserved      among      species.
                                                                                                          acids.Among      the five
                                                                                                                   The other     RPs
species    compared,      48   of the 92 RPs    (52.2%)    have    the   same   number       of  amino
 display different sizes in either one species (RPL5a, RPL9, RPL18 and RPL28 in zebrafish and RPL10A,     acids.  The   other    RPs
display
 RPL13A,different
              RPL23A,sizes RPL29,in either
                                     RPS3, one    species
                                             RPS10,          (RPL5a,
                                                       RPS27-1a       andRPL9,
                                                                            RPS19a  RPL18      and RPL28
                                                                                        in human),       or twoin to
                                                                                                                   zebrafish
                                                                                                                     four speciesand
RPL10A,      RPL13A,      RPL23A,     RPL29,    RPS3,   RPS10,     RPS27-1a      and   RPS19a
 (21 RPs including RPL4, RPL6, RPL7-1, RPL10, RPL14, RPL19a, RPL19b, RPL22-1b, RPL22-2, RPL29,     in  human),    or  two   to  four
species
 RPL30, (21    RPs including
           RPL31,    RPLP0, RPLP1, RPL4,RPLP2a,
                                          RPL6, RPL7-1,
                                                     RPSA, RPL10,        RPL14, RPS11,
                                                              RPS2, RPS3A,         RPL19a,      RPL19b,
                                                                                              RPS24    andRPL22-1b,
                                                                                                            RPS25) or RPL22-2,
                                                                                                                          even five
RPL29,     RPL30,    RPL31,      RPLP0,  RPLP1,     RPLP2a,     RPSA,      RPS2,   RPS3A,      RPS11,
 species (RPL4, RPL14 and RPL29). In all three cases, fish RPs have fewer amino acids than their         RPS24    and   RPS25)    or
even    five species
 mammalian counterparts.(RPL4,    RPL14  and   RPL29).    In  all three    cases,  fish  RPs    have   fewer   amino    acids  than
their Given
       mammalian that thecounterparts.
                            whole genome duplication (WGD) can drive the expansion of gene families, we
       Given    that  the  whole
 surveyed the number changes        genome    duplication
                                         of the   RP genes (WGD)          can drive thechordates
                                                               in 13 representative          expansionwith of gene   families,
                                                                                                                different   roundswe
surveyed      the  number      changes  of the   RP  genes    in  13   representative      chordates
 of WGD, from first round to fourth round (referred to as 1R, 2R, 3R and 4R) (Figure 2, Figure 3 and     with   different   rounds
of WGD,
 Table   S2).from
               Afterfirst  round to fourth
                      comprehensive            round
                                         analysis,   we(referred
                                                          identified  to 79,
                                                                          as 1R,  2R,84,
                                                                             64, 86,   3R 83,
                                                                                            and80,4R)85,(Figures
                                                                                                         125, 90, 2, 3 and
                                                                                                                   148,       Table
                                                                                                                         88, 92  and
S2).  After   comprehensive        analysis,  we   identified    79,   64, 86,  84,  83,  80,  85,
 86 RP genes in sea squirt, lamprey, coelacanth, human, mouse, spotted gar, zebrafish, common carp, 125,  90, 148,  88, 92  and   86
RP   genes    in  sea  squirt,   lamprey,  coelacanth,      human,      mouse,     spotted    gar,
 channel catfish, Atlantic salmon, medaka, tilapia and fugu genome, respectively. Compared with      zebrafish,   common       carp,
channel catfish, Atlantic salmon, medaka, tilapia and fugu genome, respectively. Compared with
Atlantic salmon, the absence of certain RPs in common carp may be due to more secondary loss or
incomplete genome sequencing and assembly.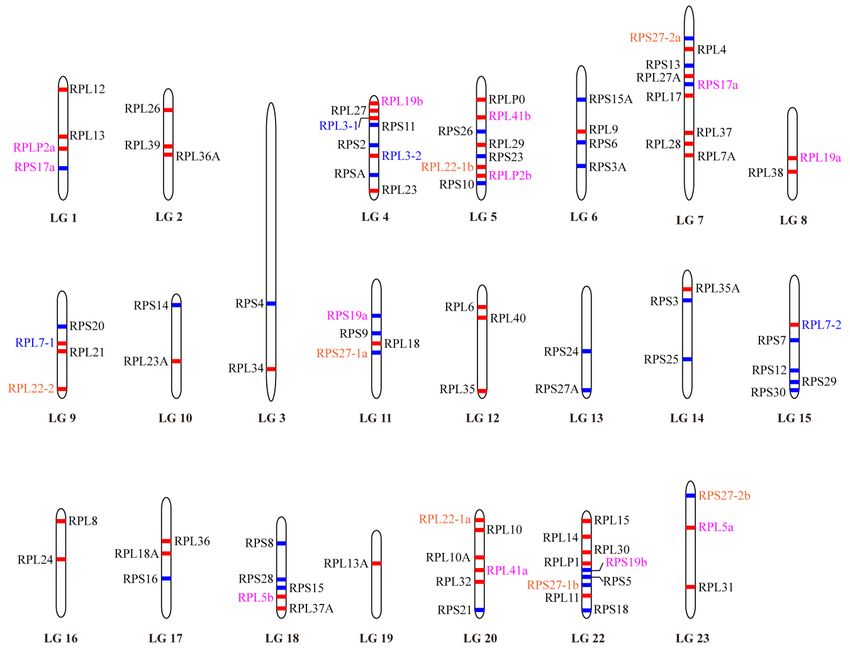
Int. J. Mol. Sci. 2020, 21, 1230                                                                                     6 of 21

Atlantic salmon, the absence of certain RPs in common carp may be due to more secondary loss or
Int. J. Mol. Sci. 2019, 20, x FOR PEER REVIEW                                            6 of 21
incomplete genome sequencing and assembly.

      Figure 2. Phylogenetic relationship of 13 representative chordates analyzed and number variation
      Figure 2. Phylogenetic relationship of 13 representative chordates analyzed and number variation of
      of RP genes. 1R, 2R, 3R and 4R indicate the four rounds of WGD that occurred during vertebrate
      RP genes. 1R, 2R, 3R and 4R indicate the four rounds of WGD that occurred during vertebrate
      evolution. Slash indicates no homologous gene detected, probably due to secondary loss or incomplete
      evolution. Slash indicates no homologous gene detected, probably due to secondary loss or
      genome sequences. * indicates two isoforms of RPS4 located on the human X and Y chromosomes.
      incomplete    genomePma,
      Cin, Ciona intestinalis; sequences.
                                    Petromyzon* indicates  twoLatimeria
                                                 marinus; Lch,   isoforms    of RPS4Hsa,
                                                                          chalumnae;    located
                                                                                           Homo on    the Mmu,
                                                                                                  sapiens; human MusX
      and Y chromosomes.
      musculus;                     Cin, Ciona
                 Loc, Lepisosteus oculatus;       intestinalis;
                                             Dre, Danio           Pma,
                                                         rerio; Cca,     Petromyzon
                                                                     Cyprinus            marinus;
                                                                               carpio; Ipu, IctalurusLch,  Latimeria
                                                                                                       punctatus; Ssa,
      chalumnae;   Hsa,  Homo    sapiens; Mmu,    Mus  musculus;     Loc,  Lepisosteus  oculatus;
      Salmo salar; Ola, Oryzias latipes; Oni, Oreochromis niloticus; Tru, Takifugu rubripes.       Dre,  Danio rerio;
      Cca, Cyprinus carpio; Ipu, Ictalurus punctatus; Ssa, Salmo salar; Ola, Oryzias latipes; Oni,
      Oreochromis niloticus; Tru, Takifugu rubripes.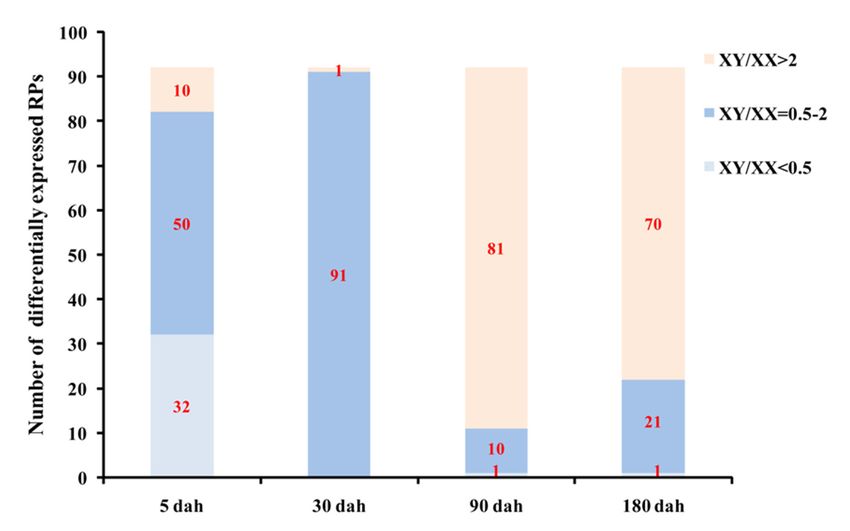
Int. J. Mol. Sci. 2020, 21, 1230                                                                                           7 of 21
   Int. J. Mol. Sci. 2019, 20, x FOR PEER REVIEW                                                                             7 of 21

         Figure
      Figure     3. Phylogenetic
              3. Phylogenetic         tree
                                   tree of of
                                           thethe small
                                               small      subunit
                                                       subunit   (A)(A)
                                                                     and and  large
                                                                           large    subunit
                                                                                 subunit  (B)(B)
                                                                                              RPRP   genes
                                                                                                  genes     from
                                                                                                         from  seasea   squirt
                                                                                                                     squirt
         (1R),
      (1R),    human
            human       (2R),
                     (2R),      tilapia
                            tilapia     (3R)
                                     (3R)  andand  Atlantic
                                                Atlantic      salmon
                                                           salmon      (4R).
                                                                   (4R).     Gene
                                                                          Gene      name
                                                                                 name     in blue
                                                                                       in blue     indicates
                                                                                               indicates     genes
                                                                                                          genes       derived
                                                                                                                  derived
         from
      from  2R2R  event
                event  in in vertebrates.
                          vertebrates.      Gene
                                          Gene     name
                                                name   in in magenta
                                                           magenta      indicates
                                                                     indicates    genes
                                                                                genes    derived
                                                                                      derived     from3R
                                                                                               from3R      event
                                                                                                        event  in in  teleosts.
                                                                                                                   teleosts.
      Gene  name
         Gene      in orange
                name   in orange indicates  genes
                                    indicates      derived
                                               genes   derivedfrom both
                                                                 from     2R and
                                                                        both      3R events.
                                                                              2R and          Cin,Cin,
                                                                                      3R events.        Cionaintestinalis;
                                                                                                    Cionaintestinalis;  Hsa,
      Homo   sapiens; Oni,  Oreochromis    niloticus; Ssa,  Salmo salar.
         Hsa, Homo sapiens; Oni, Oreochromis niloticus; Ssa, Salmo salar.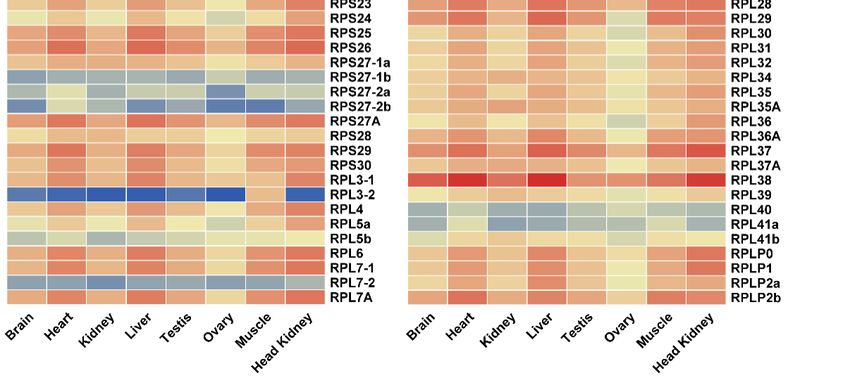
Int. J. Mol. Sci. 2020, 21, 1230                                                                     8 of 21

2.3. Phylogenetic and Syntenic Analyses of RP Paralogous Genes in Tilapia
      Phylogenetic and syntenic analyses were performed to understand the evolution of RP genes
in vertebrates. Ten RP genes with different numbers of paralogous genes were identified in tilapia,
including two for RPL3, RPL5, RPL7, RPL19, RPL41, RPLP2, RPS17 and RPS19, three for RPL22,
and four for RPS27. All of these RP paralogous genes were unevenly distributed throughout the
genome as shown in Figure 1. Interestingly, RPS19a and RPS27-1a, RPS19b and RPS27-1b, were located
on LG11 and LG22, respectively.RPL41a and RPL22-1a, RPL41b and RPL22-1b, were located on LG20
and LG5, respectively. In contrast, both RPL3-1 and RPL3-2 were located on LG4.
      A phylogenetic analysis was carried out for these duplicated genes, including sequences available
in the GenBank and Ensembl for representative fish and tetrapod counterparts (Figure S1). Paralogs of
RPL41 were not included in this analysis due to their small ORFlength and identical amino acid sequence
(25 aa). In the tree, paralogs of RPL3-1 and RPL3-2 were grouped into two distinct well-supported
clades that included the fish and tetrapod counterparts (Figure S1A). Similarly, the RPL7-1 and RPL7-2
paralogs also clustered into two separate sister clades (Figure S1B). The phylogenetic relationship of
these genes suggests that they could have arisen from 2R and evolved independently. Paralogs of
RPL22-1a/RPL22-1b and RPL22-2 were grouped into two paraphyletic groups, including fish and
tetrapod counterparts as shown in Figure 3A. RPL22-1b appeared closely related to the other fish RPL22
sequences, although they did not form a well-resolved clade (Figure S1C). The four paralogous genes
for RPS27 in tilapia clustered into two paraphyletic groups with their fish and tetrapod counterparts
(Figure S1D). The tilapia RPS27-1a and RPS27-1b showed a monophyletic origin with tetrapod
counterparts as a paraphyletic group, whereas tilapiaRPS27-2b grouped with other fish counterparts in
a well-supported clade, and tilapiaRPS27-2awas closely related to its cichlid counterparts and RPS27-2
sequences from tetrapod. Both theRPL5 and RPL19 paralogs showed a monophyletic origin with
tetrapod counterparts as a paraphyletic group (Figure S1E,F, respectively). RPLP2 paralogs clustered
into two separate sister clades (Figure S1G). RPLP2b in tilapia grouped with other fish counterparts in
a well-supported clade, whereas the RPLP2a in tilapia was grouped with counterparts from medaka,
fugu, three-spined stickleback, Atlantic salmon, channel catfish, zebrafish, carp and RPLP2 from
spotted gar, coelacanth and tetrapods. Paralogs of RPS17 also clustered into two separate sister
clades (Figure S1H). RPS17b in tilapia grouped with other fish counterparts in a well-supported clade,
whereas the RPS17a was closely related to counterparts from medaka, three-spined stickleback, fugu,
zebrafish, carpand RPS17 sequences from spotted gar, coelacanth and tetrapod.Two RPS19paralogs
were found in tilapia for the first time(Figure S1I), and they share 84.2% identity at the amino acid level.
Similar to RPL5 and RPL19, the RPS19 paralogs also showed a monophyletic origin with tetrapod
counterparts as a paraphyletic group, but the RPS19b was only detected in species from Percomorpha,
including Perciformes, Cyprinodontiformes and Pleuronectiformes.
      In addition, synteny analysis showed that all the duplicates of tilapia RP genes and their adjacent
genes were in regions of conserved synteny in teleosts and other vertebrates (Figure 4 and Figure
S2). Phylogenetic and syntenic analyses revealed the existence of paralogous genes from 2R (RPL3,
RPL7, RPL22 and RPS27) and 3R (RPL5, RPL19, RPL22, RPL41, RPLP2, RPS17, RPS19 and RPS27).
RPL3 and RPL7 only experienced 2R event, and RPL22 and RPS27 experienced both 2R and 3R events.
In addition, duplication ofRPS19 was observed only in Percomorpha. Duplicates of RPL5, RPL19,
RPL41, RPLP2, RPS17 and RPS19were clustered in two independent clades in the teleost lineage,
whereas only one copy was found in one clade in tetrapods and spotted gar. These results indicated
that those duplicates were derived from 3R event after teleost fish diverged from spotted gar.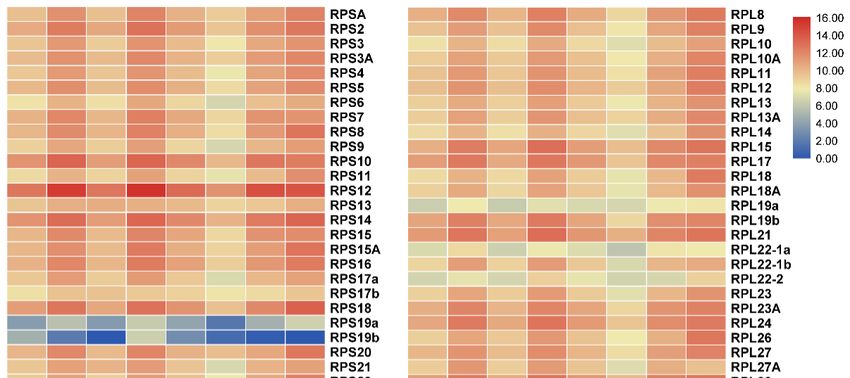
Int. J. Mol. Sci. 2020, 21, 1230                                                                                   9 of 21
Int. J. Mol. Sci. 2019, 20, x FOR PEER REVIEW                                                                      9 of 21

     Figure 4.
     Figure     Syntenyanalyses
             4. Synteny   analysesofofRPL22
                                       RPL22(A)
                                              (A)and
                                                   andRPS19
                                                         RPS19(B)
                                                                (B)and
                                                                     and their
                                                                          their adjacent
                                                                                adjacentgenes
                                                                                          genesin
                                                                                                in tilapia
                                                                                                    tilapiaand
                                                                                                           and other
                                                                                                                other
     vertebrates. Rectangles
     vertebrates.  Rectanglesrepresent
                               representgenes
                                          genesininchromosome/scaffold.
                                                    chromosome/scaffold. Dotted
                                                                              Dottedlines
                                                                                      linesrepresent
                                                                                            representomitted
                                                                                                        omittedgenes
                                                                                                               genes
     of the
     of  thechromosome/scaffold.
            chromosome/scaffold. The The direction
                                          direction of
                                                     of the
                                                        the arrows
                                                            arrows indicates
                                                                     indicates the
                                                                                the gene
                                                                                    gene orientation.
                                                                                         orientation. The
                                                                                                        The RP
                                                                                                            RP genes
                                                                                                               genes
     are shown
     are  shown in
                 in red,
                    red, while
                         while the
                                the other
                                    other genes
                                          genes are
                                                  are shown
                                                      shown inin different
                                                                 different color.
                                                                            color.

 2.4. Tissue Distribution and Ontogeny Expression of RP Genes in Gonads of Tilapia by Transcriptomic Analysis
2.4. Tissue Distribution and Ontogeny Expression of RP Genes in Gonads of Tilapia by Transcriptomic
       Transcriptome data from eight adult tissues and gonads from four developmental stages of tilapia
Analysis
 were analyzed to understand the expression profile of RP genes. The RP genes were found to be
      Transcriptome data from eight adult tissues and gonads from four developmental stages of
 expressed in all tissues examined (Figure 5). Interestingly, most RP genes exhibited tissue-biased
tilapia were analyzed to understand the expression profile of RP genes. The RP genes were found to
 expression patterns especially in heart, liver, muscle and head kidney. RPS10, RPS12, RPS14, RPS18,
be expressed in all tissues examined (Figure 5). Interestingly, most RP genes exhibited tissue-biased
 RPS26, RPL37 and RPL38 were highly expressed, while RPL3-2 showed background expression level
expression patterns especially in heart, liver, muscle and head kidney. RPS10, RPS12, RPS14, RPS18,
 in all eight tissues. In addition, RPL38 was the most highly expressed in all eight tissues.
RPS26, RPL37 and RPL38 were highly expressed, while RPL3-2 showed background expression level
       Most RP genes were generally highly expressed in tilapia gonads (Figure 6). The total and average
in all eight tissues. In addition, RPL38 was the most highly expressed in all eight tissues.
 reads per kb per million (RPKM) values were 804,840 and 8748 for XX gonads, and 866,548 and 9419
 for XY gonads, respectively (Table 2). No sex- and stage-specific RP genes were observed. With regard
 to single RP genes in the four developmental stages, 57 and 69 RP genes were found to express at
 an average RPKM value above 1000 in XX and XY gonads, respectively. In contrast, some RP genes
 were rarely expressed both in XX and XY gonads at the four developmental stages, including RPL3-2,
 RPL7-2, RPS19b, RPS27-1b and RPS28, which were present at an average RPKM value lower than 100.
Int. J. Mol. Sci. 2020, 21, 1230 10 of 21
Int. J. Mol. Sci. 2019, 20, x FOR PEER REVIEW 10 of 21
Figure
Figure 5.
5.AAheat
heatmap
map showing
showing tissue
tissue distribution
distribution (RPKM:
(RPKM: reads per kb per million reads) of RP genes
in eight tissues based on transcriptome data in tilapia.
in eight tissues based on transcriptome data in tilapia. RedRed and
and blue
blue indicate
indicate high
high and
and low
low expression,
expression,
respectively.
respectively. Each
Each row
row represents
represents aa different
different gene,
gene, and
and each
each column
column represents
represents an
an independent
independent tissue
tissue
sample.
sample. The
The widespread
widespread complex
complex expression
expression patterns
patterns in
in all
all tissues
tissues were
were readily
readily discernable.
discernable. Most
Most of
of
the RP genes displayed high and ubiquitous expression in all tissues
the RP genes displayed high and ubiquitous expression in all tissues examined.examined.
Most Table
RP genes wereofgenerally
2. Statistics highly expressed
RP gene expressions in tilapia
in tilapia gonads gonads
at four (Figure 6).
developmental The total and
stages.
average reads per kb per million (RPKM) values were 804,840 and 8748 for XX gonads, and 866,548
and 9419 for XY gonads,5 dah respectively (Table 30 dah 90 dah
2). No sex- and stage-specific 180 dah
RP genes were observed.
With regard to XX single RP genes
XY in theXX four developmental
XY stages,
XX 57 and
XY69 RP genesXX were foundXY to
express
Total at an average
409,026 RPKM
229,345value above
299,234 1000 in XX
372,252 and XY gonads,
45,903 respectively.
133,854 In
50,678 contrast, some
131,097
RP genes were
Average 4446rarely expressed
2493 both
3253in XX and 4046 XY gonads499 at the1455 four developmental
551 stages,
1425
including Total
RPL3-2, RPL7-2, RPS19b, RPS27-1b and RPS28, which were present at an average
indicates the total RPKM of all RP genes; average indicates the average RPKM of all RP genes. RPKM
value lower than 100.
At 5 dah (day after hatching), the total and average RPKM valuesof the RP genes were 409,026
and 4446 for XX gonads, and 229,345 and 2493 for XY gonads, respectively (Table 2). Twenty-eight and
25 RP genes were expressed at RPKM values above 1000 in XX and XY gonads, respectively. Thirty-two
RP genes were expressed at 2-fold higher levels in XX than XY gonads (XY/XX RPKM value < 0.5),
and 10 genes showed an approximately 2-fold higher expression in XY than XX gonads (XY/XX RPKM
value > 2), 50 genes displayed no significant differences in expression level between XX and XY gonads
(XY/XX RPKM value = 0.5–2) (Figures 6 and 7).Int. J. Mol. Sci. 2020, 21, 1230 11 of 21
Int. J. Mol. Sci. 2019, 20, x FOR PEER REVIEW 11 of 21
Figure 6.
Figure The expression
6. The expression profiles
profiles of
of RP
RP genes
genes in
in XX
XX and
and XYXY gonads
gonads based
based on
on transcriptome
transcriptome data
data from
from
tilapia. RNA preparations from gonads of XX and XY fish at 5, 30, 90 and 180 dah (day after
tilapia. RNA preparations from gonads of XX and XY fish at 5, 30, 90 and 180 dah (day after hatching) hatching)
were sequenced
were sequenced previously
previously [30].
[30]. RPKM
RPKM (reads
(reads per
per kb
kb per
per million
million reads)
reads) was
was used
used to
to normalize
normalize thethe
Int. J. Mol. Sci. 2019, 20, x FOR PEER REVIEW 12 of 21
expression profiles of RP genes.
expression profiles of RP genes.
Table 2. Statistics of RP gene expressions in tilapia gonads at four developmental stages.
5 dah 30 dah 90 dah 180 dah
XX XY XX XY XX XY XX XY
Total 409,026 229,345 299,234 372,252 45,903 133,854 50,678 131,097
Average 4446 2493 3253 4046 499 1455 551 1425
Total indicates the total RPKM of all RP genes; average indicates the average RPKM of all RP genes.
At 5 dah (day after hatching), the total and average RPKM valuesof the RP genes were 409,026
and 4446 for XX gonads, and 229,345 and 2493 for XY gonads, respectively (Table 2). Twenty-eight
and 25 RP genes were expressed at RPKM values above 1000 in XX and XY gonads, respectively.
Thirty-two RP genes were expressed at 2-fold higher levels in XX than XY gonads (XY/XX RPKM
valueInt. J. Mol. Sci. 2020, 21, 1230 12 of 21
were up-regulated with the total and average RPKM values rising to 372,252 and 4046, respectively
(Table 2). Seventy-one and 72 genes were expressed at RPKM values above 1000 in XX and XY gonads,
respectively. At this stage, all RP genes except one (RPS19b with RPKM values of 1.47 and 3.76 in XX
and XY gonads, respectively) displayed no significant differences in expression level between XX and
XY gonads (XY/XX RPKM value= 0.5–2) (Figures 6 and 7).
At 90 dah, the expression levels of RP genes were remarkably down-regulated in both XX and XY
gonads, with the total and average RPKM values decreased to 45,903 and 499 for XX and 133,854 and
1455 for XY, respectively (Table 2). Six and 55 RP genes were expressed at RPKM values above 1000 in
XX and XY gonads, respectively. Eighty-one out of 92 genes (88%) were expressed 2-fold higher in XY
than XX gonads (XY/XX RPKM value > 2), and only 1 RP gene was expressed at 2-fold higher levels
in XX than XY gonads (XY/XX RPKM value < 0.5), 10 genes displayed no significant differences in
expression level between XX and XY gonads (XY/XX RPKM value = 0.5–2) (Figures 6 and 7).
At 180 dah, the expression patterns of RP genes in both XX and XY gonads were similar to those
at 90 dah, the total and average RPKM values of the RP genes were 50,678 and 551 for XX gonads,
and 131,096 and 1425 for XY gonads, respectively (Table 2). Ten and 55 RP genes were expressed at
RPKM values above 1000 in XX and XY gonads, respectively. Seventy out of 92 genes (76%) were
expressed at 2-fold higher levels in XY than XX gonads (XY/XX RPKM value > 2), and only 1 RP gene
was expressed at 2-fold higher levels in XX than XY gonads (XY/XX RPKM value < 0.5), 21 genes
displayed no significant differences in expression level between XX and XY gonads (XY/XX RPKM
value = 0.5–2) (Figures 6 and 7).
Overall, the number and expression levels of differentially expressed RP genes were higher in XX
than in XY gonads at 5 dah stage, while contrasting expression patterns were observed at 90 and 180
dah stages. At 30 dah stage, all RP genes except one (RPS19b) displayed no significant differences in
expression level between XX and XY gonads. In addition, 11 RP genes displayed sexually dimorphic
expressionin the gonad with 9 expressed higher in XY gonad and 2 higher in XX gonad at all stages
examined. Transcriptome analysis of gonads from the sex-reversed fishrevealeda reversed expression
profile of these 11 RP genes, indicating the sexual dimorphism is phenotypicsex dependent (Figure 8).
Taken together, our results revealed a strong sex- and stage-dependent expression pattern of RP genes
Int. J. Mol. Sci. 2019, 20, x FOR PEER REVIEW 13 of 21
in tilapia gonad.
Figure 8. Sexually dimorphic expression of RP genes in XX and XY gonads based on gonadal
Figure 8. Sexually
transcriptome dimorphic
data from expression
normal and secondaryof sex-reversal
RP genes in(SSR)
XX tilapia
and XY gonads
[31]. basedwere
SSR tilapia on obtained
gonadal
transcriptome
by dataa diet
feeding XX fish fromsprayed
normalwith
and95%secondary sex-reversal
ethanol containing (SSR) tilapia
Fadrozole [31]. SSR tilapia
at a concentration of 200 were
µg/g
obtained by feeding XX fish a diet sprayed with 95% ethanol containing Fadrozole at
diet from 90 to 180 dah. The control XX and XY fish were fed a diet sprayed with 95% ethanol buta concentration
of 200μg/g
without diet from
Fadrozole. RNA90 to 180 dah. The
preparations fromcontrol
gonadsXXofand
XX, XY fish sex-reversed
XY and were fed a diet sprayed at
individuals with
180 95%
dah
ethanol but without Fadrozole. RNA preparations from gonads of XX, XY and
were sequenced using Illumina 2000 HiSeq technology in our previous study. RPKM (reads per kb per sex-reversed
individuals
million at was
reads) 180 dah
usedwere sequenced
to normalize theusing Illumina
expression 2000 HiSeq
profiles technology in our previous study.
of RP genes.
RPKM (reads per kb per million reads) was used to normalize the expression profiles of RP genes.
2.5. Validation by qRT-PCR and Immunohistochemistry
Immunohistochemistry (IHC) and qRT-PCR were performed to validate the transcriptome data.
RPL5b and RPL24, the most significantly differentially expressed genes in XX and XY gonads and
with commercial antibodies available, were selected for validation. By qRT-PCR, RPL5b was
continuously expressed higher while RPL24 was continuously expressed lower in XX than XY
gonads at 5, 10, 20, 50, 70 and 180 dah, even though their expression varied at different stages ofFigure 8. Sexually dimorphic expression of RP genes in XX and XY gonads based on gonadal
transcriptome data from normal and secondary sex-reversal (SSR) tilapia [31]. SSR tilapia were
obtained by feeding XX fish a diet sprayed with 95% ethanol containing Fadrozole at a concentration
of 200μg/g diet from 90 to 180 dah. The control XX and XY fish were fed a diet sprayed with 95%
ethanol but without Fadrozole. RNA preparations from gonads of XX, XY and sex-reversed
Int. J. Mol. Sci. 2020,at
individuals 21,180
1230 13 of 21
dah were sequenced using Illumina 2000 HiSeq technology in our previous study.
RPKM (reads per kb per million reads) was used to normalize the expression profiles of RP genes.
2.5. Validation by qRT-PCR and Immunohistochemistry
2.5. Validation by qRT-PCR and Immunohistochemistry
Immunohistochemistry (IHC) and qRT-PCR were performed to validate the transcriptome data.
Immunohistochemistry (IHC) and qRT-PCR were performed to validate the transcriptome data.
RPL5b and RPL24, the most significantly differentially expressed genes in XX and XY gonads and with
RPL5b and RPL24, the most significantly differentially expressed genes in XX and XY gonads and
commercial antibodies available, were selected for validation. By qRT-PCR, RPL5b was continuously
with commercial antibodies available, were selected for validation. By qRT-PCR, RPL5b was
expressed higher while RPL24 was continuously expressed lower in XX than XY gonads at 5, 10, 20,
continuously expressed higher while RPL24 was continuously expressed lower in XX than XY
50, 70 and 180 dah, even though their expression varied at different stages of gonad development
gonads at 5, 10, 20, 50, 70 and 180 dah, even though their expression varied at different stages of
(Figure 9).
gonad development (Figure 9).
Figure 9. Ontogeny expression of RPL5b (A) and RPL24 (B) in tilapia gonads by qRT-PCR. Data are
Figure 9. Ontogeny expression of RPL5b (A) and RPL24 (B) in tilapia gonads by qRT-PCR. Data are
expressed as mean±SD for triplicates. Bars bearing different letters differ (p < 0.05) by one-way ANOVA
expressed as mean±SD for triplicates. Bars bearing different letters differ (p < 0.05) by one-way
followed by post-hoc test.
ANOVA followed by post-hoc test.
By immunohistochemistry, strong specific signals of RPL5b were observed mainly in the cytoplasm
By immunohistochemistry, strong specific signals of RPL5b were observed mainly in the
of oocytes in the ovary, while weak signals were detected in the spermatocytes in the testis. However,
cytoplasm of oocytes in the ovary, while weak signals were detected in the spermatocytes in the testis.
nearly no signals were detected in other spermatogenic cells (Figure 10A,B). In contrast, RPL24 was
However, nearly no signals were detected in other spermatogenic cells (Figure 10A, B). In contrast,
found to be expressed ubiquitously at high levels in different spermatogeniccells, while very weak
RPL24 was found to be expressed ubiquitously at high levels in different spermatogeniccells, while
signals
Int. were observed
J. Mol. Sci. 2019, 20, xin the
FOR cytoplasm
PEER REVIEW of oocytes in the ovary (Figure 10C,D). 14 of 21
very weak signals were observed in the cytoplasm of oocytes in the ovary (Figure 10C, D).
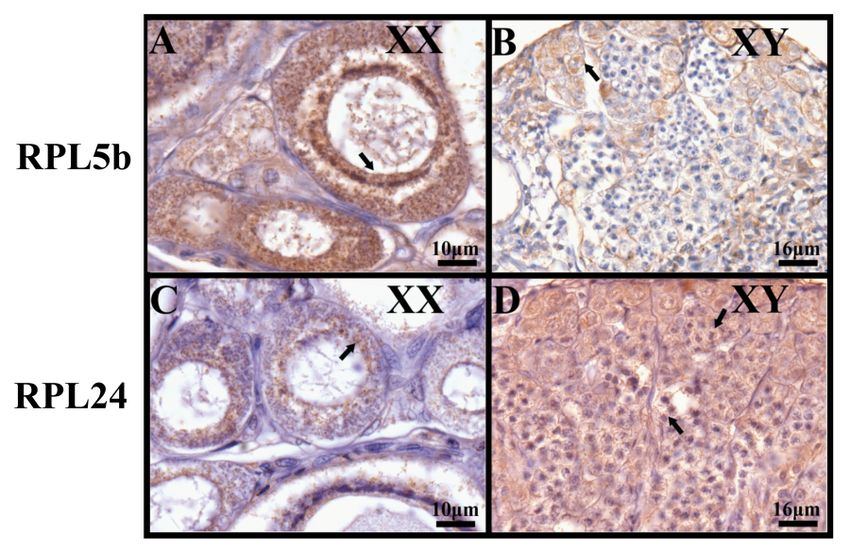
Figure 10. Sexually
Figure10. Sexually dimorphic
dimorphic expression
expression ofofRPL5b
RPL5bandandRPL24
RPL24 in in tilapia
tilapia ovaryovary
and and
testistestis
by by
immunohistochemistry.
immunohistochemistry. Samples
Sampleswere
weretaken
taken at
at 120 dah.Signals
120 dah. Signalsofof RPL5b
RPL5b were
were observed
observed mainly
mainly in in
the cytoplasm
the cytoplasm of oocytes
of oocytes in in
thethe ovary(A),
ovary (A),while
while weak
weak signals
signalswere
were detected
detected in the spermatocytes
in the spermatocytesin in
the testis (B). In contrast, very weak signals of RPL24 were observed in the cytoplasm
the testis (B). In contrast, very weak signals of RPL24 were observed in the cytoplasm of oocytes in of oocytes in
the ovary
the ovary (C), (C), while
while strong
strong signalswere
signals weredetected
detected ubiquitously
ubiquitouslyinindifferent spermatogenic
different spermatogenic cells cells
(D). (D).
Black arrows indicate positive signals. Scale bar, A and C, 10 μm; B and
Black arrows indicate positive signals. Scale bar, A and C, 10 µm; B and D, 16 µm. D, 16 μ m.
3. Discussion
3.1. Evolution of RP Genes in Chordates
In prokaryotic genomes, RP genes were found to be clustered in operons [32]. In the ArabidopsisInt. J. Mol. Sci. 2020, 21, 1230 14 of 21
3. Discussion
3.1. Evolution of RP Genes in Chordates
In prokaryotic genomes, RP genes were found to be clustered in operons [32]. In the Arabidopsis
genome, RP genes were reported not to be uniformly distributed with much higher density in several
regions [33]. In rice, the RPS genes were found to be distributed throughout the rice genome. Both arms
of the chromosome randomly carried the RPS genes. Each chromosome carried at least one member
of the RPS gene family [34]. In humans, RP genes are widely scattered across the genome, both sex
chromosomes and 20 autosomes (all but chromosomes 7 and 21) were found to carry one or more RP
genes [15]. In the present study, the complete set of 92RP genes were randomly distributed throughout
the tilapia genome, with each LG carrying one or more genes, similar to the RP gene distribution
pattern observed in rice and humans.
Ribosomal proteins are indispensable in ribosome biogenesis and protein synthesis, and play
a crucial role in diverse developmental processes. The rapid development of genome sequencing
and bioinformatics has increased the availability of complete sets of RPs for a wide range of species,
which allowed their application in phylogenetic analysis [35–38]. The identification and characterization
of the RPs in channel catfish, Senegalese sole and Atlantic halibut add more molecular markers for
studying genome evolution and phylogenetic relationships in teleosts [16–19]. However, the exact
number of RP genes in chordates, especially in teleosts, has not been fully understood yet. In this work,
we identified 79, 64, 86, 84, 83, 80, 85, 125, 90, 148, 88, 92 and 86 RP genes in the sea squirt, lamprey,
coelacanth, human, mouse, spotted gar, zebrafish, common carp, channel catfish, Atlantic salmon,
medaka, tilapia and fugu genome, respectively. We also updated the number of the RP genes from
80 [15] to 84in humans because of the isolation of four more paralogs of RPS27, RPL3, RPL7 and RPL22
from the human genome. These results revealed that the number of RP genes does not change much
in chordates following 2R and 3R events, and significant expansion of RP genes is only observed in
teleost fishes with 4R. This work should serve as a basis to allow comparative analysis of genome
evolution and function of RP genes inchordates, especially in teleosts.
Four rounds of large-scale genome duplications (referred to as 1R, 2R, 3R and 4R) shaped genome
evolution in fish [39,40]. Whole genome duplication events, followed by deletion or decay of some of
the RP genes, are the major contributors to the diversity of models of evolution of RP genes. RP genes,
which are highly expressed, exist in many copies and are essential for ribosomal function [41,42].
Different gene copies have been described for some RPs in fish. For example, channel catfish have
two paralogous genes for RPL5, RPS26 and RPS27 [16,17]. In Senegalese sole, two paralogous genes
for RPL13A, RPL19 and RPS27, as well as three different RPL22 genes have been identified. In
Atlantic halibut, two paralogous genes for RPL3, RPL7, RPL19, RPL22, RPL41and RPLP2, and four
different RPS27 genes were identified [18,19]. In the present study, paralogous genes for10RP types
were identified in tilapia genome, of which RPL3, RPL5, RPL7, RPL19, RPL22, RPL41, RPLP2, RPS17
and RPS27 paralogs could be found in most fish species, including channel catfish, Senegalese sole
and Atlantic halibut. We newly identified RPS19 paralogs in tilapia, which were also detected in
other species from Percomorpha but not in other teleosts, indicating that they are derived from
lineage-specific duplication.
RPL3 and RPL7 could have originated from 2R duplications since a two-branch tree topology
containing the fish and tetrapod counterparts was observed. The 3R duplication would explain the
RPL22-1 paralogs (RPL22-1a and RPL22-1b) observed in tilapia and other teleosts, which is closely
phylogenetically related to RPL22-1 found in species without 3R and to RPL22-2 derived from 2R.
RPL5, RPL19 and RPS17 obtained a paralogfrom3R duplication in teleosts [17,19], and one more
for RPL5 in Atlantic salmon and rainbow trout with 4R. Although the previous study indicated the
RPS27 gene as a mammalian-specific isoform [43], the identification of four RPS27 genes in tilapia
supports the hypothesis of two RPS27 paralogs in tetrapod and at least two in fish as a common feature.
The two additional paralogousRPS27genes might have appeared in the 3R or fish-specific genomeInt. J. Mol. Sci. 2020, 21, 1230 15 of 21
duplication [16,18]. Both of the two paralogs in tetrapods seem to have duplicated in teleosts, making
four RPS27 genes more likely where a few species have lost some of these four. This was further
supported by the isolation of eight RPS27 genes in species with 4R. In summary, most of the duplicated
RP genes from 2R were lost, but four of them, including paralogs of RPL3, RPL7, RPL22 and RPS27,
were retained in vertebrates including human. Two of them (RPL22 and RPS27) even experienced 3R
and retained 3 to 4 copies in teleosts. Taken together, our data clearly support the birth-and-death
model for the evolution of RP genes.
3.2. Possible Roles of RP Genes in Different Tissues, Especially in Gonads
Spatial and temporal gene expression patterns are important for understanding gene regulation
and function [44,45]. RPs are key components of the translational machinery responsible for protein
synthesis in all cells, and thereby participate in multiple cellular processes including growth and
development [46,47]. In zebrafish, RP genes were found to be expressed in a model of continuous
coordinate increase from the onset of mid-blastula transition to hatching [6,48]. In Atlantic halibut,
expression levels of 40 and 41 RPs were increased from embryos to 1-day-old yolk sac larvae and in
fast skeletal muscle in juveniles, respectively [49]. In channel catfish, Senegalese sole and Atlantic
halibut, the expression profiles of RP genes in tissues have been shown to be associated with the protein
biosynthetic requirements and cellular demands [16–19]. In the present study, transcriptomic analysis
revealed that the RP genes expressed in all tissues examined, but their expression levels differed among
different tissues in tilapia, indicating their essential roles in various physiological processes.
To date, there are a few researches focused on the roles of RPs involved in gonad differentiation and
development. In Chinese mitten crab, RPS27 and RPL40 were found to play key roles in gametogenesis
and reproductive success [50]. In the present study, RP gene expression profile was obtained from
transcriptome analyses of the gonad samples from tilapia at 5, 30, 90 and 180 dah, which represent sex
determination and differentiation, initiation of germ cell meiosis in ovary, initiation of germ cell meiosis
in testis, and vitellogenesis in ovary and sperm maturation in testis, respectively [30]. In tilapia gonads,
most RP genes were highly expressed, and some of them displayed sexually dimorphic expression at
different stages of development. At 5 dah, the number and expression levels of differentially expressed
RP genes were higher in XX than XY gonads. At 30 dah, all RP genes except one displayed no significant
differences between XX and XY gonads. At 90 and 180 dah, the number and expression levels of
differentially expressed RP genes were higher in XY than XX gonads. The expression profile of RP
genes in XX and XY gonads is similar to that of the steroidogenic enzyme genes and clearly associated
with the biosynthesis of different numbers and types of proteins needed for gonadal differentiation and
development, as revealed by gonadal transcriptomic analyses [30]. In addition, 11 RP genes displayed
sexually dimorphic expression (phenotype dependent as revealed by analysis of the sex-reversed fish)
in gonads with 9 (RPL7-1, RPL8, RPL11, RPL14, RPL18, RPL23A, RPL24, RPS5 and RPS24) expressed
higher in XY gonad and 2 (RPL5b and RPS27-1b) higher in XX gonad at all stages examined. qRT-PCR
and IHC of RPL5b and RPL24 validated the transcriptome data. The sexually dimorphic expression
of these 11 RP genes at 5 dah indicates that they may play a crucial role in sex differentiation in
tilapia. Furthermore, RPL7-1, RPL8, RPL11, RPL14, RPL18, RPL23A, RPL24, RPS5 and RPS24 may
play important roles in the development of testis and spermatogenesis, while RPL5b and RPS27-1b
may play important roles in the development of ovary and oogenesis. Sex-specific expression of
translation elongation factors eEF1α1b in the testis and 42Sp50 in the ovary have been reported in
frogs and several fish species, including tilapia [51–54]. Taken together, these results indicate that the
gonad tightly controls its biosynthesis machinery to meet the needs of proteins required for oogenesis
and spermatogenesis.Int. J. Mol. Sci. 2020, 21, 1230 16 of 21
4. Materials and Methods
4.1. Animal Rearing
Nile tilapia fishes used in this study were reared in recirculating freshwater tanks at 26◦ C and
under natural photoperiod. Animal experiments were performed following the regulations of the
Guide for Care and approved by the Institutional Animal Care and Use Committee of Southwest
University (No. IACUC-20181015-12, 15 October 2018).
4.2. Identification of RP genes from different chordates
The genomes of 13 species (sea squirt, lamprey, coelacanth, human, mouse, spotted gar, zebrafish,
common carp, channel catfish, Atlantic salmon, medaka, tilapia and fugu) were examined to identify
RP genes in each species. The genomic sequences of all species are available at the NCBI(https:
//www.ncbi.nlm.nih.gov/) and Ensembl (http://asia.ensembl.org/index.html) database. All RP genes
were identified by tblastn (E = 2e−5 ) against genome sequences, using zebrafish and human RP proteins
as the query sequences. The identified RP genes were named according to the principle described
in the previous study [55]. Genomic distribution of RP genes was performed using NCBI and UCSC
(http://genome.ucsc.edu/) databases.
4.3. Phylogenetic and Syntenic Analyses
Sequences were analyzed using the EditSeq and Megalign program with the Laser gene sequence
analysis software package (DNAStar, Madison, WI, USA). Both amino acid and nucleotide sequences
were used, and both maximum-likelihood (ML) and neighbor-joining (NJ) analyses were carried out
for RP genes using MEGA 6.0 software (Tempe, AZ, USA) [56]. Phylogenetic trees for the small and
large subunit RPs were generated by ML method with the amino acid sequences. Phylogenetic trees of
the paralogous RP genes were constructed by NJ method with DNA sequences from a wide range
of species. The degree of confidence assigned to nodes in trees was achieved by bootstrapping with
1000 replicates.
For syntenic analysis, position and orientation of RP genes and their adjacent genes on the
chromosome were determined using Genomicus (available online: http://www.genomicus.biologie.
ens.fr/genomicus-89.01/cgi-bin/search.pl) [53].
4.4. Expression Analyses of Tilapia RP Genes in Adult Tissues and Gonads at Different Developmental Stages
The transcriptomes of eight tissues from adult tilapia, including brain, heart, liver, ovary, testis,
kidney, muscle and head kidney (Accession codes: PRJNA78915 and SRR1916191) [28], four pairs
of XX and XY gonads from tilapia at 5, 30, 90, and 180 dah (Accession codes: SRA055700) [30] were
downloaded from the NCBI database. Gonadal transcriptomes of control and secondary sex reversal
(SSR) tilapia (Normal XX fish at 90 dah were fed a diet sprayed with 95% ethanol containing Fadrozole
at a concentration of 200 µg/g diet for 90 days, while the control XX and XY fish were fed a diet
sprayed with 95% ethanol but without Fadrozole) were reported by our previous study (Accession
codes: SRP014017) [31]. Genome-wide expression analysis of RNA-Seq data was performed by
TopHat2 v2.1.1 and Cufflinks [57]. RPKM was used to normalize the expression profile of RP genes.
Only those transcripts mapped to unique loci in the tilapia genome were used to calculate RPKM
values. Identification of XX/XY-enriched RP genes was performed as described previously [58,59].
Detection of genes differentially enriched was analyzed with Tbtools [60].
4.5. Validation of Differentially Expressed Genesby qRT-PCR and IHC
Two differentially expressed RP genes between ovaries and testes, RPL5b and RPL24, were selected
to perform qRT-PCR analyses. The results were compared with the transcriptome data. To perform
qRT-PCR, gonads were dissected from XX and XY tilapia at 5, 10, 20, 50, 70 and 180 dah, and total RNAInt. J. Mol. Sci. 2020, 21, 1230 17 of 21
was isolated from each sample and reverse-transcribed using MMLV reverse transcriptase (Invitrogen,
Carlsbad, CA, U.S.A.) according to the manufacturer’s protocol. Gene-specific primers, RPL5b-F
50 - CCTGGTGCCTTCACGTGTTA-30 , RPL5b-R 50 - GTAGCCGGGGAAACGTTTC-30 , RPL24-F 50 -
CCGATACGCCAGGATAGACG-30 , RPL24-R 50 - CCTTCTTGTGCTTGCGTCTG-30 , were used for
qRT-PCR. qRT-PCR examination was performed according to the manufacturer’s protocol using the
SYBR Green I Master Mix (TaKaRa, Dalian, China). Tilapia eef1a1a was used as internal control
to normalize the expression of these two genes. The relative abundance ofmRNA transcripts was
evaluated using the formula R = 2−∆∆Ct , as described previously [61]. Data are expressed as mean ±
SD for triplicates. The statistical package GraphPad Prism (GraphPad Software, Inc. San Diego, CA,
USA) was used to analyze data from qRT-PCR experiments. One-way ANOVA followed by posthoc
test was performed to determine the significance. p < 0.05 was considered to be significantly different.
To validate which population of cells in the developing gonads expressed RPL5b and RPL24,
IHC was performed using ovaries and testes from tilapia at 120 dah. Gonads were dissected, fixed
in Bouin’s solution at room temperature overnight, embedded in paraffin and sectioned at 5 µm
thickness. Paraffin sections were de-paraffinized and hydrated. The primary antibodies anti-mouse
RPL5b(ARP56126_P050) and RPL24(ARP65377_P050) were purchased from AVIVA (Beijing AVIVA
Systems Biology, Beijing, China). After overnight incubation with freshly diluted primary antibody
(1000 times dilution) at 4 ◦ C, the slides were washed twice in 1×PBS (phosphate-buffered saline)
for 10 min, and then, incubated with anti-mouse IgG at room temperature for 1 h. After washing,
3,30 -diaminobenzidine tetrahydrochloride was applied for the color reaction, the slides were then
counterstained in hematoxylin, dehydrated and mounted [62].
5. Conclusions
Comparative analyses of the RP genes in tilapia and other chordates provide a clear perspective
on the evolution of RP genes. The number of the RP genes does not change much in vertebrates
following 2R and 3R events, and significant expansion of RP genes was only observed in teleost fishes
with 4R. The RP genes were found to be expressed in all tissues examined, but their expression levels
differed among different tissues in tilapia, indicating their essential roles in various physiological
processes. In addition, we also found, for the first time, that some of them displayed sexually dimorphic
expression in developing gonads in fish. Taken together, these results present a new perspective to
understand the evolution and function of RP genes in chordates and even other organisms. Future
functional characterization of these RP genes with sexually dimorphic expression in teleosts will help
us to better understand their important roles in sex differentiation and gonad development.
Supplementary Materials: Supplementary materials can be found at http://www.mdpi.com/1422-0067/21/4/1230/s1.
Author Contributions: Conceptualization, G.K. and D.W.; formal analysis, G.K., W.T., S.Z. and X.W.; methodology,
G.K., W.T., S.Z. and X.W.; project administration, D.W.; software, W.T., S.Z. and X.W.; supervision, D.W.; validation,
G.K.; writing—review and editing, G.K. and D.W. All authors have read and agreed to the published version of
the manuscript.
Funding: This research was funded by National Natural Science Foundation of China: 31861123001, 31630082,
31872556 and 31972778; Yunnan Science and Technology project: 2018IB019.
Acknowledgments: This work was supported by grants 31861123001, 31630082, 31872556 and 31972778 from the
National Natural Science Foundation of China; grant 2018IB019 from Yunnan Science and Technology project.
Conflicts of Interest: The authors declare no conflict of interest.Int. J. Mol. Sci. 2020, 21, 1230 18 of 21
Abbreviations
RP ribosomal protein
WGD whole genome duplication
1R first round of genome duplication
2R second round of genome duplication
3R third round of genome duplication
4R fourth round of genome duplication
qRT-PCR quantitative real time polymerase chain reaction
IHC Immunohistochemistry
ML maximum-likelihood
NJ neighbour-joining
dah day after hatching
RPKM reads per kb per million reads
References
1. McCann, K.L.; Baserga, S.J. Mysterious ribosome pathies. Sicence 2013, 341, 849–850. [CrossRef] [PubMed]
2. Bolze, A.; Mahlaoui, N.; Byun, M.; Turner, B.; Trede, N.; Ellis, S.R.; Abhyankar, A.; Itan, Y.; Patin, E.; Brebner, S.
Ribosomal protein SA haploinsufficiency in humans with isolated congenital asplenia. Science 2013, 340,
976–978. [CrossRef] [PubMed]
3. Das, P.; Basu, A.; Biswas, A.; Poddar, D.; Andrews, J.; Barik, S.; Komar, A.A.; Mazumder, B. Insights into the
mechanism of ribosomal incorporation of mammalian L13a protein during ribosome biogenesis. Mol. Cell
Biol. 2013, 33, 2829–2842. [CrossRef] [PubMed]
4. Anand, P.; Gruppuso, P.A. Rapamycin inhibits liver growth during refeeding in rats via control of ribosomal
protein translation but not cap-dependent translation initiation. J. Nutr. 2006, 136, 27–33. [CrossRef]
[PubMed]
5. Kowalczyk, P.; Woszczynski, M.; Ostrowski, J. Increased expression of ribosomal protein S2 in liver tumors,
posthepactomized livers, and proliferating hepatocytes in vitro. Acta. Biochim. Pol. 2002, 49, 615–624.
[CrossRef] [PubMed]
6. Mathavan, S.; Lee, S.G.P.; Mak, A.; Miller, L.D.; Murthy, K.R.K.; Govindarajan, K.R.; Tong, Y.; Wu, Y.L.;
Lam, S.H.; Yang, H.; et al. Transcriptome analysis of zebrafish embryogenesis using microarrays. PLoS Genet.
2005, 1, 260–276. [CrossRef]
7. Dutt, S.; Narla, A.; Lin, K.; Mullally, A.; Abayasekara, N.; Megerdichian, C.; Wilson, F.H.; Currie, T.;
Khanna-Gupta, A.; Berliner, N. Haploinsufficiency for ribosomal protein genes causes selective activation of
p53 in human erythroid progenitor cells. Blood 2011, 117, 2567–2576. [CrossRef]
8. Dionne, K.L.; Bergeron, D.; Landry-Voyer, A.M.; Bachand, F. The 40S ribosomal protein uS5 (RPS2) assembles
into an extraribosomal complex with human ZNF277 that competes with the PRMT3-uS5 interaction. J. Biol.
Chem. 2019, 294, 1944–1955. [CrossRef]
9. Burwick, N.; Coats, S.A.; Nakamura, T.; Shimamura, A. Impaired ribosomal subunit association in
Shwachman-Diamond syndrome. Blood 2012, 120, 5143–5152. [CrossRef]
10. van Gijn, D.R.; Tucker, A.S.; Cobourne, M.T. Craniofacial development: Current concepts in the molecular
basis of Treacher Collins syndrome. Br. J. Oral. Max. Surg. 2013, 51, 384–388. [CrossRef]
11. Shenoy, N.; Kessel, R.; Bhagat, T.D.; Bhattacharyya, S.; Yu, Y.T.; Mcmahon, C.; Verma, A. Alterations in
the ribosomal machinery in cancer and hematologic disorders. J. Hematol. Oncol. 2012, 5, 32. [CrossRef]
[PubMed]
12. Lai, K.; Amsterdam, A.; Farrington, S.; Bronson, R.T.; Hopkins, N.; Lees, J.A. Many ribosomal protein
mutations are associated with growth impairment and tumor predisposition in zebrafish. Dev. Dyn. 2009,
238, 76–85. [CrossRef] [PubMed]
13. Duan, J.; Ba, Q.; Wang, Z.; Hao, M.; Li, X.; Hu, P.; Zhang, D.; Zhang, R.; Wang, H. Knockdown of ribosomal
protein S7 causes developmental abnormalities via p53 dependent and independent pathways in zebrafish.
Int. J. Bioche. Cell Biol. 2011, 43, 1218–1227. [CrossRef] [PubMed]
14. Wool, I.G.; Chan, Y.L.; Gluck, A. Structure and evolution of mammalian ribosomal proteins. Biochem. Cell
Biol. 1995, 73, 933–947. [CrossRef]You can also read