The genome sequence of celery (Apium graveolens L.), an important leaf vegetable crop rich in apigenin in the Apiaceae family - Nature
←
→
Page content transcription
If your browser does not render page correctly, please read the page content below
Li et al. Horticulture Research (2020)7:9
                                    https://doi.org/10.1038/s41438-019-0235-2
                                                                                                                                                                                         Horticulture Research
                                                                                                                                                                                                     www.nature.com/hortres

                                     ARTICLE                                                                                                                                                    Open Access

                                    The genome sequence of celery (Apium graveolens
                                    L.), an important leaf vegetable crop rich in
                                    apigenin in the Apiaceae family
                                    Meng-Yao Li1, Kai Feng1, Xi-Lin Hou1, Qian Jiang1, Zhi-Sheng Xu1, Guang-Long Wang1, Jie-Xia Liu1, Feng Wang1 and
                                    Ai-Sheng Xiong1

                                      Abstract
                                      Celery (Apium graveolens L.) is a vegetable crop in the Apiaceae family that is widely cultivated and consumed because
                                      it contains necessary nutrients and multiple biologically active ingredients, such as apigenin and terpenoids. Here, we
                                      report the genome sequence of celery based on the use of HiSeq 2000 sequencing technology to obtain 600.8 Gb of
                                      data, achieving ~189-fold genome coverage, from 68 sequencing libraries with different insert sizes ranging from
                                      180 bp to 10 kb in length. The assembled genome has a total sequence length of 2.21 Gb and consists of 34,277
                                      predicted genes. Repetitive DNA sequences represent 68.88% of the genome sequences, and LTR retrotransposons are
                                      the main components of the repetitive sequences. Evolutionary analysis showed that a recent whole-genome
                                      duplication event may have occurred in celery, which could have contributed to its large genome size. The genome
                                      sequence of celery allowed us to identify agronomically important genes involved in disease resistance, flavonoid
                                      biosynthesis, terpenoid metabolism, and other important cellular processes. The comparative analysis of apigenin
                  1234567890():,;
1234567890():,;
                  1234567890():,;
1234567890():,;

                                      biosynthesis genes among species might explain the high apigenin content of celery. The whole-genome sequences
                                      of celery have been deposited at CeleryDB (http://apiaceae.njau.edu.cn/celerydb). The availability of the celery
                                      genome data advances our knowledge of the genetic evolution of celery and will contribute to further biological
                                      research and breeding in celery as well as other Apiaceae plants.

                                    Introduction                                                                                        contains flavonoids, carotenoids, terpenoids, and unsatu-
                                       Celery (Apium graveolens L.) is an annual or biennial                                            rated fatty acids that exhibit biological activity and phy-
                                    herbaceous plant in the Apiaceae family that originated in                                          siological functions in human beings1–4.
                                    the Mediterranean and the Middle East. It is a popular                                                Flavonoids are a class of natural products that are
                                    vegetable crop and is widely cultivated in Europe, East                                             widely found in plants, most of which exist in the form of
                                    Asia, southeastern Oceania, and southern Africa (Fig. 1a).                                          glycosides. Vegetables and fruits are the predominant
                                    The whole celery plant exhibits aromatic flavor, and                                                 dietary sources of flavonoids. Flavonoids are one of the
                                    its leaf blades and petioles are the main edible organs                                             most important types of secondary metabolites in celery,
                                    (Fig. 1b). In addition to containing common nutrients                                               mainly comprising apigenin, kaempferol, quercetin, and
                                    such as vitamins, proteins and carbohydrates, celery                                                luteoli5. In particular, the content of apigenin in celery is
                                                                                                                                        higher than that in other plants6. Many studies on the
                                                                                                                                        isolation, identification, and application of flavonoids in
                                    Correspondence: Ai-Sheng Xiong (xiongaisheng@njau.edu.cn)                                           celery have been carried out4,7,8. Apigenin and luteolin
                                    1
                                     State Key Laboratory of Crop Genetics and Germplasm Enhancement, Ministry                          exhibit a wide range of pharmacological effects, including
                                    of Agriculture and Rural Affairs Key Laboratory of Biology and Germplasm
                                                                                                                                        anti-bacterial, anti-oxidation, and cardiovascular protec-
                                    Enhancement of Horticultural Crops in East China, College of Horticulture,
                                    Nanjing Agricultural University, 1 Weigang, Nanjing 210095, China                                   tive effects9,10. Many terpenoids and aromatic compounds
                                    These authors contributed equally: Meng-Yao Li, Kai Feng

                                    © The Author(s) 2020
                                                        Open Access This article is licensed under a Creative Commons Attribution 4.0 International License, which permits use, sharing, adaptation, distribution and reproduction
                                                        in any medium or format, as long as you give appropriate credit to the original author(s) and the source, provide a link to the Creative Commons license, and indicate if
                                    changes were made. The images or other third party material in this article are included in the article’s Creative Commons license, unless indicated otherwise in a credit line to the material. If
                                    material is not included in the article’s Creative Commons license and your intended use is not permitted by statutory regulation or exceeds the permitted use, you will need to obtain
                                    permission directly from the copyright holder. To view a copy of this license, visit http://creativecommons.org/licenses/by/4.0/.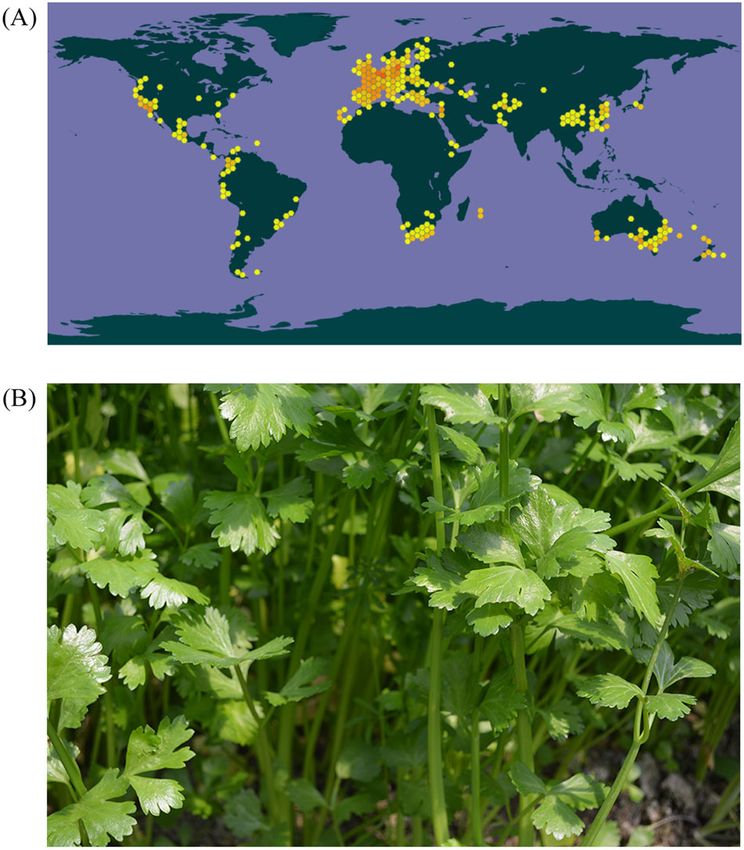
Li et al. Horticulture Research (2020)7:9                                                                                Page 2 of 10

                                                                       the celery genome provides information on the overall
                                                                       organization, gene content, and structural components of
                                                                       the DNA. Transcription factors, disease resistance genes,
                                                                       apigenin and terpenoid biosynthesis-related genes, and
                                                                       other functional genes were also identified in this study.
                                                                       All of the data not only provide valuable resources for
                                                                       basic and applied research on celery but also lay the
                                                                       foundation for the analysis of the evolution and com-
                                                                       parative genomics of celery and Apiaceae species.

                                                                       Materials and methods
                                                                       Plant material, DNA preparation, and genome sequencing
                                                                          The celery material used in this study was the highly
                                                                       inbred line Q2-JN11, which was derived via the forced
                                                                       selfing of “Jinnan Shiqin”. The seeds of Q2-JN11 were
                                                                       collected in the State Key Laboratory of Crop Genetics
                                                                       and Germplasm Enhancement, Nanjing Agricultural
                                                                       University, China. High-quality genomic DNA was
                                                                       extracted from the young leaves of celery for genome
                                                                       sequencing using a modified CTAB method23.
                                                                          The genome was sequenced using the HiSeq 2000
                                                                       platform. Libraries with six different insert sizes (180 bp,
 Fig. 1 Georeferenced records and an image of celery.                  500 bp, 800 bp, 2 kb, 5 kb, and 10 kb) were prepared from
 a Georeferenced records of celery on the world map. b Image of        Q2-JN11 DNA and then sequenced according to standard
 celery. The data set was obtained from the GBIF website (www.gbif.    Illumina protocols at the Beijing Genomics Institute-
 org). The colored hexagons represent the locations of georeferenced   Shenzhen (BGI-Shenzhen).
 celery records.

                                                                       Genome assembly
are present in celery tissues, which contribute to its                   The raw reads generated from each library were pre-
unique fragrance. Some studies have shown that terpe-                  processed to facilitate their assembly. Low-quality reads were
noids from celery seed oil exert strong lethal effects on              filtered out, and reads with adapter contamination
Aedes aegypti11. Effective celery components such as                   were removed using CutAdapt24. The paired-end reads were
allergenic proteins, apigenin, and anthocyanin have                    assembled into contigs using SOAPdenovo2 (http://soap.
caused wide public concern12–15. However, the regulatory               genomics.org.cn/soapdenovo.html)25 with the multi-kmer
mechanisms of the effective components of celery remain                option (k-mer = 63). We then aligned all usable paired-
unclear.                                                               end reads onto the contig sequences and used mate-pair
  Whole-genome sequencing has overcome the limita-                     information on the order of the estimated insert size
tions of traditional basic research and generated massive              (180 bp to 10 kb) to construct scaffolds. Gaps within the
data that greatly promote research on plants. The genome               scaffolds were closed using GapCloser. BUSCO v3 was
sequence of Arabidopsis thaliana was completed and                     employed to measure the genome assembly using the
published in 2000, providing the first reported sequencing              Eudicotyledons        (odb10)     database    with     default
data for higher plants16. Since then, the genomes of many              parameters26.
species have been sequenced and published17–21. Apia-
ceae is one of the largest families of flowering plants, with           Gene prediction and annotation
~4000 species classified into 434 genera. The Apiaceae                    The presence of possible celery-specific transcripts
family contains several vegetable and spice crop species.              within a region was analyzed using Augustus 3.2.2 and
However, the lack of complete genome data places greatly               SNAP27,28. For similarity-based gene prediction, five
constrains the improvement of Apiaceae crops. The                      sequenced plants (A. thaliana, Mimulus guttatus, Sola-
molecular resources for Apiaceae species are under-                    num tuberosum, Solanum lycopersicum, and Daucus
developed. Thus far, a reported carrot genome represents               carota) were selected, and the protein sequences of these
the only genome data for the Apiaceae family20,22.                     species were downloaded from Phytozome v12 (http://
  In this paper, we report the genome sequence of celery,              www.phytozome.net). BLAST (identity ≥ 0.95; coverage ≥
which is one of the most economically important species                0.90) was used to identify ESTs, mRNAs, and proteins
of the Apiaceae family. The ~189× coverage sequence of                 with significant similarity to the celery genome sequence.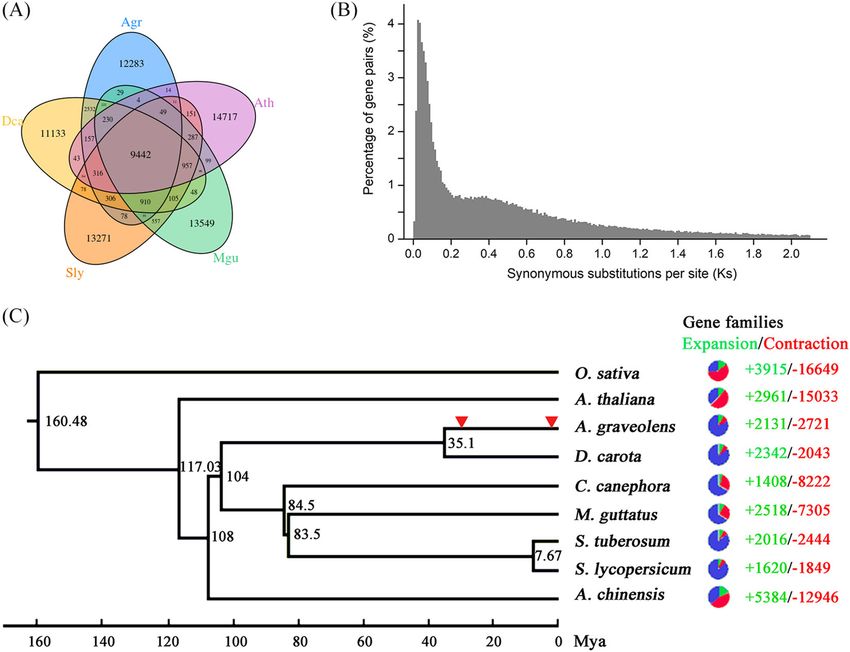
Li et al. Horticulture Research (2020)7:9                                                                       Page 3 of 10

The identity and coverage thresholds used in the align-          an inflation parameter of 1.5. To analyze the evolution of
ment were determined according to the methods                    gene families, CAFE was used to calculate the number of
employed for the carrot and potato genomes20,29. Manual          expansions and contractions of gene families41.
curation and several rounds of refinement using Exoner-
ate v.2.2.0 were performed to realign or polish the              Phylogenetic analysis
sequences following filtering and clustering30. The func-           To build the phylogenetic tree, redundant sequences
tional annotation of protein-coding genes was achieved           (90% identity or more) from the same organism were
using BLASTP (E value of 1 × 10⁻⁴) against the NCBI              removed using CD-HIT42. Then, homolog clusters were
non-redundant protein sequence (nr), TrEMBL, Swiss-              predicted by comparing each pair of the nine plant gen-
Prot, Gene Ontology (GO), and Kyoto Encyclopedia of              omes (A. graveolens, D. carota, M. guttatus, S. tuberosum,
Genes and Genomes (KEGG) databases31,32. Blast2GO33              S. lycopersicum, Oryza sativa, Coffea canephora, Actinidia
was used to obtain the relevant GO ID, and WEGO34 was            chinensis, and A. thaliana) using OrthoMCL. The protein
applied to illustrate the distribution of gene classifications.   sequences for clusters containing a single-copy gene of
                                                                 each species were aligned with MUSCLE v3.8.3143. Then,
Noncoding RNAs                                                   positions showing poor alignment were eliminated with G
  Noncoding RNAs were identified by searching against             blocks (version 0.91b). All alignments were subsequently
various RNA libraries. tRNA scan-SE (version 1.3.1) was          concatenated to one super alignment. The phylogeny was
employed to search for reliable tRNA positions35. Small          reconstructed by the neighbor-joining method using the
nuclear RNAs (snRNAs) and microRNAs (miRNAs) were                Jones-Taylor-Thornton model44. The reliability of the tree
searched via a two-step method involving initial align-          topology was measured by bootstrapping (1000 replica-
ment with BLAST followed by searching with INFER-                tions). Evolutionary analysis was conducted in MEGA745.
NAL36 against the Rfam database (v12.0)37.                       The species divergence time in the phylogenetic tree was
                                                                 estimated via the Bayesian relaxed molecular clock
Repetitive elements                                              (BRMC) method using the program MULTIDIVTIME,
  Transposable elements in the celery assembly were              which was implemented in the Thornian Time Traveller
identified using a combination of homology-based and              (T3) package46,47. To estimate the synonymous substitu-
de novo approaches. The known repetitive elements                tions per synonymous site (Ks), all paralogous gene pairs
were identified with RepeatMasker (version 3.3.0) against         were analyzed with the maximum likelihood method in
the Repbase library38. RepeatModeler (http://www.                the PAML program48.
repeatmasker.org/RepeatModeler.html) was then used
after masking the known repetitive elements. The con-            Transcription factors
sensus sequences generated with RepeatModeler were                 Reference information was collected from PlnTFDB49,
searched against the SWISS-PROT database using                   an integrated plant transcription factor database including
BLASTX, and consensus sequences with significant                  genes from A. thaliana, Populus trichocarpa, and Oryza
similarity to protein-coding genes were eliminated.              sativa (http://plntfdb.bio.uni-potsdam.de). For each tran-
Finally, RepeatMasker was run on the genome sequences            scription factor family, conserved domains were used as
using the consensus sequence as a library.                       queries for searching similar sequences in the celery
                                                                 genome. The protein domains of the identified tran-
Gene family analysis                                             scription factors were classified using the Pfam database.
  We used OrthoMCL to define a gene family as a group
of genes descending from a single gene in the last com-          Functional genes
mon ancestor of the considered species39. The protein-             Celery resistance-related genes were identified based on
coding genes of M. guttatus v2.0, S. lycopersicum                the most conserved motif structures of plant resistance
iTAG2.4, D. carota v2.0, and A. thaliana TAIR10 were             proteins, including coiled coil (CC), Toll/Interleukin-1
downloaded from Phytozome v12 (http://www.                       receptor (TIR), nucleotide-binding site (NBS), and
phytozome.net)40. The longest protein sequence predic-           leucine-rich repeat (LRR) finger domains. Conserved
tion was employed to perform all-against-all comparisons         motifs were derived from domain profiles retrieved from
using BLASTP. All protein sequences were compared                the PFAM, PANTHER, PRINTS, PROSITE, SMART, and
against a database containing protein data sets for all the      SUPERFAMILY databases. PAIRCOIL2 was used to spe-
species under an E value of 1 × 10⁻⁵. The BLASTP results         cifically detect CC domains.
were further filtered if the aligned region length was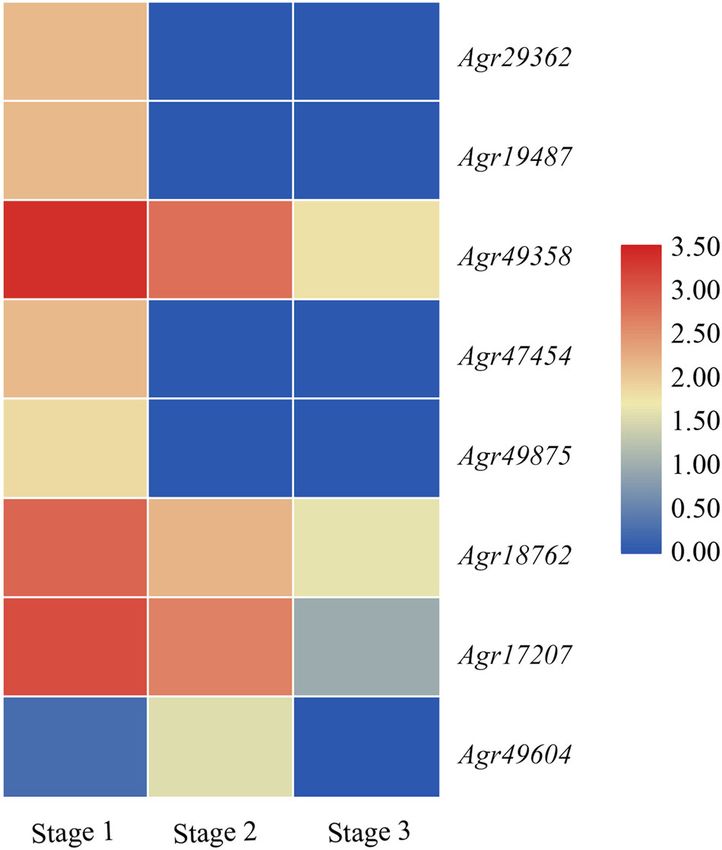
Li et al. Horticulture Research (2020)7:9                                                                       Page 4 of 10

were further submitted to the NCBI database to obtain          Arabidopsis (36.06%), and tomato (34.05%) but lower than
gene function information. Terpenoid synthase (TPS)            those in tea tree (42.31%) and rice (43.57%) (Supple-
proteins were identified by screening the celery genome         mentary Table S4).
sequences using HMMER3.0 software with domain
models PF03936 and PF01397 as queries50.                       Repetitive sequence analysis
                                                                 De novo repeat identification using RepeatMasker and
Data access                                                    homology analysis against the RepBase library showed
  The whole-genome sequences of celery have been               that repetitive DNA (excluding low-complexity sequen-
deposited at CeleryDB under accession version 1.051. The       ces) accounted for 68.88% of the genome. The classifica-
genome data can be accessed at http://apiaceae.njau.edu.       tion of the observed transposable elements into known
cn/celerydb.                                                   classes revealed that the majority of repetitive sequences
                                                               were LTR retrotransposons (44.07%), whereas 3.30% and
Results                                                        2.76% of the repeat element types were DNA transposons
Genome sequencing and assembly                                 and simple repeat elements, respectively (Table 3).
   For celery genome sequencing, a total of 68 genomic           The fraction of repetitive sequences in the celery gen-
libraries with three small insert sizes (180 bp, 500 bp, and   ome (68.88%) was higher than that in the carrot (45.95%)
800 bp) and three large insert sizes (2 kb, 5 kb, and 10 kb)   and physic nut genomes (49.81%) but lower than that
were prepared. We generated raw sequences from the             detected in the genomes of tea tree (80.89%) and ginkgo
next-generation sequencing platform HiSeq 2000. After          (76.58%) (Supplementary Table S5). In comparison,
filtering, a total of 600.8 Gb of clean data were obtained      celery, tea tree, and ginkgo exhibit larger genome sizes
from the paired-end libraries with different insert sizes      than carrot and physic nut. In addition, LTRs occupied
(Supplementary Table S1). The genome size was esti-            the absolute dominant position among the repetitive
mated to be 3.18 Gb based on the 17-mer depth dis-             sequences of these five plants. In this study, the activity of
tribution (Supplementary Fig. S1 and Table S2). All clean      LTRs at the molecular level was analyzed. The amplifi-
data were assembled into contigs and scaffolds using           cation of celery LTR elements was relatively active
SOAP de novo, resulting in a final assembly of 2.21 Gb          ~2.5~ 4 Mya (million years ago) and 5 Mya, which was
with N50 sizes of 13,108 bp for contigs and 35,567 bp for      close to the recent whole-genome duplication (WGD)
scaffolds (Tables 1 and 2). The total clean data generated     event that occurred in celery 1.9 Mya (Supplementary Fig.
represented 188.93× coverage of the estimated celery           S2). Previous studies on sequenced plant genomes have
genome, and our assembly accounted for ~70% of the             shown that the proportion of repetitive sequences is one
estimated genome. The assembled genome exhibited               of most important factors affecting genome size52–54. The
highly complete Benchmarking Universal Single-Copy             recently inserted LTRs may be an important factor
Orthologs (BUSCO) (90.8%) (Supplementary Table S3).            affecting the size of the celery genome.
Compared with another Apiaceae species, carrot, the
genome size of celery is much greater. The percentage of       Gene prediction and annotation
the GC content in celery genome was 35.35%, which was            To predict protein-coding genes in the celery genome,
close to those in the genomes of carrot (34.80%),              de novo gene prediction programs and homology-based
                                                               methods were combined to assemble the results. We

Table 1 Statistics of the celery genome assembly.              Table 2 Statistics of the assembly size of the contigs and
                                                               scaffolds of celery.
Feature                                              Value
                                                               Property                       Contig             Scaffold
Genome size                                          2.21 Gb
Genome GC%                                           35.35%    Min sequence length (bp)       500                500
Gene number                                          34,277    Max sequence length (bp)       228,328            556,749
Gene no. per 100 kb                                  1.44      Total sequence number          432,762            257,842
Average gene length (bp)                             3267      N50 length (bp)                13,108             35,567
Exon region GC (%)                                   42.06%    N90 length (bp)                1136               4841
Exon number                                          180,591   N number                       648,982            280,637, 212
Average exon length (bp)                             243.48    N rate (%)                     0.031              11.8
Exon no. per gene                                    5.27      Total sequence length (bp)     2,017,581,028      2,372,941,895
Li et al. Horticulture Research (2020)7:9 Page 5 of 10
Table 3 Repeat element analysis in the celery genome. database, 9463 genes were assigned to KEGG metabolic
pathways.
Repeat elements Copies Repeat Percentage of the
Based on the pair-wise protein sequence similarities, we
(numbers) size (bp) assembled
carried out a gene family analysis of celery genes. A total
genome (%)
of 27,549 genes were clustered in 15,164 gene families
DNA transposon 157,948 78,298,900 3.30
with an average size of 1.82, and 6728 of these genes did
not exhibit homologous sequences (Supplementary Table
LINE 42,679 34,853,999 1.47
S7). The number of members in the gene families varied
Low complexity 174,767 9,739,053 0.41 greatly, and group 4 exhibited the largest number,
LTR/Copia 573,134 481,821,466 20.30 including 201 genes (Supplementary Fig. S4). The gene
LTR/Gypsy 605,914 519,802,870 21.91
ontology category analysis showed that the gene families
that contained the most members were widely involved in
LTR/others 58,772 44,248,275 1.86
biological processes such as cell recognition, serine-type
SINE 4272 454,864 0.02 endopeptidase activity, flavin adenine dinucleotide bind-
Satellite 7993 8,983,101 0.38 ing, protein phosphorylation, and zinc ion binding (Sup-
Simple repeat 860,188 65,493,490 2.76
plementary Table S8). For the analysis of the specific and
shared gene families among species, conserved putative
Unknown 453,513 390,743,993 16.47
genes from five plants were used to identify gene family
Total 2,939,180 1,634,440,011 68.88 clusters. Among the total 81,793 clusters, 9442 clusters
were observed in all investigated species, and 12,283
appeared to be lineage specific to celery, whereas 13,934
Table 4 Number of noncoding RNAs in the celery were shared with D. carota, 10,224 with A. thaliana,
genome. 11,168 with S. lycopersicum, and 10,940 with M. guttatus
(Fig. 2a). The celery-specific genes were analyzed on the
Type Number Size (bp) Average Percentage of
basis of the results of gene prediction and annotation
length (bp) genome (%)
(Supplementary Table S9). A total of 783 celery-specific
miRNA 116 14,759 127.23 0.00062 genes corresponded to 1456 annotation results, which
were divided into 155 GO terms.
tRNA 891 67,306 75.54 0.00284
rRNA 374 321,240 858.93 0.01354 Celery-specific transcription factors and disease resistance-
snRNA 8,878 938,847 105.75 0.00396 related genes
Within the celery genome, the percentage of tran-
scription factors (4.95%) was slightly greater than that in
predicted 34,277 genes with an average length of 3267 bp the rice genome (4.80%) but lower than those in carrot
and a mean of 5.27 exons per gene in the celery genome (8.41%), Arabidopsis (7.00%), and tomato (7.09%). In the
(Table 1 and Supplementary S4). Compared with other celery genome, there are six transcription factor families
species, the celery gene number was similar to that of (FAR1, ERF, MYB, MYB-related, bHLH, and NAC) that
tomato (34,727), larger than those of Arabidopsis (27,416) contain >100 members. A total of 184 celery-specific
and carrot (32,113), and lower than those of tea tree transcription factors were identified from the 1698 puta-
(36,951) and rice (57,939) (Supplementary Table S4). In tive transcription factors of celery, which were classified
addition to protein-coding genes, we identified 891 tRNA, into 12 transcription factor families (Fig. S5). Similar to
116 miRNA, 374 rRNA, and 8878 snRNA genes in the the percentage of total transcription factors in the celery
celery genome, which constituted ~0.021% of the genome genome, the FAR1 (59%) family yielded the largest
sequences (Table 4). number of celery-specific transcription factors. NAC was
A sequence similarity search was performed against the second largest family of celery-specific transcription
public databases to investigate putative functions. A total factors, with 28 members. The number of celery-specific
of 34,143 genes were annotated using the Nr, InterPro, transcription factors in both the MYB family and the
GO, and KEGG databases (Supplementary Table S6). MYB-related family was 10.
Based on the GO database, 16,920 genes were annotated Celery encounters various forms of environmental
to three gene ontology classes: biological process, cellular stress, including a wide range of pests and pathogens that
component, and molecular function, with 1223 functional negatively affect celery growth and yield. A variety of
terms (Fig. S3). The most-frequent functional clusters in disease resistance-related genes are induced to respond to
the celery genome were protein binding, ATP binding and stresses and to increase celery tolerance. NBS and
oxidation-reduction processes. By mapping to the KEGG carboxy-terminal LRR domains are found in the majorityLi et al. Horticulture Research (2020)7:9 Page 6 of 10
Fig. 2 Comparative genomic and phylogenetic relationship analyses. a Venn diagram showing the cluster distribution of shared gene families
among A. graveolens (Agr), M. guttatus (Mgu), S. lycopersicum (Sly), D. carota (Dca), and A. thaliana (Ath). b Ks distribution of paralogous gene pairs in the
celery genome. The probability density of Ks was estimated using the “density” function in the R language. c Evolutionary analysis of celery and eight other
plant species. The divergence time was estimated with the calibration time for S. tubersum and S. lycopersicum. The pie charts show the proportions of
expanded (green), contracted (red), and unchanged (blue) gene families. The potential WGD events of celery are indicated with red triangles.
of R proteins55,56. A total of 201 NBS-containing resis- Table 5 Comparison of the numbers and classifications of
tance genes were identified based on resistance domain genes encoding an NBS domain in celery, carrot, Arabidopsis,
analyses in the celery genome, all of which were further maize, and rice.
classified into six groups: TIR-NBS-LRR, CC-NBS-LRR,
Protein Letter code Celery Carrot Arabidopsis Maize Rice
CC-NBS, TIR-NBS, NBS-LRR, and NBS (Table 5). The
domains
total number of NBS-LRR genes was 146 in carrot20, 176
in Arabidopsis57, 107 in maize58, and 472 in rice59. Among CC-NBS- CNL 6 57 51 58 160
these genes in the celery genome, one class, NBS, pre- LRR
sented a markedly greater number in celery (126 genes)
TIR-NBS- TNL 0 4 92 0 0
than in other plants including carrot (19), Arabidopsis (1),
LRR
maize (7) and rice (25). The NBS-LRR genes present in
monocotyledons and dicotyledons showed different CC-NBS CN 47 0 5 11 7
characteristics. The CNL and NL groups accounted for a TIR-NBS TN 19 0 21 0 0
large proportion of the genes in monocotyledonous plants NBS-LRR NL 3 66 6 31 280
(maize and rice), whereas no genes encoding a TIR
NBS N 126 19 1 7 25
domain were found. However, all of the groups existed in
dicotyledonous plants, but their distributions were dif- Total 201 146 176 107 472
ferent among species.
Evolution of celery the origination of new species, and gene neofunctionali-
WGD events occur widely in flowering plants and are zation54,60. Ks values can be used to estimate the timing of
one of the most important drivers of genome evolution, large-scale duplications61. The distribution of Ks valuesLi et al. Horticulture Research (2020)7:9 Page 7 of 10
between celery paralogous pairs displayed two peaks, at
0.025 and 0.385 (Fig. 2b), which indicated recent WGD
events in the evolution of celery. Based on the generally
accepted evolutionary rate62, the WGD events might have
occurred at times of ~1.9 and 29.6 Mya.
Using the 28,874 orthologous gene families identified by
OrthoMCL from the celery genome and eight other fully
sequenced genomes, we constructed a phylogenetic tree
to show the relationships among the nine higher plants.
The times of divergence among these plant species were
also estimated (Fig. 2c). We used the time of divergence
between S. tubersum and S. lycopersicum as a calibration
point. Celery and carrot diverged from a common
ancestor ~35.1 Mya. In addition, we performed a com-
parative analysis of gene family evolution in the nine
plants in the phylogenetic tree. A total of 2131 gene
families were expanded in the celery lineage, whereas
2721 gene families had undergone contraction.
Apigenin biosynthesis pathway in celery
Apigenin is one of the most important flavonoid com-
pounds and exhibits a variety of biological activities and
pharmacological effects3. Compared with other plants,
celery has a higher content of apigenin6,8. In light of the
Fig. 3 Heatmap of gene transcript abundance in the apigenin
flavonoid compounds among the important secondary pathway at three developmental stages in celery. Stage 1, 35 days
metabolites of celery, we analyzed the genes involved in after sowing; Stage 2, 50 days after sowing; Stage 3, 60 days after
the flavonoid biosynthesis pathway. Most of these flavo- sowing. RPKM values are log2-based. Red and blue indicate high and
noid biosynthesis pathway genes were found in our low expression levels, respectively.
dataset (Supplementary Fig. S6). Here, 41 genes that were
putatively involved in the flavonoid biosynthesis pathway,
mainly encoding 13 different enzymes, were identified in This work extends previous reports on related genes
celery based on the genome sequences (Supplementary involved in apigenin biosynthesis and provides an over-
Table S10). Compared with the flavonoid biosynthesis view of apigenin biosynthesis pathways in celery.
genes of Arabidopsis, rice, and tomato (Supplementary
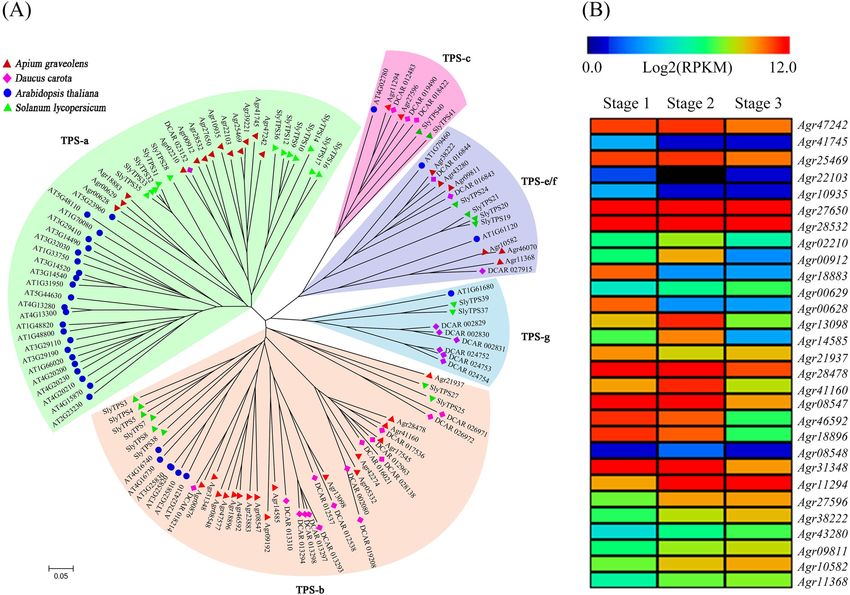
Tables S10 and S11), the greatest number of genes was Terpenoid synthase family genes
found in tomato (49), followed by celery (41), rice (34), The flavor of celery is mainly attributed to its terpenoid
and Arabidopsis (21). The main flavonoid genes in tomato content. TPSs are the key enzymes that catalyze complex
are the HCT and CCOAOMT genes, which account for multiple-step cyclization in terpene metabolism. A total of
55% of these genes, whereas the numbers of different 38 putative TPS proteins were screened in the celery
genes in other species are relatively diverse. genome by using HMMER software based on the highly
Chalcone synthase (CHS) is a key enzyme in the api- conserved domain. To confirm the classification of TPS
genin biosynthesis pathway, and more genes encoding family proteins in celery, we constructed a phylogenetic
CHS were found in celery than in other plants. One tree by aligning the TPS proteins among celery, carrot20,
chalcone isomerase (CHI) was obtained from the celery Arabidopsis65, and tomato66. All the proteins were divided
genome. Flavone synthase I (FNSI) is another enzyme that into five subfamilies: TPS-a, TPS-b, TPS-c, TPS-e/f, and
is necessary for apigenin biosynthesis. Two FNSI genes TPS-g (Fig. 4a). In angiosperms, the TPS-b and TPS-a
were detected in celery but not in Arabidopsis, rice, or subfamilies account for most of the sesquiterpene syn-
tomato. Based on celery RNA-seq data from three thases and monoterpene synthases, which constitute the
developmental stages63,64, the expression changes in majority of TPS proteins. DCAR_023152 (DcTPS1) and
apigenin-related genes were analyzed, and the results DCAR_012963 (DcTPS2) were two TPSs found in carrot
were presented in a heatmap. Most of the apigenin belonging to the TPS-a subfamily and TPS-b subfamily,
biosynthesis-related genes showed the highest expression respectively67. The TPSs of celery showed the closest
levels at early stages, and their expression trends phylogenetic relationships with those of carrot,
decreased with celery growth and development (Fig. 3). another Apiaceae family plant. In the celery genome, theLi et al. Horticulture Research (2020)7:9 Page 8 of 10
Fig. 4 Phylogenetic tree and heatmap of TPS proteins in celery. a Phylogenetic tree of all TPS proteins among celery, carrot, Arabidopsis, and
tomato. b Heatmap clustering of TPS gene transcript abundances at three developmental stages (Stage 1, 35 days after sowing; Stage 2, 50 days after
sowing; Stage 3, 60 days after sowing) in celery. The RPKM values are log2-based. Red and black indicate high and low expression levels, respectively.
TPS-b and TPS-a subfamilies contained 17 and 13 mapping, functional gene mining and molecular breeding.
members, and only six and two proteins belonged to the Celery is normally classified as a cool-season vegetable
TPS-e/f and TPS-c subfamilies, respectively, whereas no and widely consumed around the world, and the cultiva-
proteins clustered within the TPS-g subfamily in celery. tion history of celery is longer than 2000 years2,3. To
Based on previous transcriptome data from celery63,64, understand the genetic system and evolution of Apiaceae,
we further analyzed the expression abundance of TPS we sequenced the genome of celery, which offers new
genes in three developmental stages. As illustrated in insights and provides resources for molecular breeding.
Fig. 4b, 30 TPS genes were continuously expressed Here, we report the first genome data for celery. The
during development. Compared with stage 3, most TPS genome size was estimated to be 3.18 Gb, which is close to
genes exhibited higher transcript abundance in stage 1 the previous size estimate obtained using flow cytometry
and stage 2, suggesting that these genes may be involved of ~3.14 Gb. The genome size of celery is far larger than
in a variety of terpenoid metabolic processes during that of carrot, another Apiaceae species, and is even larger
celery growth and development. than those of some angiosperm plants, such as Arabi-
dopsis, rice and poplar. Celery is one of the sequenced
Discussion species with the largest genome sizes among those
Next-generation sequencing is a powerful method for sequenced in recent years, and the celery genome is
genome research. With the continuous development of mainly composed of repetitive sequences, which account
sequencing technology, whole-genome sequencing has for 68.88% of the genome, whereas this percentage is
been carried out in increasing numbers of species, pro- 45.95% in carrot. By comparing the genome components
viding a great deal of biological information for genome of species with different genome sizes, we found that theLi et al. Horticulture Research (2020)7:9 Page 9 of 10
proportions of repetitive sequences were obviously higher (31272175), Jiangsu Natural Science Foundation (BK20130027), Priority
in species with large genome sizes than in other species Academic Program Development of Jiangsu Higher Education Institutions
(PAPD), and Jiangsu Shuangchuang Project.
(e.g., 80.89% in tea tree68 and 76.58% in ginkgo69).
WGD events and tandem duplications are the most Conflict of interest
important determinants of the variation in the genome The authors declare that they have no conflict of interest.
sizes of angiosperms54,70. As two important crops of the
Supplementary Information accompanies this paper at (https://doi.org/
Apiaceae family, the evolutionary analysis suggested that 10.1038/s41438-019-0235-2).
celery and carrot may have diverged ~35.1 Mya. In
addition, a recent WGD event was deduced to have Received: 11 May 2019 Revised: 2 November 2019 Accepted: 5 December
occurred in celery 1.9 Mya. This genome duplication 2019
event not only caused genome expansion in celery,
making its genome larger than of carrot, but may also
have contributed to the physiological and morphological
References
diversity of the celery lineage. 1. Burt, S. Essential oils: their antibacterial properties and potential applications in
As a medicinal and edible plant, celery contains various foods - a review. Int. J. Food Microbiol. 94, 223–253 (2004).
biologically active substances. The biosynthesis and 2. Al-Asmari, A. K., Athar, M. T. & Kadasah, S. G. An updated phytopharmacolo-
gical review on medicinal plant of Arab region: Apium graveolens Linn.
metabolism pathways of these active substances are a Pharmacogn. Rev. 11, 13–18 (2017).
major research focus. The genome sequencing data pro- 3. Li, M. Y. et al. Advances in the research of celery, an important Apiaceae
vide new insights into the unique biosynthetic processes vegetable crop. Crit. Rev. Biotechnol. 38, 172–183 (2018).
4. Li, J. W., Ma, J., Feng, K., Xu, Z. S. & Xiong, A. S. Transcriptome profiling of
of celery, particularly for some important secondary β-carotene biosynthesis genes and β-carotene accumulation in leaf blades
metabolite pathways. Based on the genome sequences, a and petioles of celery cv. Jinnanshiqin. Acta Biochem. Biophys. Sin. 51, 116–119
total of 41 genes that mainly encoded the enzymes in the (2019).
5. Lin, L. Z., Lu, S. M. & Harnly, J. M. Detection and quantification of glycosylated
flavonoid biosynthesis pathway were screened out. Com- flavonoid malonates in celery, Chinese celery, and celery seed by LC-DAD-ESI/
pared with Arabidopsis, rice and tomato, the celery gen- MS. J. Agric. Food Chem. 55, 1321–1326 (2007).
ome contains the richest set of apigenin biosynthesis 6. Hertog, M. G. L., Hollman, P. C. H. & Venema, D. P. Optimization of a quanti-
tative HPLC determination of potentially anticarcinogenic flavonoids in
genes, including CHS, F3H, F3’H, and FNSI. The dupli- vegetables and fruits. J. Agric. Food Chem. 40, 1591–1598 (1992).
cation and evolution of these genes in celery might be 7. Feng, K. et al. AgMYB2 transcription factor is involved in the regulation of
important contributors to enhancing the ability of celery anthocyanin biosynthesis in purple celery (Apium graveolens L.). Planta 248,
1249–1261 (2018).
to synthesize flavonoids. 8. Tan, G. F., Ma, J., Zhang, X. Y., Xu, Z. S. & Xiong, A. S. AgFNS overexpression
The rich flavor of celery is mainly owing to its high increase apigenin and decrease anthocyanins in petioles of transgenic celery.
content of terpenoids. In addition, terpenoids play Plant Sci. 263, 31–38 (2017).
9. Funakoshi-Tago, M., Nakamura, K., Tago, K., Mashino, T. & Kasahara, T. Anti-
numerous roles in plants, such as functions in resistance inflammatory activity of structurally related flavonoids, Apigenin, Luteolin and
to pathogens and pests, acting as the precursors of plant Fisetin. Int. Immunopharmacol. 11, 1150–1159 (2011).
hormones, and participating in plant growth and devel- 10. Huang, C. S. et al. Protection by chrysin, apigenin, and luteolin against oxi-
dative stress is mediated by the Nrf2-dependent up-regulation of heme
opment71–73. The obtained genome sequences helped us oxygenase 1 and glutamate cysteine ligase in rat primary hepatocytes. Arch.
to identify TPS family genes, which are essential for Toxicol. 87, 167–178 (2013).
exploring terpene synthases and terpenoid metabolism. 11. Momin, R. A. & Nair, M. G. Mosquitocidal, nematicidal, and antifungal
compounds from Apium graveolens L. seeds. J. Agric. Food Chem. 49,
Expression abundance analysis showed that most of the 142–145 (2001).
TPS genes were strongly expressed in the late develop- 12. Tang, D., Chen, K. L., Huang, L. Q. & Li, J. Pharmacokinetic properties and drug
mental stage of celery, which was consistent with the interactions of apigenin, a natural flavone. Expert Opin. Drug Metab. Toxicol. 13,
323–330 (2017).
increased expression of TPS genes during carrot 13. Gadermaier, G. et al. Molecular characterization of Api g 2, a novel allergenic
maturation67. Although further research is needed to member of the lipid-transfer protein 1 family from celery stalks. Mol. Nutr. Food
confirm the regulatory mechanisms of TPS genes, the Res. 55, 568–577 (2011).
14. Feng, K. et al. Isolation, purification, and characterization of AgUCGalT1, a
results reveal that TPS genes show temporal specificity galactosyltransferase involved in anthocyanin galactosylation in purple celery
during different developmental periods. The information (Apium graveolens L.). Planta 247, 1363–1375 (2018).
and genome sequence resources reported for the celery 15. Kun, L. I. & Zhang, D. C. & Shan, You-Xi. The quantitation of flavonoids in leaf
and stalk of different celery cultivars and the correlation with antioxidation
genome in this study can enhance both fundamental and activity. Acta Horticulturae Sin. 57, 133–139 (2011).
applied research on celery and other Apiaceae family 16. Arabidopsis Genome, I. Analysis of the genome sequence of the flowering
plants. plant Arabidopsis thaliana. Nature 408, 796–815 (2000).
17. Velasco, R. et al. The genome of the domesticated apple (Malus x domestica
Borkh.). Nat. Genet. 42, 833–839 (2010).
Acknowledgements 18. Schnable, P. S. et al. The B73 maize genome: complexity, diversity, and
The research was supported by the Jiangsu Agriculture Science and dynamics. Science 326, 1112–1115 (2009).
Technology Innovation Fund (CX(18)2007), New Century Excellent Talents in 19. Huang, S. et al. The genome of the cucumber, Cucumis sativus L. Nat. Genet.
University (NCET-11-0670), National Natural Science Foundation of China 41, 1275–1281 (2009).Li et al. Horticulture Research (2020)7:9 Page 10 of 10
20. Iorizzo, M. et al. A high-quality carrot genome assembly provides new insights 49. Riano-Pachon, D. M., Ruzicic, S., Dreyer, I. & Mueller-Roeber, B. PlnTFDB: an
into carotenoid accumulation and asterid genome evolution. Nat. Genet. 48, integrative plant transcription factor database. BMC Bioinformatics 8, 42 (2007).
657–666 (2016). 50. Eddy, S. R. Accelerated profile HMM searches. PLoS Comput Biol. 7, e1002195
21. Sun, D. L. et al. Draft genome sequence of cauliflower (Brassica oleracea L. var. (2011).
botrytis) provides new insights into the C genome in Brassica species. Hortic. 51. Feng, K. et al. CeleryDB: a genomic database for celery. Database 2018,
Res. 6, 82 (2019). bay070 (2018).
22. Xu, Z. S., Tan, H. W., Wang, F., Hou, X. L. & Xiong, A. S. CarrotDB: a genomic and 52. SanMiguel, P. et al. Nested retrotransposons in the intergenic regions of the
transcriptomic database for carrot. Database 2014, bau096 (2014). maize genome. Science 274, 765–768 (1996).
23. Rogers, S. O. & Bendich, A. J. Extraction of DNA from milligram amounts of 53. Vitte, C. & Panaud, O. LTR retrotransposons and flowering plant genome size:
fresh, herbarium and mummified plant tissues. Plant Mol. Biol. 5, 69–76 (1985). emergence of the increase/decrease model. Cytogenet. Genome Res. 110,
24. Martin, M. Cutadapt removes adapter sequences from high-throughput 91–107 (2005).
sequencing reads. Embnet J. 17, 1 (2011). 54. Piegu, B. et al. Doubling genome size without polyploidization: dynamics of
25. Luo, R. et al. SOAPdenovo2: an empirically improved memory-efficient short- retrotransposition-driven genomic expansions in Oryza australiensis, a wild
read de novo assembler. GigaScience 1, 18 (2012). relative of rice. Genome Res. 16, 1262–1269 (2006).
26. Simao, F. A., Waterhouse, R. M., Ioannidis, P., Kriventseva, E. V. & Zdobnov, E. M. 55. DeYoung, B. J. & Innes, R. W. Plant NBS-LRR proteins in pathogen sensing and
BUSCO: assessing genome assembly and annotation completeness with host defense. Nat. Immunol. 7, 1243–1249 (2006).
single-copy orthologs. Bioinformatics 31, 3210–3212 (2015). 56. Takken, F. L., Albrecht, M. & Tameling, W. I. Resistance proteins: molecular
27. Stanke, M. et al. AUGUSTUS: ab initio prediction of alternative transcripts. switches of plant defence. Curr. Opin. Plant Biol. 9, 383–390 (2006).
Nucleic Acids Res. 34, W435–439 (2006). 57. Meyers, B. C., Kozik, A., Griego, A., Kuang, H. & Michelmore, R. W. Genome-wide
28. Korf, I. Gene finding in novel genomes. BMC Bioinformatics 5, 59 (2004). analysis of NBS-LRR-encoding genes in Arabidopsis. Plant Cell 15, 809–834
29. Xu, X. et al. Genome sequence and analysis of the tuber crop potato. Nature (2003).
475, 189–U194 (2011). 58. Cheng, Y. et al. Systematic analysis and comparison of nucleotide-binding site
30. Slater, G. S. & Birney, E. Automated generation of heuristics for biological disease resistance genes in maize. FEBS J. 279, 2431–2443 (2012).
sequence comparison. BMC Bioinformatics 6, 31 (2005). 59. Zhou, T. et al. Genome-wide identification of NBS genes in japonica rice
31. Ashburner, M. et al. Gene ontology: tool for the unification of biology. The reveals significant expansion of divergent non-TIR NBS-LRR genes. Mol. Genet.
Gene Ontology Consortium. Nat. Genet. 25, 25–29 (2000). Genomics 271, 402–415 (2004).
32. Tatusov, R. L. et al. The COG database: an updated version includes eukaryotes. 60. Van de Peer, Y., Maere, S. & Meyer, A. The evolutionary significance of ancient
BMC Bioinformatics 4, 41 (2003). genome duplications. Nat. Rev. Genet. 10, 725–732 (2009).
33. Conesa, A. et al. Blast2GO: a universal tool for annotation, visualization and 61. Blanc, G. & Wolfe, K. H. Widespread paleopolyploidy in model plant species
analysis in functional genomics research. Bioinformatics 21, 3674–3676 (2005). inferred from age distributions of duplicate genes. Plant Cell 16, 1667–1678
34. Ye, J. et al. WEGO: a web tool for plotting GO annotations. Nucleic Acids Res. (2004).
34, W293–297 (2006). 62. Gaut, B. S., Morton, B. R., McCaig, B. C. & Clegg, M. T. Substitution rate com-
35. Lowe, T. M. & Eddy, S. R. tRNAscan-SE: a program for improved detection of parisons between grasses and palms: Synonymous rate differences at the
transfer RNA genes in genomic sequence. Nucleic Acids Res. 25, 955–964 nuclear gene Adh parallel rate differences at the plastid gene rbcL. Proc. Natl
(1997). Acad. Sci. 93, 10274–10279 (1996).
36. Nawrocki, E. P., Kolbe, D. L. & Eddy, S. R. Infernal 1.0: inference of RNA align- 63. Jia, X. L. et al. De novo assembly, transcriptome characterization, lignin
ments. Bioinformatics 25, 1335–1337 (2009). accumulation, and anatomic characteristics: novel insights into lignin bio-
37. Nawrocki, E. P. et al. Rfam 12.0: updates to the RNA families database. Nucleic synthesis during celery leaf development. Sci. Rep. 5, 8259 (2015).
Acids Res. 43, D130–D137 (2015). 64. Li, M. Y., Wang, F., Jiang, Q., Ma, J. & Xiong, A. S. Identification of SSRs and
38. Chen, N. Using RepeatMasker to identify repetitive elements in genomic differentially expressed genes in two cultivars of celery (Apium graveolens L.)
sequences. Curr. Protoc. Bioinformatics 25, 4.10.1–4.10.14 (2004). by deep transcriptome sequencing. Hortic. Res. 1, 10 (2014).
39. Li, L., Stoeckert, C. J. & Roos, D. S. OrthoMCL: identification of ortholog groups 65. Aubourg, S., Lecharny, A. & Bohlmann, J. Genomic analysis of the terpenoid
for eukaryotic genomes. Genome Res. 13, 2178–2189 (2003). synthase (AtTPS) gene family of Arabidopsis thaliana. Mol. Genet. Genomics 267,
40. Goodstein, D. M. et al. Phytozome: a comparative platform for green plant 730–745 (2002).
genomics. Nucleic Acids Res. 40, D1178–1186 (2012). 66. Falara, V. et al. The tomato terpene synthase gene family. Plant Physiol. 157,
41. De Bie, T., Cristianini, N., Demuth, J. P. & Hahn, M. W. CAFE: a computational 770–789 (2011).
tool for the study of gene family evolution. Bioinformatics 22, 1269–1271 67. Yahyaa, M. et al. Identification and characterization of terpene synthases
(2006). potentially involved in the formation of volatile terpenes in carrot (Daucus
42. Fu, L. M., Niu, B. F., Zhu, Z. W., Wu, S. T. & Li, W. Z. CD-HIT: accelerated for carota L.) roots. J. Agric. Food Chem. 63, 4870–4878 (2015).
clustering the next-generation sequencing data. Bioinformatics 28, 3150–3152 68. Xia, E. H. et al. The tea tree genome provides insights into tea flavor and
(2012). independent evolution of caffeine biosynthesis. Mol. Plant 10, 866–877 (2017).
43. Edgar, R. C. MUSCLE: multiple sequence alignment with high accuracy and 69. Guan, R. et al. Draft genome of the living fossil Ginkgo biloba. GigaScience 5, 49
high throughput. Nucleic Acids Res. 32, 1792–1797 (2004). (2016).
44. Jones, D. T., Taylor, W. R. & Thornton, J. M. The rapid generation of mutation 70. El Baidouri, M. & Panaud, O. Comparative genomic paleontology across plant
data matrices from protein sequences. Comput. Appl. Biosci. 8, 275–282 (1992). kingdom reveals the dynamics of TE-driven genome evolution. Genome Biol.
45. Kumar, S., Stecher, G. & Tamura, K. MEGA7: Molecular evolutionary genetics Evol. 5, 954–965 (2013).
analysis version 7.0 forbigger datasets. Mol. Biol. Evol. 33, 1870–1874 (2016). 71. Bohlmann, J., Meyer-Gauen, G. & Croteau, R. Plant terpenoid synthases:
46. Wikstrom, N., Savolainen, V. & Chase, M. W. Evolution of the angiosperms: molecular biology and phylogenetic analysis. Proc. Natl Acad. Sci. 95,
calibrating the family tree. Proc. Biol. Sci. 268, 2211–2220 (2001). 4126–4133 (1998).
47. Crepet, W. L., Nixon, K. C. & Gandolfo, M. A. Fossil evidence and phylogeny: The 72. Tholl, D. Terpene synthases and the regulation, diversity and biological roles of
age of major angiosperm clades based on mesofossil and macrofossil evi- terpene metabolism. Curr. Opin. Plant Biol. 9, 297–304 (2006).
dence from cretaceous deposits. Am. J. Bot. 91, 1666–1682 (2004). 73. Yao, L. X. et al. Proteomic and metabolomic analyses provide insight into the
48. Yang, Z. PAML: a program package for phylogenetic analysis by maximum off-flavour of fruits from citrus trees infected with ‘Candidatus Liberibacter
likelihood. Comput. Appl. Biosci. 13, 555–556 (1997). asiaticus’. Hortic. Res. 6, 31 (2019).You can also read