Fire Blight Monitoring in Pear Orchards by Unmanned Airborne Vehicles (UAV) Systems Carrying Spectral Sensors - MDPI
←
→
Page content transcription
If your browser does not render page correctly, please read the page content below
agronomy
Article
Fire Blight Monitoring in Pear Orchards by
Unmanned Airborne Vehicles (UAV) Systems
Carrying Spectral Sensors
Hilde Schoofs 1, *, Stephanie Delalieux 2, *, Tom Deckers 1 and Dany Bylemans 1
 1   Pcfruit Research Station for fruit, Fruittuinweg 1, 3800 Sint-Truiden, Belgium; tom.deckers@outlook.be (T.D.);
     dany.bylemans@pcfruit.be (D.B.)
 2   Flemish Institute for Technological Research-VITO NV, Boeretang 200, 2400 Mol, Belgium
 *   Correspondence: hilde.schoofs@pcfruit.be (H.S.); Stephanie.delalieux@vito.be (S.D.);
     Tel.: +32-11-697080 (H.S.); +32-14-336716 (S.D.)

 Received: 22 March 2020; Accepted: 20 April 2020; Published: 25 April 2020

 Abstract: Controlling fire blight in pear production areas depends strongly on regular visual
 inspections of pome fruit orchards, nurseries and other hosts of Erwinia amylovora. In addition, these
 inspections play an essential role in delineating fire blight free production areas, which has important
 implications for fruit export. However, visual monitoring is labor intensive and time consuming.
 As a potential alternative, the performance of spectral sensors on unmanned airborne vehicles (UAV)
 or drones was evaluated, since this allows the monitoring of larger areas compared to the current
 field inspections. Unlike more traditional remote sensing platforms such as manned aircrafts and
 satellites, UAVs offer a higher flexibility and an extremely high level of detail. In this project, a UAV
 platform carrying a hyperspectral COSI-cam camera was used to map a heavily infected pear orchard.
 The hyperspectral data were used to assess which wavebands contain information on fire blight
 infections. In this study, wavelengths 611 nm and 784 nm were found appropriate to detect symptoms
 associated with fire blight. Vegetation indices that allow to discriminate between healthy and infected
 trees were identified, too. This manuscript highlights the potential use of the UAV methodology in
 fire blight detection and remaining difficulties that still need to be overcome for the technique to
 become fully operational in practice.

 Keywords: fire blight; UAV; spectral sensors; precision agriculture

1. Introduction
     Fire blight caused by the Gram-negative bacterium Erwinia amylovora (Burr.) Winslow et al.,
represents an important threat to pome fruit cultivation worldwide. E. amylovora can affect rosaceous
plants, such as apples and pears as well as ornamental shrubs such as Cotoneaster, Crataegus and
Pyracantha [1,2]. The pathogen enters the host plants via natural openings such as the stigmas and
nectaries of flowers, stomata, hydathodes or via wounds, and spreads systemically within the plants.
Common symptoms of fire blight are initially a water-soaked appearance of infected plant parts,
followed by wilting, and eventually necrosis of flowers, leaves, fruits, and terminal shoots. In addition,
cankers can develop on branches, trunks, and rootstocks [3–6]. Trees with fire blight infection often
exhibit yellow to burgundy foliage about a month before normal onset of autumn coloration [7].
The severity of the disease is favored by specific weather conditions such as high humidity and high
temperature especially during the vegetative growth [8,9]. Fire blight is difficult to control as the
pathogen can infect all host tissues at different times during the season [8,9]. E. amylovora is capable
of rapid systemic movement in trees and can spread from the site of infection throughout the tree
within one season [10]. Ooze droplets containing a mixture of bacterial cells and exopolysaccharides

Agronomy 2020, 10, 615; doi:10.3390/agronomy10050615                              www.mdpi.com/journal/agronomy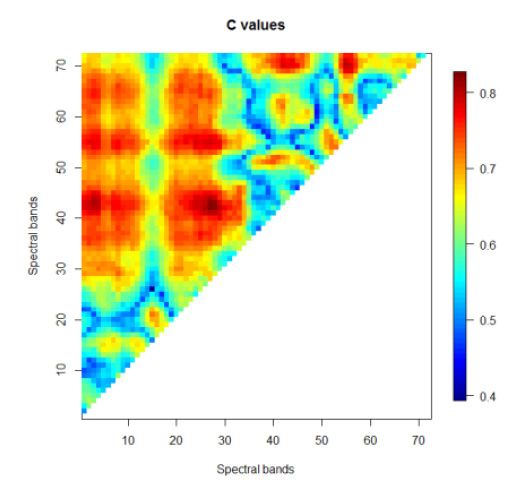
Agronomy 2020, 10, 615                                                                              2 of 12

can emerge from infected tissues and can spread the disease between plants [3,10,11]. Rain, wind,
insects, birds, and orchard workers are important vectors in spreading the fire blight disease within
and between orchards and their surroundings [1,3,12–14].
     Regular inspections of pome fruit orchards, nurseries and other hosts of E. amylovora remain an
important measure in a fire blight control strategy. As visual inspections are labor intensive, time
consuming, and limited by the ability of the human eye to discriminate between healthy plants and
plants suffering from stress, more rapid and reliable fire blight detection techniques are needed.
     The development of aerial and ground-based hyperspectral and multispectral imaging technology
has been a major breakthrough in precision agriculture techniques including in targeted stress
management. The spectral reflectance of plants in the visible (VIS) and near infrared (NIR) region
of the electromagnetic spectrum is primarily affected by plant pigments and cellular structure of the
leaves. Since stress factors alter these plant parameters, they will result in a change in the reflectance
signal [15,16]. Furthermore, it is well-known that the Red Edge (RE) spectral region (i.e., transition
between VIS and NIR spectral region) is closely linked to the plant’s health status [17,18]. Hence,
spectral characteristics can be used as indicators of plant health and the remote detection, mapping
and monitoring of such plant health linked parameters provides essential information for making
timely and effective management decisions. Because VIS and NIR spectrometry is an accurate tool for
plant status monitoring, it has been implemented in a wide variety of decision support systems in
agriculture and various researchers have used these techniques for disease detection in plants [19,20].
For example, Delalieux et al., 2007 [20] concluded that the visible wavelengths around 650–700 nm and
the spectral domains between 1350–1750 nm and 2200–2500 nm were the most important regions for
separating stressed apple leaves from healthy leaves immediately after infection of Venturia inaequalis.
     Recent developments in unmanned airborne vehicles (UAV) allow faster and more cost-efficient
collection of aerial imagery on a local scale than visual inspections. UAVs allow to monitor crop health
status on a regular basis, estimate plant water needs, and even detect diseases [21–23]. They represent a
low-cost method for the collection of high-resolution images and are increasingly used for agricultural
applications especially in arable crops. Specifically for plant disease monitoring, Zhang et al., [24]
recently published a review paper highlighting the need for hyperspectral data to detect subtle
changes in pigments. In addition, the necessity for identifying different spectral features at different
development stages of the disease was underlined. Similar results were found specifically for fire
blight using hyperspectral images of detached leaves [19,25]. Although highly promising, these results
need further validation at tree and orchard levels to allow their practical application. So far, UAV
based multispectral data yielded only a low to moderate fire blight detection accuracy as demonstrated
by the same authors [25].
     The high spatial resolution that can be obtained by spectral sensors introduces an unexplored
complexity. Differences in natural leaf colors, shadows, twigs, unwanted objects such as poles, wires,
stones can be detected and add complexity to the image analysis. Although high detail can be obtained,
local fire blight symptoms can be hidden by healthy leaves and twigs or shadows causing them hard
to detect.
     In this study, we discuss the potential use of UAV systems carrying a hyperspectral sensor for
identifying fire blight infection in pear under orchard conditions. A spectral wavelength selection was
performed to detect fire blight. Vegetation indices enabling the discrimination between healthy and
infected trees were determined.

2. Materials and Methods

2.1. Study Area
     The research was conducted in a commercial pear orchard cv. “Durondeau” that had a long
history of fire blight infections. The orchard was located in the district Leuven (Flanders, Belgium).
At the time of the study, the trees were twenty years old. The trees were grafted on Quince C rootstocks
Agronomy 2020, 10, 615 3 of 12
and trained in a free spindle system with a tree height of 3.5 m. The trees were planted at 3.5 m between
the rows and with variable distance within the row. The planting distance between the trees in the
rows was measured to locate the trees correctly in the UAV images afterwards. Despite the disease
pressure present in this orchard and favorable weather conditions to further spread of the fire blight
infections, no spray applications to control the fire blight were performed by the grower.
2.2. Ground Data Collection by Visual Inspections
In 2015, 440 trees in the trial orchard were scored for visible fire blight symptoms and their severity
(no to severe symptoms). The presence of E. amylovora was confirmed by diagnostic research according
to EPPO guideline PM7/20 (2) [26] including crushing of the samples in phosphate buffered saline at
10 mM followed by isolation of the bacteria on King’s B medium [27] and indirect immunofluorescence
techniques (serological test). In addition, it was noted if symptoms resembling fire blight but originating
from other causes were present as they can interfere with fire blight detection by RGB and hyperspectral
sensors (e.g., pear blast caused by Pseudomonas syringae pv. syringae, herbicide damage, canker caused
by Neonectria ditissima, problems of incompatibility between cultivar and rootstock). Based on the
above mentioned symptoms a fire blight infection score (0–2) was assigned to each tree at each visual
inspection date, ranging from no over moderate to severe fire blight symptoms. Asymptomatic
trees were only scored as “class 0” (non-infected) when no fire blight symptoms were observed by
trained and experienced researchers over all inspections throughout the whole season (classification by
expert decision).
From the 440 trees under study 24 reference “infected” trees were selected because they showed
visible disease symptoms throughout the whole season and 23 trees of class 0 were selected as
reference “healthy” trees. These 47 trees constitute the training set for subsequent tree based modelling
(paragraph 2.4.2).
2.3. Image Collection by UAV
On 7 July 2015, a UAV flight with an Altura X8 octocopter, carrying a hyperspectral camera
(COSI-cam) with a spectral range of 600–900 nm was performed. The COSI-cam has a 2048 × 1088
pixels sensor (pixel pitch of 5.5 µm) with a Linear Variable Filter (LVF) deposited directly on the
sensor surface [28], with a total of 72 narrow (Full Width Half Max—FWHM 5 nm to 10 nm) spectral
bands [28] ranging from 600 to 900 nm. Images were taken in rapid succession (340 frames/s in 8 bit
mode) so that every location on the ground was imaged by all spectral bands creating two dimensional
hyperspectral images [29]. The imager captures very high spatial resolution data, i.e., images captured
with a 9 mm lens at 40 m altitude cover the swath of ~40 m with a ~1.5 cm ground sampling distance
(GSD). Geometrically correct (orthorectified) hyperspectral data can be reconstructed with a GSD
of ~4 cm.
On the same day, also an RGB image acquisition was performed with a fixed wing SenseFly eBee
platform carrying the S.O.D.A. camera (Sensefly.com, Lausanne, Switzerland). Flights were performed
at 65 m above ground level, resulting in a spatial resolution of 2 cm resolution.
2.4. Hyperspectral Data Analysis
2.4.1. Preprocessing of Hyperspectral Images
Raw images that were captured with the fixed-wing SenseFly eBee platform (SenseFly.com,
Lausanne, Switzerland) were processed with Agisoft Photoscan software (www.agisoft.com) to
generate high resolution georeferenced orthomosaic and detailed Digital Surface Models (DSM).
Hyperspectral images captured with the Altura X8 octocopter on 7 July 2015, were processed with a
processing solution developed at VITO. The raw image data of the camera were transformed into a
hyperspectral reflectance image product containing orthomosaics for all 72 spectral bands [29].Agronomy 2020, 10, 615 4 of 12
A Digital Terrain Model (DTM) was extracted from the obtained DSM by interpolating between the
lowest height values of the DSM in a window of approximately 3 × 3 m. More specifically, background
and grasses were masked for further analysis by removing all pixels below a 20 cm threshold. In
this image the fruit trees under study were identified based on the distance between the trees as
measured in the field. For the obtained UAV images, the spectral information of the trees could as such
be extracted. A difficulty was introduced by the within-canopy shadow. To deal with this challenge,
the assumption was made that all trees had a similar structure with an equal amount of about 10%
shaded pixels.
2.4.2. Selection of Spectral Reflectance Bands
In remote sensing, vegetation indices are an established method to relate hyperspectral space-
and airborne observations to plant physiological parameters. Many different vegetation indices exist
and each uses a different set of wavelength measurements for describing physiological attributes
of vegetation, looking at either general properties of the plant or at specific parameters of its
growth [18]. Vegetation indices result in data dimensionality reduction, which is valuable in terms of
data processing and analysis. Furthermore, they are able to surpass the limitations of single bands by
minimizing external factors, resulting in improved sensitivity for the detection of vegetative biochemical
constituents [30–33]. One of the most used and implemented index calculated from multispectral
information as normalized ratio between the red and near infrared bands is the Normalized Difference
Vegetation Index (NDVI) [31,34,35]. This index is mainly used as a proxy for LAI and leaf chlorophyll
concentration. However, this index saturates at a moderate level of LAI content, which causes serious
limitations in its use. Notwithstanding this drawback, such a normalized or standardized index has the
potential of estimating biophysical parameters in a manner more meaningful than simple ratio indices
due to their inherent characteristic of reducing undesired spectral effects caused by, e.g., differences in
illumination [20].
In this study, a standardized difference vegetation index (SDVI) of the measured reflectance values
R was calculated for each possible combination of two different wavelengths λ1 and λ2 as shown in
Equation (1).
R ( λ2 ) − R ( λ1 )
SDVI = (1)
R ( λ2 ) + R ( λ1 )
The calculated SDVI was then used as an independent variable in a logistic regression analysis to
evaluate which wavelength combinations were important in differentiating between binary responses
(i.e., infected “1” vs. healthy “0”). The ability of the indices to discriminate between infected and
healthy trees was tested using ROC (“Receiver-Operator Characteristic”) analysis [36]. ROC plots are
created by plotting the “1-sensitivity” values, the true positive fraction (i.e., infected trees correctly
classified as infected) against “1-specificity”, the false-positive fraction (i.e., non-infected trees classified
as infected). A curve that maximizes the sensitivity for low values of the false-positive fraction is
considered a good model and is quantified by the area under the curve (c-index). The c-index is
an easily interpretable and objective statistical measure to evaluate and compare the discriminatory
performance of the different wavelengths or their linear combinations, and has values usually ranging
from 0.5 (random) to 1.0 (perfect discrimination). Lower values indicate a model that is worse than
just random values selection [37]. Values above 0.8 are generally accepted to represent significant
discriminative models [38].
Next, the signals of the 47 selected trees (23 healthy trees vs. 24 trees with fire blight symptoms)
were used as input for a tree based model (TBM) [39]. Tree based learning algorithms are non-parametric
supervised classification or regression methods that do not require the assumption of probability
distributions and empower predictive models with high accuracy, stability and ease of interpretation.
Unlike linear models, they map non-linear relationships quite well. Other advantages are that specific
interactions can be detected without previous inclusion in the model, non-homogeneity can be taken
into account, mixed data types can be used and dimension reduction of high dimensional datasetsAgronomy 2020, 10, 615 5 of 12
is facilitated. To avoid overfitting, obtained trees were pruned to lower levels [40]. A ten-fold
cross-validation approach was used to determine the classification accuracy and the optimal size of
the tree.
Cohen’s kappa coefficient (κ) was calculated as it is generally a more robust measure than simple
percent agreement calculation, because κ takes into account the possibility of the agreement occurring
by chance.
Finally, the most discriminative model to detect healthy and infected trees was subsequently
applied to the other trees in the orchard to decide if they were infected or not. The performance of the
model is shown by a confusion matrix, including sensitivity and specificity rate. This analysis was
done on a per-pixel basis (around 650 pixels per tree, 440 trees) where the number of infected pixels
was counted per tree. This number of infected pixels was subsequently divided by the total number of
pixels in that tree, obtaining a degree of infection.
3. Results
3.1. Ground Data Selection by Visual Inspection
Six intensive field inspections were carried out by experienced researchers in the period from June
12 till September 10, 2015. This resulted in an orchard map indicating the location of the healthy, the
moderately fire blight-infected, and the severely fire blight-infected trees. Table 1 summarizes the fire
blight disease incidence and severity as determined by the visual inspections for the 440 trees under
investigation. These data clearly demonstrate that the number as well as the severity of infections
increased during the season. On the one hand, this was partly due to insufficient removal by the
fruit grower of infections, which then progressed and became more apparent. On the other hand, the
infection pressure was very high in this orchard causing new infections throughout the season and
finally, leading to the loss of this orchard at the end of 2015.
Table 1. Disease incidence and severity scores for 440 trees in a pear orchard cv “Durondeau” at the
field inspection dates June 12, June 19, June 29, July 7, August 11, and September 10, 2015. At each
observation date the number of healthy trees (class 0), moderately fire blight infected trees (class 1) and
severely fire blight infected trees (class 2) were counted.
No. of Trees Scored Per Orchard Inspection In 2015
Visual FB * Infection Status
June 12 June 19 June 29 July 7 August 12 September 10 Entire Season
Class 0 (Healthy) 338 323 209 236 161 76 39
Class 1 (Moderately FB infected) 72 86 203 155 240 242 263
Class 2 (Severely FB infected) 28 28 20 19 14 57 78
No. fire blight infected trees 100 114 223 174 254 299 341
* FB = fire blight.
3.2. Hyperspectral Data Analyses for Fire Blight Detection
The spectral information of the selected 24 infected and 23 healthy trees was extracted from the
orthomosaic to be further used as input data in the search for SDVIs and TBMs that could detect fire
blight infections.
The combinations of spectral bands between 42–45 (784–798 nm) with spectral bands between 1 to
5 (604–620 nm), as well as spectral bands 25 to 30 (708.5–732 nm) combined with spectral bands 42 to
45 (784–798 nm) had the highest discriminatory performance as shown by their high (>0.8) c-values
(Figure 1).Agronomy 2019, 9, x FOR PEER REVIEW 6 of 12
Agronomy
Agronomy2019,
2020,9,10,
x FOR
615 PEER REVIEW 6 6ofof12
12
Figure
Figure 1.
1. Results
Results of
of the
the logistic
logistic regression
regression onon all
all possible
possible two-band
two-band combinations
combinations (standardized
(standardized
difference
difference vegetation
vegetation index
index (SDVI))
(SDVI)) for
for the
the 47
47 selected
selected reference
reference trees.
trees.
Figure 1. Results of the logistic regression on all possible two-band combinations (standardized
difference vegetation index (SDVI)) for the 47 selected reference trees.
Tree based model
Tree based modelanalysis
analysison onthe
thetraining
trainingdataset
datasetofof4747 trees
trees resulted
resulted in aintree
a tree
modelmodel
withwith the
the first
first decision
decision node selecting wavelength 611 nm, which subdivides all records into two mutually
Tree node
basedselecting wavelength
model analysis on the611training
nm, which subdivides
dataset all records
of 47 trees resulted into
in two
a treemutually
model with exclusive
the
exclusive
subsets. subsets.
All pixels All
withpixels with reflectance
reflectance values at values
611 nm at 611 0.08
above nm above
were 0.08 were as
considered considered
infected as
(1).
first decision node selecting wavelength 611 nm, which subdivides all records into two mutually
infected
The (1). Thepixels
remaining remaining
where pixels where categorized
categorized as healthy as healthy
(0) if (0) if reflectance
reflectance at 784 nm at
was784equal
nm was or equal
higher
exclusive subsets. All pixels with reflectance values at 611 nm above 0.08 were considered as
or higher
than
infected0.62. thantraining
(1). A
0.62. Aaccuracy
The remaining
training ofaccuracy of 85%
85% categorized
pixels where (kappa = 70%)
(kappa was= 70%)
as healthy
was by
obtained obtained by using
usingatthis
(0) if reflectance 784TBM
nm was
this TBM
modelequal for
model
dividing forthedividing
dataset the
in dataset in
infected andinfected
healthy and
treeshealthy
(Figure trees
2). (Figure 2). Twenty-two
Twenty-two trees were trees were
successfully
or higher than 0.62. A training accuracy of 85% (kappa = 70%) was obtained by using this TBM
successfully
classified classified by infected
the model aspositive),
infectedwhile
(true 18positive), while 18 trees as healthy (true
model for by the model
dividing the asdataset in (true
infected and healthy trees (Figure
trees as healthy2). (true negative).
Twenty-two Fivewere
trees trees
negative).
that were Five trees
visually that
scored were
as visually
healthy scored
were as healthy
classified as were
infected classified
(false as infected
positive), (false
while two positive),
visually
successfully classified by the model as infected (true positive), while 18 trees as healthy (true
while twotrees
infected visually infected treeshealthy
were classified as healthy (false negative).
negative). Fivewere
treesclassified
that wereasvisually (false negative).
scored as healthy were classified as infected (false positive),
while two visually infected trees were classified as healthy (false negative).
Figure 2. (a) Resulting tree-based model (TBM) using the 47 selected trees as input variables for infected
(1) and healthy (0) trees. (b) Confusion matrix and statistics of the pruned training model.
Figure 2. (a) Resulting tree-based model (TBM) using the 47 selected trees as input variables for
infected
In both (1) and healthy (0) trees. (b) Confusion matrix wavelengths
and statistics of611
thenm
pruned training model.
Figure 2. methods (vegetation
(a) Resulting tree-basedindices
model and
(TBM)TBM),
using the 47 selected (RED)
trees as inputand 784 nm
variables for (NIR)
wereinfected
most appropriate to (0)
(1) and healthy detect
trees.symptoms associated
(b) Confusion with
matrix and fire blight
statistics of thewith
prunedc-values
trainingabove
model. 0.8 and a
In both
training methods accuracy
classification (vegetation indices and TBM), wavelengths 611 nm (RED) and 784 nm (NIR)
of 85%.
were most appropriate to detect symptoms associated with fire blight with c-values above 0.8 and a
In both methods (vegetation indices and TBM), wavelengths 611 nm (RED) and 784 nm (NIR)
training classification accuracy of 85%.
were most appropriate to detect symptoms associated with fire blight with c-values above 0.8 and a
training classification accuracy of 85%.Agronomy 2020, 10, 615 7 of 12
Agronomy 2019, 9, x FOR PEER REVIEW 7 of 12
3.3. Application of Selected Wavelengths
3.3. Wavelengths on
on the
the Entire
Entire Data
Data Set
Set
In aanext
In nextstep,
step,
thethe
SDVISDVI combining
combining theselected
the two two selected
spectralspectral bands
bands (611 and(611 andwas
784 nm) 784calculated
nm) was
calculated
for all pixelsfor
of all
thepixels of theinvestigation
trees under trees under (around
investigation (around
650 pixels 650 pixels
per tree, per The
440 trees). tree,ratio
440 trees). The
of infected
ratio of infected vs. healthy pixels was then used to represent the probability of infection
vs. healthy pixels was then used to represent the probability of infection of each tree in the orchard of each tree
in the orchard
(Figure 3). (Figure 3).
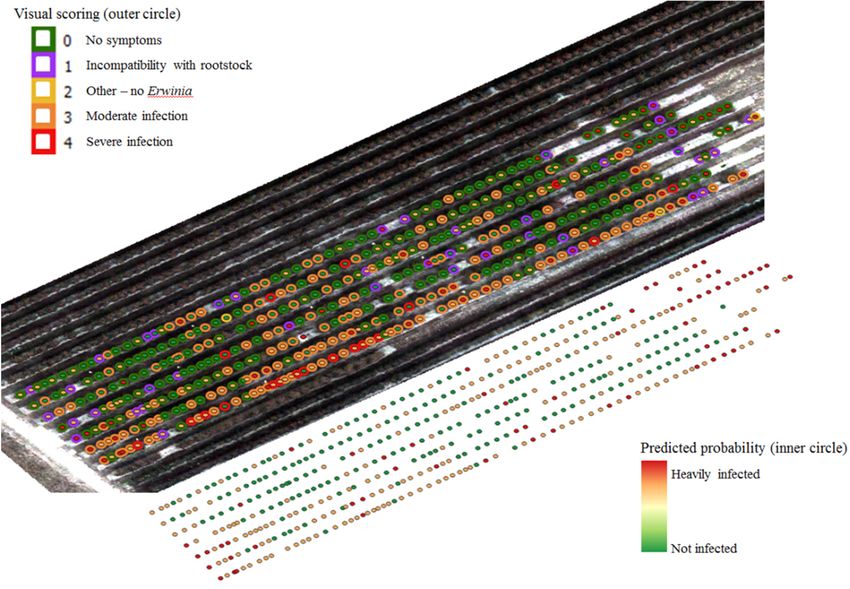
Figure 3. Probability of infection for each tree in the pear orchard calculated from the COSI-cam
Figure 3. Probability of infection for each tree in the pear orchard calculated from the COSI-cam
imagery acquired on 7 July 2015 (inner circle) overlaid on the visual scoring (outer circle). Red indicates
imagery acquired on 7 July 2015 (inner circle) overlaid on the visual scoring (outer circle). Red
high probability, while green corresponds to low probability of infection.
indicates high probability, while green corresponds to low probability of infection.
Subsequently, infection probabilities calculated from the COSI-cam imagery were compared to
Subsequently,
the infection status infection
obtained probabilities
by the visualcalculated from the
field inspection COSI-cam
carried out onimagery
the same were
day.compared
The visualto
the infection
inspection datastatus
shown obtained
in Tableby the visual
1 indicate field
that on 7inspection
July, 2015 carried
about 236 outtrees
on the
weresame day. The
classified visual
as healthy,
inspection data shown in Table 1 indicate that on 7 July, 2015 about 236 trees
while 174 of the observed trees were classified as fire blight infected. Table 2 summarizes the relation were classified as
healthy, these
between whilevisual
174 offield
the observed
data and the trees were classified
hyperspectral as fire blight
COSI-cam data. infected. Table 2 summarizes
the relation between these visual field data and the hyperspectral COSI-cam data.
This 2.
Table comparison indicated
Relation between that
visual 62%
field data(108/174 infected
of fire blight trees)
detection withof the
theinfection
trees with symptoms
probability
associated with
calculated fire on
based blight were correctly
the hyperspectral detecteddata
COSI-cam (true
of 7positive)
July, 2015by
andthe hyperspectral
expressed data analysis,
as the number of
whereas
trees 47% of the
classified visually
as true healthy
positive, trees (110
true negative, trees/236
false positive healthy
and false trees) were classified as ‘infected’
negative.
(false positive). Almost 40% of the infected trees were classified incorrectly as healthy (false
Visual Scoring Relation with Hyperspectral Data
negatives; 66 trees/174
FB* Infection Status infected trees). Consequently, an overall accuracy of only 52% (kappa = 0.13)
on 7 July 2015 True Negative True Positive False Negative False Positive
was obtained for the detection of healthy vs. infected trees on July 7, 2015.
Healthy 236 126 / / 110
Fire blight infected 174 / 108 66 /
Table 2. Relation between visual field data of fire blight detection with the infection probability
* FB = fire blight.
calculated based on the hyperspectral COSI-cam data of 7 July, 2015 and expressed as the number of
trees classified as true positive, true negative, false positive and false negative.
This comparison indicated that 62% (108/174 infected trees) of the trees with symptoms associated
with fireFB* Infection
blight were correctly detected (true positive) byRelation
the hyperspectral data analysis,
with Hyperspectral Datawhereas 47%
Status
of the visually healthy treesVisual Scoring on
(110 trees/236 healthy trees) were classified as ‘infected’ (false positive).
Almost 40% of the infected trees Julywere
7, 2015 True
classified incorrectly as True
healthy (falseFalse False
negatives; 66 trees/174
infected trees). Consequently, an overall accuracy of only 52% (kappa = 0.13) was obtained for the
Negative Positive Negative Positive
Healthy
detection of 236 on 7 July 2015.
healthy vs. infected trees 126 / / 110
Fire blight infected 174 / 108 66 /
* FB = fire blight.Agronomy 2020, 10, 615 8 of 12
Since visual assessments were repeated until 10 September 2015, it was possible to further monitor
the infection status of the trees classified as true/false positive or negative based on the relation between
visual and hyperspectral data of 7 July 2015. These data are summarized in Table 3 and revealed that 82
out of 110 false positive classified trees (based on July 7 visual and hyperspectral data), were classified
as fire blight infected by the visual scoring over the entire season until 10 September 2015. In addition,
17 of the false positive classified trees showed other symptoms like incompatibility with the rootstock
or other fire-blight resembling symptoms at the end of the season. The trees that were incorrectly
classified on July 7 as healthy (false negative, 66 trees) were all scored as fire blight infected at the end
of the season. In contrast, 86 trees out of 126 trees classified as true negative on July 7, developed fire
blight symptoms throughout the season.
Table 3. Comparison of the true/false positive and negative classification based on the 7 July 2015
visual and hyperspectral COSI-cam data (Table 2) and the visual scoring over the entire season till
September 10, 2015 as fire blight infected (FB), healthy or other symptoms (i.e., incompatibility with the
rootstock or symptoms resembling fire blight).
Classification Based on the Relation Between Visual No. of Trees Visually Scored (Entire
Scoring and Hyperspectral COSI-Cam Data of 7 July 2015 Season, Until 10 September 2015)
Class No. of trees FB* infected Healthy Other
True positive 108 107 1 0
True negative 126 86 27 13
False positive 110 82 11 17
False negative 66 66 0 0
* FB = fire blight.
4. Discussion and Conclusions
Fruit growers need to frequently inspect their orchards and remove infected plant parts to combat
the spread of fire blight. In this study, a heavily infected pear orchard was monitored with a UAV
carrying a hyperspectral COSI-cam with a spectral range between 600 and 900 nm. This hyperspectral
camera was chosen as it was already concluded from previous spectral studies on fire blight detection
that simple RGB cameras do not provide the spectral detail needed for an accurate detection of fire
blight symptoms [19,21]. In contrast, RGB imagery was found useful for the application in plant
senescence studies [41,42] generating a good general view on the coloration pattern within the orchard.
In addition, early autumn coloration is an indicator of the overall low plant vigor and, as such, can
be induced by fire blight infections. And thus, in this way RGB data could partly contribute to the
detection of fire blight infected trees.
In this study, wavelengths 611 nm (RED) and 784 nm (NIR) were found appropriate to detect
symptoms associated with fire blight based on a set of 47 selected trees and with a high accuracy
of 85% to distinguish healthy trees from the infected trees that visually show consistent fire blight
symptoms throughout the season (Figure 2). These selected bands correspond to the results obtained
by Jarolmasjed et al. 2019 [25] on fire blight detection in apple trees. Moreover, most studies have
identified the green, red and NIR spectral regions as being sensitive to a variety of plant diseases
and pests as summarized by Zhang et al., 2019 [24]. In addition, research studies on multispectral or
hyperspectral fungal disease detection like Botrytis cinerea in tomato [43] and leaf rust Naohidemyces
vaccinii in blueberry [44] confirmed that wavelengths located in the VIS and NIR regions are useful
to detect diseases. From the studies of Jarolmasjed and co-workers [25] as well as Ahlawat and
co-workers [44], it became evident that even better information can be obtained using SWIR (short
wavelength infrared) sensors, which were, however, not available in this study.
The combination of these two selected spectral bands (611 nm and 784 nm) was then used to check
how many pixels (around 650 per tree) of each tree (440 trees) in the infected test orchard were classified
as “healthy” and “infected”. The ratio of infected over total pixels per tree represents the probability ofAgronomy 2020, 10, 615 9 of 12
infection of each tree in the study orchard. With this approach, however, tree infections based on the
image dataset of 7 July 2015 were predicted correctly for only 62% of the infected trees (true positive),
whereas 47% of the healthy trees were incorrectly indicated as infected (false positive). Moreover,
nearly 40% of infected trees were classified incorrectly as healthy (false negatives) (Table 2). Infection
probability was thus less accurately predicted for trees that showed no clear symptom expression or
trees that scored visually healthy because infections might have been removed by the fruit grower in
between the field inspections as part of the disease management strategy or because infections are still
latent at the time of the hyperspectral UAV flight (Table 3). These above-mentioned results indicate
that the current set-up needs fine-tuning of the model to lower the percentages of false negative and
false positive results. The reference trees that were used as input for the TBM and index analyses, were
only selected when consistent scoring was observed throughout the season, which explains the high
training accuracy of 85%. Most orchard trees, however, showed less clear symptoms or were only
slightly infected. Including these trees in the training set, might give better prediction results, and
should be tested in future research. A more detailed ground truth collection is needed for this, too.
On the one hand, in the case of false positive classification of healthy trees, the following factors
may play a role: (1) As indicated in Table 3, 82 out of 110 false positive classified trees (based on
July 7 visual and hyperspectral data), were scored as fire blight infected at the end of the season.
This may be due to infections removed early in the season by the grower but reappeared later in the
season on adjacent branches and fruits. Moreover, infections that were still asymptomatic during
the inspections of July 7, could become symptomatic later in the season. (2) Within-canopy shadow
introduced difficulties as dark (shaded) pixels can result in false positive identification as well as
spectral analysis at different phenological stages of the trees can be different. We therefore assumed
that all trees had a similar structure with an equal amount of about 10% shaded pixels in healthy trees.
A shadow removal algorithm should be applied to check this hypothesis. However, existing shadow
removal algorithms were developed for spaceborne and airborne remote sensing studies [45] and,
to our knowledge, have never proven to be applicable on highly detailed UAV imagery of vegetation.
(3) In addition to shade, also fire blight-like symptoms like broken shoots and branches, pear blast
caused by Pseudomomas syringae pv. syringae infections and canker caused by Neonectria ditissima,
all of which were noted by the visual field inspections, could be mistaken for fire blight by spectral
analysis causing false positives. Jarolmasjed and co-workers [25] also encountered these issues in their
study on fire blight detection in apple trees. They mention the need for an automated phenotyping
system to cover the canopy with controlled lighting and imaging conditions in addition to accurate
estimation of distances with 3D cameras. (4) Furthermore, an imperfect delineation of the trees due to
the asymmetric shape of many trees and geometric artefacts in the orthomosaic resulted for some trees
in only a limited number of pixels and biased infection probability. For example, at the end of the fifth
row, only a few, mainly shaded pixels were used for analysis due to an incorrect delineation of the
trees as the trees were not perfectly aligned at the end of that row. Very accurate GPS coordinates of
each tree could overcome this problem. In the near future, it is expected that all fruit growers will
plant more using GPS systems as it increases planting efficiency and will be the basic tool to optimize
production and harvest in a precision farming context.
On the other hand, the high percentage of false negative classification of infected trees can be
linked to the presence of limited fire blight symptom expression and infections hidden in the tree.
These types of infections were observed during the field inspections, but they can easily be overlooked
by the spectral imagers. Therefore, we believe that a combination of side viewing and top viewing
imagery will improve the detection capacity of this proposed RS method. And with the coming
of robotics and autonomous drones, a detailed image database can be obtained. Training artificial
intelligence systems in recognizing the (spectral) symptoms of the fire blight disease, would help fruit
growers to monitor and map the disease incidence.
A multitemporal approach might be useful to improve the infection detection probability, and to
lower the number of trees for which the disease status was misclassified. Symptom scoring at oneAgronomy 2020, 10, 615 10 of 12
moment in time is not always representative for the health status of the trees. Trees can show infected
plant parts, which are removed afterwards by the fruit grower, and reappear after some days on
adjacent twigs, fruits. Furthermore, a multitemporal approach may be preferred for a better indication
of fire blight incidence and severity as E. amylovora can be present in the tree without showing any
symptoms [46]. Moreover, multitemporal detection helps to overcome problems with interference of
shadow on and within the trees, detection of small infections and to distinguish between fire blight-like
symptoms caused by other factors than E. amylovora
As is concluded from this work, further optimizations and improvements are needed to enable an
operational monitoring of fire blight with spectral sensors carried by an UAV. Nevertheless, this study
revealed a high potential in the detection of clearly diseased and asymptomatic healthy trees.
Author Contributions: Conceptualization, H.S., S.D., T.D. and D.B.; Data curation, S.D.; Formal analysis,
S.D.; Funding acquisition, T.D. and D.B.; Investigation, H.S. and S.D.; Methodology, H.S. and S.D.; Project
administration, H.S. and T.D.; Resources, T.D. and D.B.; Software, S.D.; Supervision, D.B.; Validation, H.S. and
S.D.; Writing—original draft, H.S. and S.D.; Writing—review and editing, H.S. and S.D. All authors have read and
agreed to the published version of the manuscript.
Funding: This research project RF13/6278 SNEDEBAC is funded by the Federal Public Service—health, food chain
safety and environment.
Acknowledgments: We want to acknowledge the image preprocessing group of VITO for the orthomosaic and
DSM generation.
Conflicts of Interest: The authors declare no conflict of interest.
References
1. Van der Zwet, T.; Orolaza-Halbrendt, N.; Zeller, W. Fire Blight: History, Biology, and Managemen; APS Press: St.
Paul, MN, USA, 2012.
2. Vanneste, J.L. Genetic diversity and host range of Erwinia amylovora? In Fire Blight: The Disease and Its Causative
Agent, Erwinia Amylovora; Vanneste, J.L., Ed.; CABI Publishing: New York, NY, USA, 2000; pp. 55–86.
3. Thomson, S. Epidemiology of fire blight. In Fire blight: The Disease and its Causative agent, Erwinia Amylovora;
Vanneste, J.L., Ed.; CABI Publishing: New York, NY, USA, 2000; pp. 9–36.
4. Vanneste, J.L. What is fire blight? Who is Erwinia amylovora? How to control it? In Fire Blight: The Disease
and its Causative Agent, Erwinia Amylovora; Vanneste, J.L., Ed.; CABI Publishing: New York, NY, USA, 2000;
pp. 1–6.
5. Vrancken, K.; Holtappels, M.; Schoofs, H.; Deckers, T.; Valcke, R. Pathogenicity and infection strategies of
the fire blight pathogen Erwinia amylovora in Rosaceae: State of the art. Microbiology 2013, 159, 823–832.
[CrossRef] [PubMed]
6. Piqué, N.; Miñana-Galbis, D.; Merino, S.; Tomás, J.M. Virulence factors of Erwinia amylovora: A Review. Int. J.
Mol. Sci. 2015, 16, 12836–12854. [CrossRef] [PubMed]
7. Norelli, J.L.; Holleran, H.T.; Johnson, W.C.; Robinson, T.L.; Aldwinckle, H.S. Resistance of Geneva and other
apple rootstocks to Erwinia amylovora. Plant Dis. 2003, 87, 26–32. [CrossRef] [PubMed]
8. Billing, E. Fire blight risk assessment systems and models. In Fire Blight: The Disease and its Causative Agent,
Erwinia Amylovora; Vanneste, J.L., Ed.; CABI Publishing: New York, NY, USA, 2000.
9. Santander, R.D.; Biosca, E.G. Erwinia amylovora psychotrophic adaptations: Evidence of pathogenic potential
and survival at temperature and low environmental temperatures. PeerJ 2017. [CrossRef]
10. Momol, M.T.; Norelli, K.L.; Piccioni, D.E.; Momol, E.A.; Gustafson, H.L.; Cummins, J.L.; Aldwinckle, H.S.
Internal movement of Erwinia amylovora through symptomless apple scion tissue into the rootstock. Plant. Dis
1998, 82, 646–650. [CrossRef]
11. Slack, S.M.; Zeng, Q.; Outwater, C.A.; Sundin, G.W. Microbiological examination of Erwinia amylovora
exopolysaccharide ooze. Phytopathology 2017, 4, 403–411. [CrossRef]
12. Zhao, Y.Q.; Tian, Y.I.; Wang, L.M.; Geng, G.M.; Zhao, W.J.; Hu, B.S.; Zhao, Y.F. Fire blight, a fast-approaching
threat to apple and pear production in China. J. Integr. Agric. 2019, 18, 815–820. [CrossRef]
13. Hyon, J.C.; Yeon, J.K.; Yeon-Jeon, L.; Duck, H.P. Survival of Erwinia amylovora on surfaces of materials used
in orchards. Res. Plant. Dis. 2019, 25, 89–93.Agronomy 2020, 10, 615 11 of 12
14. McManus, P.S.; Jones, A.L. Role of wind-driven rain, aerosols, and contaminated budwood in incidence and
spatial pattern of fire blight in an apple nursery. Plant Dis. 1994, 78, 1059–1066. [CrossRef]
15. Carter, G.A.; Miller, R.L. Early detection of plant stress by digital imaging within narrow stress-sensitive
wavebands. Remote Sens. Environ. 1994, 50, 295–302. [CrossRef]
16. Carter, G.A.; Cibula, W.G.; Miller, R.L. Narrow band reflectance imagery compared with thermal imagery for
early detection of plant stress. J. Plant Physiol. 1996, 148, 515–522. [CrossRef]
17. Filella, I.; Peñuelas, J. The red edge position and shape as indicators of plant chlorophyll content, biomass
and hydric status. Int. J. Remote Sens. 1994, 15, 1459–1470. [CrossRef]
18. Lowe, A.; Harrisonn, N.; French, A.P. Hyperspectral image analysis techniques for the detection and
classification of the early onset of plant disease and stress. Plant Methods 2017, 13, 1–12. [CrossRef]
19. Bagheri, N.; Hosna, M.-M.; Azizi, A.; Ghasemi, A. Detection of Fire Blight disease in pear trees by
hyperspectral dat. Eur. J. Remote Sens. 2018, 51, 1–10. [CrossRef]
20. Delalieux, S.; van Aardt, J.; Keulemans, W.; Schrevens, E.; Coppin, P. Detection of biotic stress
(Venturia inaequalis) in apple trees using hyperspectral data: Non-parametric statistical approaches
and physiological implications. EJA 2007, 130–143. [CrossRef]
21. Abdulridha, J.; Ehsani, R.; Abd-Elrahman, A.; Ampatzidis, Y. A Remote Sensing technique for detecting
laurel wilt disease in avocado in presence of other biotic and abiotic stresses. Comput. Electron. Agric. 2019,
156, 549–557. [CrossRef]
22. Garcia-Ruiz, F.; Sankaran, S.; Maja, J.M.; Lee, W.S.; Rasmussen, J.; Ehsani, R. Comparison of two aerial
imaging platforms for identification of Huanglongbing-infected citrus trees. Comput. Electron. Agric. 2013,
91, 106–115. [CrossRef]
23. Romero-Trigueros, C.; Nortes, P.A.; Alarcón, J.J.; Hunink, J.E.; Parra, M.; Contreras, S.; Nicolás, E. Effects
of saline reclaimed waters and deficit irrigation on Citrus physiology assessed by UAV remote sensing.
Agric. Water Manag. 2017, 183, 60–69. [CrossRef]
24. Zhang, J.; Huang, Y.; Pu, R.; Gonzalez-Moreno, P.; Yuan, L.; Wu, K.; Huang, W. Monitoring plant diseases and
pests through remote sensing technology: A review. Comput. Electron. Agric. 2019, 165, 104943. [CrossRef]
25. Jarolmasjed, S.; Sankaran, S.; Marzougui, A.; Kostick, S.; Si, Y.; Quirós Vargas, J.J.; Evans, K. High-Throughput
Phenotyping of; Fire Blight Disease Symptoms Using Sensing Techniques in Apple. Front. Plant Sci. 2019, 10,
576. [CrossRef]
26. Diagnostic protocols for regulated pests. PM 7/20 (2) Erwinia amylovora. EPPO Bull. 2013, 4, 21–45. [CrossRef]
27. King, E.O.; Ward, M.; Raney, D.E. Two simple media for the demonstration of pyocyanin and fluorescein.
J. Lab. Clin. Med. 1954, 44, 401–407.
28. Tack, N.; Lambrechts, A.; Soussan, S.; Haspeslagh, L. A compact, high speed, and lowcost hyperspectral
imager. In Proceedings of the Volume 8266, Silicon Photonics VII, 82660Q, San Francisco, CA, USA,
9 February 2012. [CrossRef]
29. Sima, A.; Baeck, P.-J.; Nuyts, D.; Delalieux, S.; Livens, S.; Blommaert, J.; Delauré, B.; Boonen, M. Compact
Hyperspectral Imaging System (COSI) for small Remotely Piloted Aircraft Systems (RPAS)—System overview
and first performance evaluation results. Int. Arch. Photogramm. Remote Sens. Spatial Inf. Sci. 2016, XLI-B1,
1157–1164. [CrossRef]
30. Tucker, C.J. Red and photographic infrared linear combinations for monitoring vegetation.
Remote Sens. Environ. 1979, 8, 127–150. [CrossRef]
31. Elvidge, C.D.; Chen, Z. Comparison of broad-band and narrow band red and near infrared vegetation indices.
Remote Sens. Environ. 1995, 54, 38–48. [CrossRef]
32. Blackburn, G.A.; Pitman, J.I. Biophysical controls on the directional spectral reflectance properties of bracken
(Pteridium aquilinum) canopies: Results of a field experiment. Int. J. Remote Sens. 1999, 20, 2265–2282.
[CrossRef]
33. Gao, X.; Huete, A.R.; Ni, W.; Miura, T. Optical-biophysical relationships of vegetation spectra without
background contamination. Remote Sens. Environ. 2000, 74, 609–620. [CrossRef]
34. Xue, J.; Su, B. Significant Remote Sensing Vegetation Indices: A Review of Developments and Applications.
J. Sens. 2017, 1, 1–17. [CrossRef]
35. Jiang, Z.; Huete, A.R.; Chen, J.; Chen, U.; Li, J.; Yan, G.; Zhang, X. Analysis of NDVI and scaled difference
vegetation index retrievals of vegetation fraction. Remote Sens. Environ. 2006, 101, 366–378. [CrossRef]
36. Metz, C.E. Basic principles of ROC analysis. Semin. Nucl. Med. 1978, 8, 283–298. [CrossRef]Agronomy 2020, 10, 615 12 of 12
37. Newson, R. Parameters behind “non-parametric” statistics: Kendall’s τ and Somers’ D and median differences.
Stata J. 2002, 2, 45–64. [CrossRef]
38. Boyd, K.; Eng, K.H.; Page, C.D. Area under the Precision-Recall Curve: Point Estimates and Confidence
Intervals. In Machine Learning and Knowledge Discovery in Databases; volume 8190 of LNCS; Hendrik, B.,
Kristian, K., Siegfried, N., Filip, Z., Eds.; Springer: Berlin/Heidelberg, Germany, 2013; pp. 451–466.
39. Therneau, T.; Atkinson, B.; Ripley, B. Rpart: Recursive Partitioning and Regression Trees, R Package Version
4.1–10, 2015. Available online: https://CRAN.R-project.org/package=rpart (accessed on 12 April 2019).
40. Venables, W.N.; Ripley, B.D. Tree based methods. In Modern Applied Statistics with S, 4th ed.; Springer: New
York, NY, USA, 2002.
41. Ahmad, I.S.; Reid, J.F. Evaluation of colour representations for maize images. J. Agric. Eng. Res. 1996, 63,
185–195. [CrossRef]
42. Laliberte, A.S.; Rango, A.; Herrick, J.E.; Fredrickson, E.L.; Burkett, L. An object-based image analysis
approach for determining fractional cover of senescent and green vegetation with digital plot photography.
J. Arid Environ. 2007, 69, 1–14. [CrossRef]
43. Fahrentrapp, J.; Ria, F.; Geilhausen, M.; Panassiti, B. Detection of Grey Mold leaf infections prior to visual
symptom appearance using a five-band multispectral sensor. Front. Plant Sci. 2019, 10, 1–14. [CrossRef]
44. Ahlawat, V.; Jhorar, O.; Kumar, L.; Backhouse, D. Using hyperspectral remote sensing as a tool for early
detection of leaf rust in blueberries. In Proceedings of the 34th International symposium on Remote Sensing
of Environment – The GEOSS Era: Towards Operational Evironmental Monintoring, Sydney, Australia,
10–15 April 2011.
45. Adeline, K.R.M.; Chen, M.; Briotteta, X.; Pang, S.K.; Paparoditis, N. Shadow detection in very high spatial
resolution aerial images: A comparative study. ISPRS J. Photogramm. Remote Sens. 2013, 82, 31–38. [CrossRef]
46. Crepel, C.; Maes, M. Hibernation of the fire blight pathogen Erwinia amylovora in host plants. Meded. Fac.
Landbouwk Toegep. Biol. Wet. (Univ. Gent) 2000, 65, 19–25.
© 2020 by the authors. Licensee MDPI, Basel, Switzerland. This article is an open access
article distributed under the terms and conditions of the Creative Commons Attribution
(CC BY) license (http://creativecommons.org/licenses/by/4.0/).You can also read