Marches Local Enterprise Partnership Joint Executive Committee
←
→
Page content transcription
If your browser does not render page correctly, please read the page content below
Published 18 December 2014

SUPPLEMENT TO THE AGENDA FOR

Marches Local Enterprise
Partnership Joint Executive
Committee
Thursday 11 December 2014
10.00 am
Craven Arms Community Centre, Newington Way, Craven
Arms, Shropshire, SY7 9PS

                                                                                Pages

6.   MARCHES ENTERPRISE ZONE                                                    3 - 40

      DTZ Report ‘Hereford Enterprise Zone, Accelerating Delivery: Investment
      Strategy (redacted)
Published in redacted form, 18 December 2014
PRIVATE & CONFID
               DENTIAL                              AGENDA ITEM 6
www.dtz.com

Hereeford Ente
             erprisse Zone
Acceleerating Delive
                   ery: Investmen
                                nt Strattegy

Prepared on beh
              half of
DCLG
10 October 2014
              4

DTZ, a UGL co
            ompany

Job No/Ref: 140MK700

                             3
Contents
Executive summary                                                                                  4
1       Introduction                                                                               9
1.1     Enterprise Zone rates additionality mechanism                                              9
1.2     Hereford Enterprise Zone                                                                   9
2       Market commentary                                                                         11
2.1     Context                                                                                   11
2.2     Market baseline                                                                           11
2.3     Prospects for growth                                                                      12
2.3.1        General market conditions                                                            12
2.3.2        Impact of the Enterprise Zone                                                        12
2.3.3        Competing sites                                                                      13
2.3.4        Market summary                                                                       13
3       Scenario modelling                                                                        14
3.1     Scenario 1: Base case                                                                     15
3.1.1        Take!up assumptions                                                                  15
3.1.2        Land receipts                                                                        16
3.1.3        Interventions                                                                        17
3.1.4        Revenue expenditure                                                                  17
3.1.5        Financial analysis                                                                   18
3.2     Scenario 2: EZ interventions scenario (without River Wye Crossing)                        19
3.2.1        Take!up assumptions                                                                  19
3.2.2        Land receipts                                                                        19
3.2.3        Interventions                                                                        20
3.2.4        Revenue expenditure                                                                  21
3.2.5        Financial analysis                                                                   21
3.3     Scenario 3: EZ interventions (River Wye Crossing completes 2021)                          22
3.3.1        Take!up assumptions                                                                  23
3.3.2        Land receipts                                                                        24
3.3.3        Interventions                                                                        24
3.3.4        Revenue expenditure                                                                  25
3.3.5        Financial analysis                                                                   26
4       Findings & conclusions                                                                    29
4.1     Performance of the Enterprise Zone                                                        29

                                                                             Hereford Enterprise Page 2
                                                                             Zone
                                                          4
4.2 Approach to funding 30
4.3 Recommendations 31
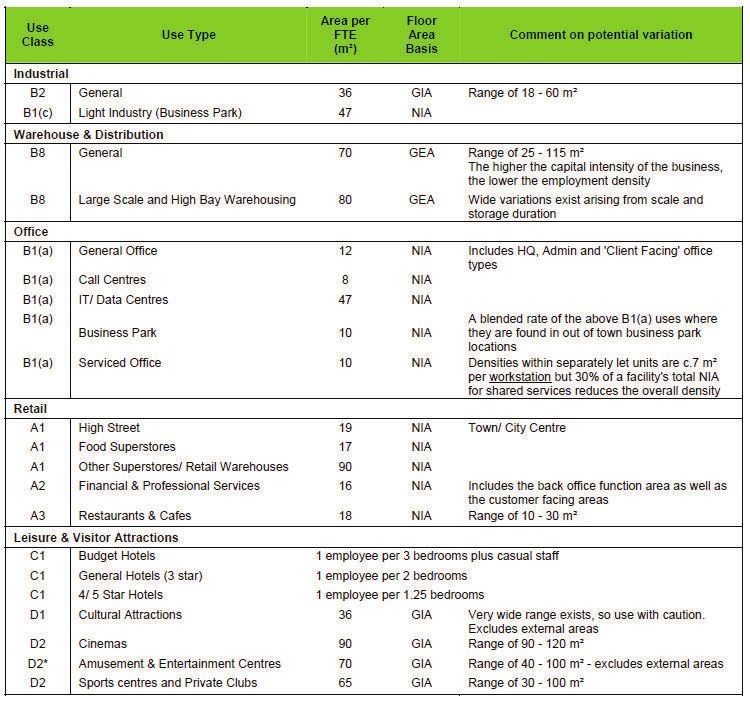
Appendix A: HCA employment density guidelines 33
Appendix B: Intervention measures 34
Appendix C: Capital Receipts Error! Bookmark not defined.
Appendix D: Financing Arrangements 37
Hereford Enterprise Page 3
Zone
5Executive summary
The Rotherwas Industrial Estate was formally awarded Enterprise Zone (EZ) status on 17th August 2011. The site was
nominated by the Marches Local Enterprise Partnership (LEP) with an aspiration to develop part of the site into a
centre of excellence for the defence and security sector with additional employment hubs focused on advanced
technologies, environmental technologies and food and drink technologies. The Marches LEP anticipates that the
scheme will become a catalyst for enhanced economic growth throughout the Marches through the creation of highly
skilled jobs and encouragement of overseas investment into the area.
The Estate is the largest estate in the Hereford City “sub area” and the county as a whole, extending to 125 hectares
(300 acres). In terms of speculative new build industrial and warehouse units and land to be brought forward for
development, the vast majority of supply for the city lies within the Rotherwas estate.
This report considers a range of intervention measures in enabling infrastructure and other site preparation
investments in order to optimise the performance of the Enterprise Zone.
Although intervention by the Council to fund enabling and infrastructure works will accelerate development to a
degree, critical to the success of the EZ is the completion of the River Wye Crossing by 2021. Without this key
investment, the constraints on the highway network mean net new floor!space within the Zone will be limited to
approximately 50,000 sq m.
The development of the River Wye Crossing is critical to the success of the EZ as without it almost 100,000 sq m of the
total floor space proposed cannot be developed. This translates into an estimated loss of potential business rates
income to the LEP of c. £33.1m over the life of the Enterprise Zone.
The LEP has already successfully applied for £27m funding via the Strategic Economic Plan (SEP) to build a road link in
the South of the city between the A49 and A465. This represents the first leg of a potential full western relief road
around the city. The following segment between the A465 and A438, which includes the River Wye Crossing, will cost
an estimated additional £67m. Further Investment is required to fund these works and this study considers the extent
to which the income from business rates growth could contribute to this.
To illustrate the importance of the River Wye Crossing and the impact its construction would have on the business
rates growth income, this report considers the financial position under three scenarios:
Scenario 1: ‘Base Case’– summarises interventions and outcomes to date with no further proactive
intervention then adopted.
Scenario 2: EZ Interventions partially implemented (River Wye Crossing is not completed) – considers a
range of further intervention measures designed to improve the performance of the EZ but on the
understanding that the construction of the River Wye Crossing does not occur.
Scenario 3: EZ Interventions fully implemented and River Wye Crossing completes – considers a full range
of further intervention measures designed to optimise the performance of the EZ on the understanding that
the River Wye Crossing will go ahead – and considers the capacity of the EZ to contribute to the cost of the
crossing.
The table below summarises the total income and expenditure under each scenario and highlights that there is a
significant risk that the later phases of development will not go ahead without the construction of the River Wye
Crossing. This will have significant ramifications for LEP’s expected rates revenues.
Hereford Enterprise Page 4
Zone
6Scenario Scenario Scenario
1 (£m) 2 (£m) 3 (£m)
PROJECTED RATES INC COME* 21.3 33.3 79.4
CONTINGEENCY (ON IN NCOME) @ 10% (2.1) (3.3) (7.9)
Capital Recceipts 0.7 0.8 3.5
Net Capitaal Expenditurre (3.8) (10.1) (17.3)**
Financing costs (4%) (2.0) (5.9) (8.6)
GROSS CA AP EX. (INCL. FINANCE CO
OSTS @ 4% A
AND CAP REC
CEIPTS) (5.1) (15.2) (22.4)**
REVENUE EXP. (3.5) (3.9) (5.1)
SURPLUS//DEFICIT (INC CL. CONTING
GENCY) 10.6 10.8 43.9
*includes deducttion of 3% to allow
w for bad debt and
d 2% allowance forr rates reliefs
**Figure does no
ot include contribuution to River Wye
e Crossing
Figure 1: Net iincome summaary
Figure 2 beelow shows the t net incomme position under each Scenario ove er the 25 yeear appraisal period. Thiss
demonstratees that althouugh it takes lo
onger for the net income re eceived under Scenario 3 tto become po ositive due to
o
the increased
d level of inveestment, oncee a positive p osition is reacched, take!up
p increases rappidly and the income fromm
year eight on
nwards is significantly greatter than the aanticipated ne
et income under Scenarios 1 and 2.
Figure 2: Net income summaary chart
Hereford En
nterprise Page 5
Zone
7The net inco ome position under each scenario
s is furrther illustratted by Figure 3 below. Thiis graph demonstrates thee
significant increase in inco
ome which could be achieveed under the Scenario 3 assumptions.
Figure 3: Incom
me and expend
diture summaryy
As is illustratted by Figuree 1, the difference in net inncome under Scenario 1 and Scenario 2 is marginal at just underr
£250k over tthe 25 year ap ppraisal period. If viewing tthis in purely financial term
ms, the risk of committing to
t the level off
investment p proposed mayy be considere ed to be too ggreat for the return.
r Howevver, the widerr economic be enefits should
d
also be consiidered. The nu umber of jobss created undeer each scenaario can be outlined as folloows1:
Scenario
o1 Scenario 2 Scenario 3
Jobs created prior to 2021
1 986 1,858 3,965
3
Total jobs creeated 1,211
1 1,858 5,887
5
Figure 4: Jobs created
As shown in Figure 4, the number of jobs created in the period to o 2021 under Scenario 1 is only half the total reachedd
under Scenaario 2 by thiss date. Job creation
c is th erefore takinng place at a much sloweer pace under Scenario 1..
Furthermoree, there is a significant diffference in thhe overall job bs created ovver the life oof the EZ of 647 between n
Scenarios 1 aand 2. Figure 4 also servess to highlight the significan
nt economic benefits
b to bee realised by implementing
i g
the recommeendations pro oposed under Scenario 3. Inn addition to the jobs creatted the EZ intterventions would leveragee
commercial d development worth an estiimated value of up to £86.4 4m. This is sum
mmarised forr each scenario
o in Figure 5.
Scenario
o1 Scenario 2 Scenario 3
Estimated vaalue of commeercial develop
pment 20.3 30.0 86.4
8
Figure 5: Estim
mated value of commercial development
1
Job creation
n figures baseed on the per sq m rates ouutline in the Homes and Com
mmunities Aggency’s Emplo
oyment
Densities Guiide (2010). Seee Appendix A
Hereford En
nterprise Page 6
Zone
8Both Scenarios 2 and 3 will also attract significantly more new businesses to the area than under the Scenario 1
assumptions and through the development of a greater level of innovation space will encourage more start!up
activity in the region which will further contribute to the local economy.
The approach to modelling each of the scenarios relies on HC taking a risk on the investments in advance of the
business rate income as the LEP is not permitted to borrow. It is then assumed that the cost of funding the
interventions will be reimbursed to HC from the LEPs business rates growth income.
One approach to funding these interventions could be to insist that all business rates growth income is directed
towards the priority repayment of borrowings for the interventions approved. However, if this approach were
adopted then all revenues from rates income growth available to the LEP under Scenario 3 would be committed until
2026 and no further investment could be considered until the approved investments were cleared.
The above analysis has therefore been prepared on the basis that the approved interventions are all financed using
annuity loans over the remainder of the life of the EZ such that all debts are fully paid down by the time these expire
(i.e. 2038). An interest rate of 4% has been used. Adopting this approach, the forecast rates growth income under
Scenario 3 exceeds the cost of funding the interventions (but not including the River Wye Crossing) from 2018
onwards so that there is an estimated surplus of £43.9m over the 25 year life of the EZ which can either be
accumulated or used by the LEP for other purposes.
RECOMMENDATIONS
This study has identified several issues to which we recommend further consideration should be given. These can be
summarised as follows:
1. There is a causal link between the development of the River Wye Crossing and the level of rates income the
LEP can expect to achieve over the life of the EZ. Consideration should be given to using these expected
revenues as part of the funding package for the River Wye Crossing. The level of contribution appropriate
requires further consideration from the LEP in view of alternative sources. Clearly it will be preferable for DfT
to fund the full cost.
2. Herefordshire will require an undertaking from the LEP in order to carry out the interventions proposed. The
LEP should therefore consider the balance of cost, risk and return and the extent to which these represent
value for money and are appropriate for the socio!economic outcomes achieved.
3. Whilst the difference between Scenarios 1 and 2 in terms of the net business rates income receivable is
minimal at an estimated £250k over the life of the EZ, the economic benefits to be realised by implementing
the interventions assumed under Scenario 2 are substantial. The value to the region of the anticipated jobs
created, the increased value of commercial development and investment in the region through the re!
location of new businesses to the area should all be considered in any future discussions around the
appropriate level of intervention required and how this will be funded.
4. Since the Resource Review and proposals for authorities’ to retain 50% of rates growth between rebase
periods, Herefordshire Council could lose out on this income in relation to new development within the EZ
where the income goes to the LEP. Furthermore, Herefordshire Council will also incur further administrative
time and costs in dealing with the EZ and is taking a risk on the investments in advance of the business rate
income. The LEP should consider making provision to recognise the impact on the Council. It is understood
Hereford Enterprise Page 7
Zone
9that this has been agreed at the Bristol and West of England EZ and has been raised as an issue in a number
of other Zones.
Hereford Enterprise Page 8
Zone
101 Introduction
DTZ has been appointed to assess the robustness of the business rate growth income projections for the Hereford
Enterprise Zone. This report outlines projections of Business Rate Growth Income (BRGI) across the Zone and reviews
the scope of EZ Business Rate Income to cover the cost of financing investment in enabling works and intervention
measures.
1.1 ENTERPRISE ZONE RATES ADDITIONALITY MECHANISM
Under the EZ regulations, the Marches Local Economic Partnership (LEP) is entitled to retain all additional business
rates generated within the EZ boundary annually for a period of 25 years. The LEP is entitled to redistribute these
business rates across the LEP area according to their economic objectives and priorities. The business rate income
therefore represents an important source of funding for local economic development.
However, the scale of this additional funding depends on the delivery, and crucially, the timing of delivery of new
development and therefore business rate income within the EZ boundary. This is because the business rate retention
provision is time limited for a fixed period of 25 years, which started at April 2013. As this 25 year programme is
already running and diminishing with time, there is extra incentive on LEPs to accelerate the delivery process so as to
maximise the amount of money in the business rate pool.
The delivery of development within the EZ is therefore critical to both unlocking and maximising business rate
additionality. Accordingly, some Local Authorities are looking to borrow against the projected business rate income to
forward fund infrastructure and enabling works, using prudential borrowing or loan finance from revolving investment
funds. This form of Tax Increment Finance (TIF) can be used to unlock barriers to development and accelerate the
delivery process.
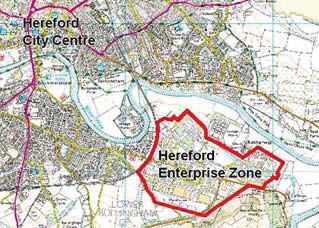
1.2 HEREFORD ENTERPRISE ZONE
The Hereford Enterprise Zone is a 71 ha site to the south east of
the city, centred around the Rotherwas Industrial Estate.
The EZ is divided into seven distinct but linked mini zones and
already benefits from the Rotherwas access road which
completed in June 2008 and provides the estate with direct access
to the A49, and therefore the M50 and the rest of the motorway
network.
Each of the sites across the Zone are in various states of
development readiness relating to other on and off site
infrastructure requirements. £3.8m has already been committed in the site through business rate income which has
helped to overcome a number of the barriers to development. However, there remain some significant constraints
affecting the immediate development of large areas of the remainder of the EZ land area with a level of intervention
required to address the barriers to development varying across each of the sites.
Hereford Enterprise Page 9
Zone
11The on!site infrastructure requirements can be summarised as follows:
! Significant Intervention required:
North Magazine: The development of this 20 hectare “mini zone” relies on a significant
investment in utilities diversions, especially electricity across the River Wye, currently
estimated at £1.5m
Chapel Road – high demolition costs
! Limited intervention required:
Straight Mile South Magazine – close to main road and utilities, just requirement for access
roads in places
South Magazine : Limited investment in utilities and broadband; access roads already in
place
In order to address these issues, the Council has identified a package of intervention measures totalling £17.3m. Full
details of the proposed interventions can be found in Appendix B ‘Intervention Measures – B3 Scenario 3
Interventions’.
The agreed package of intervention measures is ‘game changing’ in that it addresses barriers to occupation for at least
a significant amount of the EZ land and will promote immediate development of units for occupiers. This study works
on the basis that the present package of interventions is certain and considers further actions that the LEP/Local
Authority can take to promote the acceleration of economic growth within the EZ to avoid the momentum being lost.
However, irrespective of the pace of enabling infrastructure and other site preparation investments in the immediate
environment of the Zone, a critical investment is completion of the River Wye Crossing by 2021 which will link the EZ
with the primary road network. Without this key investment, the constraints on the highway network will mean net
new floor!space at the EZ will be capped through the LDO at approximately 50,000 sq m. A significant programme of
investment in the relief road is planned between 2016 and 2023, but the River Wye Crossing is required by 2021, and
a contribution from the Zone may facilitate other investment.
Hereford Enterprise Page
Zone 10
122 Market commentary
To inform our view on take up throughout the life of the EZ, we have reviewed the nature of the commercial property
market in the City.
2.1 CONTEXT
The Rotherwas industrial estate is over 125 hectares in size and has over 125 companies operating within it. This site
was formerly a war time munitions factory which has been subject to piecemeal development since the 1970s. The
entire site is covered by policy E5 in the Unitary Development plan (UDP) as safeguarded employment land and
buildings. However, a number of specific sites within the estate are allocated as E1 sites for new B1, B2 and B8
development. Available development land within the estate can be divided into the following four areas:
! Various plots within the estate, predominantly fronting ‘The Straight Mile’ (Holme Lacy Road);
! The Southern Magazine site, accessed from an extension to a local estate road (Haugh Road);
! Phase 3: The Northern Magazines site, accessed via a new link road from Vincent Carey Road;
! Phase 4: The Chapel Road area.
Alongside the allocations set out in the UDP, the site is also subject to the Herford Enterprise Zone Local Development
Order (LDO) which was adopted in April 2013. The LDO provides for the following:
Granting developers planning permission subject to conditions for development within Classes B1, B2 and B8.
New development is effectively capped through the LDO at 50,000 sq m due to highways constraints.
Removing the need to submit some information in relation to statutory environment, flood and transport
impact assessments
Withdrawing the need to contribute towards necessary infrastructure
Withdrawing the requirement to pay for pre!application advice for proposals complying with the LDO
The Rotherwas Industrial Estate was formally awarded Enterprise Zone (EZ) status on 17th August 2011. The site was
nominated by the Marches Local Enterprise Partnership (LEP) with an aspiration to develop part of the site into a
centre of excellence for the defence and security sector with additional employment hubs focused on advanced
technologies, environmental technologies and food and drink technologies. The Marches LEP anticipates that the
scheme will become a catalyst for enhanced economic growth throughout the Marches through the creation of highly
skilled jobs and encouragement of overseas investment into the area.
2.2 MARKET BASELINE
The baseline is that employment land take up in Hereford is low, which in part is related to the area’s peripheral
position. This constrains interest to a relatively local market, which, in DTZ’s view would make it rare for take up to
regularly exceed 50,000 sq ft per annum. Notwithstanding this, there is also evidence that demand is constrained by a
lack of supply – there are relatively few vacancies across the Rotherwas Industrial Estate considering its large size,
which led the most recent Employment Land Review to suggest that interest in the site is high.
Indeed, regarding potential development land in the environs of the estate, all of it to varying degrees has been
encumbered by supply constraints:
Hereford Enterprise Page
Zone 11
13! Land around the Straight Mile and Southern Magazine is most readily available for development, offering a
range of plot sizes and with new road infrastructure recently to serve new development within the Phase 2
Southern Magazine site.
! The Northern Magazine site is considered to be a medium term proposition requiring the provision of
infrastructure and addressing existing environmental site constraints such as ground contamination (given
the former munitions factory use) and ecology (including the potential for great crested newts and bats).
! The Chapel Road area is seen as a long term opportunity, with an aspiration to redevelop existing ‘Romney
Huts’ and other existing buildings of poorer quality.
Notwithstanding site level development constraints, demand that might have driven further development at
Rotherwas has been further constrained by what has been perceived as the wider geographic limitations of its
position “south of the river”, where demand has traditionally been more limited than to the north. Despite this the
ELR [Employment Land Review], Drivers Jonas Deloitte 2012] revealed that the development community considered
that a southern by!pass was highlighted as being an infrastructure project that would be particularly beneficial. Given
the cap of 50,000 sq m, the development of the River Wye Crossing is essential to the success of the EZ.
The ELR reported that the view of agents regarding Rotherwas on supply is mixed. Some agents consider that the
supply is sufficient to meet current demand (apparently based on historical take up rates, other agents however
suggested that supply is restricted [by an inherent lack of available land due to fundamental infrastructure
constraints].
The fundamental premise of the EZ is that investment in addressing the site’s development constraints, both macro
(access to the strategic road network, including the relief road and River Wye Crossing), and micro (various
infrastructure capacity issues around the Estate and generally variable development readiness at the site level) will
release development sites to address demand.
2.3 PROSPECTS FOR GROWTH
2.3.1 General market conditions
Overall, development at the site has been constrained by a number of factors:
! Fundamental Development Viability Constraints: Demand in Hereford is predominantly for small scale
premises from local businesses, which serves to constrain rentals, drive unfavourable development yields,
and hence result in capital values not sufficient to make speculative development viable; whilst these same
businesses are not of a scale to be able to fund their own be!spoke developments
! Significant Micro or “Site Based” Infrastructure Constraints; Notwithstanding the above, opportunities for
progressing potential gap funding schemes involving a developer have been constrained by the significant
upfront costs of delivering site enabling infrastructure pushing up the viability gap to such a level of grant
requirement to make the scheme untenable
! The fundamental Macro infrastructure constraint ! the overall poor accessibility of the Rotherwas Industrial
Estate derived from being “south of the river” and the cap placed on development of 50,000 sq m which has
been put in place until the completion of the River Wye Crossing.
2.3.2 Impact of the Enterprise Zone
The constrained nature of supply means that it is difficult to accurately forecast demand. The creation of the EZ and
associated availability of employment sites appears to have had the affect of stimulating activity, possibly unlocking
‘pent!up’/latent demand. Three plots have already sold and another seven or eight are under detailed discussions.
Hereford Enterprise Page
Zone 12
142.3.3 Competing sites
The Turner and Company Market Demand Report (August 2013), highlighted the potential competition from the
Moreton Park, to the north of the city, but concluded that early development at Rotherwas would establish the
location ahead of Moreton Park: !
“important to note that there could be competition to any development in the Rotherwas Industrial Estate Enterprise
Zone area. Moreton Park has planning permission for 550,000sqft of accommodation and some of this space could be
developed to compete with the Enterprise Zone and any prospective small employment unit schemes within the area. Of
course, there are some land allocations also north of the river, such as around the new cattle market area which may
realise some competition in time.
However, we believe that if development within the Enterprise Zone can take place in the reasonably near future it
should be able to capitalise on the established credentials of Rotherwas Industrial Estate and get ahead of the
competition. In so doing, the Rotherwas area will enhance and improve its own standing locally and become an even
bigger draw to local businesses, even in relation to those who prefer the northern side of the city at the current time”.
2.3.4 Market summary
The site faces numerous development constraints:
! The nature of the market is that speculative development to serve the local company base, is not viable
! Site related infrastructure constraints serve to push up development cost so as to make potential gap funding
support to developers of speculative space, untenable
! Further growth of the Rotherwas Industrial Estate from potential outside investors has been constrained by
the fundamental accessibility constraint of being “south of the river”
! Development will be limited to approximately 50,000 sq m until the completion of the River Wye Crossing.
Notwithstanding this, proposed Enterprise Zone interventions will directly address these constraints;
! Herefordshire Council as direct developer of a number of business space schemes for sector specific, small
businesses, enabled by “gap funding” from the EZ
! Site Specific infrastructure interventions (detailed below)
! The funding of the River Wye Crossing to ensure delivery by 2021
On this basis, the EZ has been able to build a significant development pipeline of known requirements, which are at
various stages of the development process. The schedule of known take up requirements is a dynamic schedule and
gives a good degree of confidence as regards take up in the initial years of the EZ.
Hereford Enterprise Page
Zone 13
153 Scenario modelling
The performance of the EZ in terms of the new development and job creation achieved will be dependent on the
approach taken by Herefordshire Council. To date, the Council has adopted a proactive approach to promoting the EZ
through a range of positive intervention measures. In the following section we consider scenarios reflecting a range of
intervention measures to further enhance the performance of the EZ.
Scenario 1: ‘Base Case’– summarises interventions and outcomes to date with no further proactive
intervention then adopted.
Scenario 2: EZ Interventions partially implemented (River Wye Crossing is not completed) – considers a
range of further intervention measures designed to improve the performance of the EZ but on the
understanding that the construction of the River Wye Crossing does not occur.
Scenario 3: EZ Interventions fully implemented and River Wye Crossing completes – considers a full range
of further intervention measures designed to optimise the performance of the EZ on the understanding that
the River Wye Crossing will go ahead – and considers the capacity of the EZ to contribute to cost of the
crossing.
The schedules below have been constructed with HC with due consideration given to the timing and pace of the EZ
infrastructure programme, the scale and pattern of known investments to date, and what take up is likely to revert to
in the longer term, once initial “pent up” / latent demand for space from local businesses (in the target sectors) has
been essentially satisfied.
The geographical pattern of investment is closely related to the likely availability of serviced land across the EZ, which
will be a function of the scale of infrastructure investment required.
! Land around the Straight Mile and Southern Magazine is most readily available for development, offering a
range of plot sizes and with new road infrastructure to serve new development within the Phase 2 Southern
Magazine site.
! The Northern Magazine site is considered to be a medium term proposition requiring the provision of
infrastructure and addressing existing environmental site constraints such as ground contamination (given
the former munitions factory use) and ecology (including the potential for great crested newts and bats).
! The Chapel Road area is seen as a long term opportunity, with an aspiration to redevelop existing ‘Romney
Huts’ and other existing buildings of poorer quality.
DTZ has devised a model which brings together the overall financial impacts of the EZ including business rates
additionality arising from new development set against investment in interventions and administrative / revenue costs
of running the EZ. The model can be used to analyse a range of scenarios for intervention by the LEP. This can be
done on a site!by!site basis or information aggregated for the EZ as a whole. The model enables the LEP to
demonstrate the value of intervention and returns on any upfront investment required to ensure new development
starts. This analysis enables the LEP to develop an investment plan or package of intervention measures that will
optimise the performance of the EZ and considers the following:
1. Forecast business rates income
2. Land receipts
3. Investments/intervention measures
4. Revenue Expenditure
Hereford Enterprise Page
Zone 14
16We have developed the model for the Hereford EZ to include:
Projected business rate income from each anticipated hereditament
Site by site infrastructure / enabling investment requirements
Modelling of scenarios to show the impact on business rate income of accelerating development.
The key assumptions applied to the model are as follows:
Inflation has been applied at 2.5% in!line with the Bank of England’s target rate of inflation
Evaluation period of 25 years.
start date of 1 April 2013
Multi site model to calculate income and expenditure profiles
Each site phased, based on an assumed take up profile linked to market analysis
Discounted cash flow analysis to calculate net present costs, using a nominal discount rate of 6.09% (real
discount rate of 3.5% in accordance with HM Treasury Green Book)
Contingency of 10% applied to all business rate growth forecasts, further allowances bad debt and
reliefs totalling 5%.
All estimates of future take up and rates revenues are agreed with HC. These are estimates only and there can be no
guarantee of future development or future business rates growth income.
3.1 SCENARIO 1: BASE CASE
The Base Case scenario assumes that no further investment is made in the site beyond the intervention measures
already implemented. Whilst this is not being considered as an option by the Council, it has been included within this
report for the purposes of comparison.
3.1.1 Take!up assumptions
Whilst the current package of interventions identified for the EZ is sufficient to enable development across a small
portion of the site, without further investment in the wider EZ, it is likely that this momentum will be lost and future
development will be delayed. The assumption has therefore been made that all future development beyond 2015 will
be delayed if no further investment is made. Additionally, there will be elements of the proposed development which
will not take place at all due to the significant investment required in specific parts of the EZ. This includes the
development of Skylon Court 2, Fuse House, and the Food Technology Centre, all proposed development on Chapel
Road and the North Magazine site. These sites have therefore been removed completely from the take!up
assumptions and assumed to produce nil rates income over the life of the Enterprise Zone.
Based on the assumption that no further interventions are made beyond those already committed, the following level
of take!up can be anticipated:
Year (Take!up Sq m)
2014 1,600
2015 15,550
Hereford Enterprise Page
Zone 15
17Year (Take!up Sq m)
2016 0
2017 1,775
2018 3,000
2019 1,800
2020 1,600
2021 1,450
2022 1,550
2023 1,450
2024 1,375
2025 1,375
TOTAL 32,525
Figure 6: Scenario 1 Take!up
The figures to 2018 are based on known enquiries, tailing off to circa 1,375 sq m in 2025. As the cumulative take!up of
space increases year!on!year, the level of business rates income becomes greater. This is illustrated by the projected
business rates income shown in Figure 10.
3.1.2 Land receipts
With the development of each new Hereditament will also come a land receipt to Herefordshire Council as owner of
the land. A portion of the land receipt will consist of “betterment” value created through the proposed interventions,
and it is this “betterment” which is recycled into the EZ model upon the sale of the land, with Herefordshire Council
retaining the “pre!betterment” land value.
The pre!betterment value has been calculated by Herefordshire Council on the basis of the approach of:
Serviced Land Value (S) less Cost of additional infrastructure works required (R) = Betterment (B)
The timing and values of these receipts are inherently linked to the take!up of space and will therefore vary under
each scenario. The following assumptions have been made under the Base Case scenario:
Year Capital Receipt (£000)
2013 23
2014 296
2015 !
2016 !
2017 60
2018 67
2019 !
2020 53
2021 !
2022 53
2023 51
2024 51
TOTAL 654
Hereford Enterprise Page
Zone 16
18Figure 7: Scenario 1 land receipts
A more detailed breakdown of these receipts can be found in Appendix C.
3.1.3 Interventions
To date, £3.8m of investment has been made to promote immediate development of units for occupiers as follows:
Cost of
interventions
Year
per annum
(£000)
2012 994
2013 1,317
2014 1,462
3,773
Figure 8: Scenario 1 interventions
Under the Base Case no further interventions/investments are planned. As for all options the analysis has been
undertaken on the basis that these works are funded over the life of the EZ using annuity loans at an interest rate of
4% such that all investments are fully paid down by 2038. This is illustrated in Figure 10.
A more detailed breakdown of the expenditure can be found in Appendix B.
3.1.4 Revenue expenditure
In order for development to occur in!line with the take!up assumptions outlined above, the Council will need to
resource the project appropriately to manage development. Revenue expenditure of £2.9m for staffing and
operational costs has been identified. This effectively represents a management of the existing surge of activity in
terms of the sales and construction and then a modest tick over to deal with enquiries and interest.
Year Annual Revenue
Expenditure (£000)
2012 200
2013 300
2014 400
2015 200
2016 200
2017 150
2018 to 2026 900 (100 pa)
2027 to 2037 550 (50 pa)
TOTAL 2,900
Figure 9: Scenario 1 revenue expenditure
For all options, these costs are treated as revenue expenditure in year. This is illustrated in Figure 10.
Hereford Enterprise Page
Zone 17
193.1.5 Fin
nancial anallysis
Figure 10 below shows the income and d expenditure profile of the e Enterprise Zone
Z in each yyear over the life of the EZ..
Based on currrent projectio
ons, affordabiility of financee will be an issue in the earrly years with a positive nett income onlyy
being receiveed from 20177 onwards. Hoowever, beyonnd 2017 the EZ E produces a surplus in eaach year for the remainderr
of the life of the EZ.
Figure 10: Sceenario 1 incomee and expenditu
ure profile
As accountab ble body for the
t EZ, HC is financing the interventions and revenue e funding reqquired. It is exxpected thesee
costs will be recovered frrom rates growth income aalthough as the graph indicates, there ccould be a ne ear term cash
h
flow requirement. HC willl bear financin ng costs but tterms should be agreed be
etween HC annd the LEP to minimise thiss
risk by ensuuring a prioritty call on buusiness rates growth incom me. Further consideration
c n of such arra angements iss
provided in ssection 4.2 beelow and in Ap
ppendix D.
Figure 11 beelow shows thhe aggregate position. Undder the assum mptions made
e in Scenario 1, the Herefo
ord EZ would
d
urplus of £10..6m over the 25 year appraaisal period.
generate a su
£m
PROJECTED RATES INC COME* 21.3
CONTINGEENCY (ON IN NCOME) @ 10% (2.1)
Capital Recceipts 0.7
Net Capitaal Expenditurre (3.8)
Financing costs (4%) (2.0)
GROSS CA AP EX. (INCL. FINANCE CO
OSTS @ 4% A
AND CAP REC
CEIPTS) (5.1)
Hereford En
nterprise Paage
Zone 18
20£m
REVENUE EXP. (3.5)
SURPLUS/DEFICIT (INCL. CONTINGENCY) 10.6
*includes deduction of 3% to allow for bad debt and 2% allowance for rates reliefs
Figure 11: Scenario 1 net income summary
3.2 SCENARIO 2: EZ INTERVENTIONS SCENARIO (WITHOUT RIVER WYE CROSSING)
This scenario assumes that the Council makes further interventions to accelerate the delivery of development within
the EZ but that the River Wye Crossing is not built. Both the levels of intervention and take!up are greater in this
scenario than under the Base Case assumption but given the cap placed on development by the planning framework,
there are certain sites within the EZ which will not be developed unless the River Wye Crossing is constructed. The
total quantum of development is therefore constrained and the intervention measures proposed reflect this (i.e. no
investment is proposed in sites which cannot be developed if the construction of the River Wye Crossing does not take
place).
3.2.1 Take!up assumptions
Due to the current pressures on the road network the Local Development Order effectively sets a cap of 50,000 sq m.
Although this cap would be lifted if the River Wye Crossing was built, the take!up assumptions in this scenario assume
that the construction of this element of the relief road does not take place and therefore no further development
takes place beyond 2018 when this cap is reached.
Based on the assumption that the interventions outlined below are implemented but the construction of the River
Wye Crossing does not take place, a total of 49,438 sq m of development is anticipated which can be broken down as
follows:
Year (Take!up sq m)
2014 1,600
2015 15,947
2016 12,607
2017 12,835
2018 6,450
TOTAL 49,438
Figure 12: Scenario 2 Take!up
As the cumulative take!up of space increases year!on!year, the level of business rates income becomes greater. This is
illustrated by the projected business rates income shown in Figure 16.
It should be noted that discussions are ongoing with the Highways Agency to increase the traffic trip numbers for the
Zone which would equate to moving from a cap of 50,000 sq m to 65,000 sq m of development. Were an agreement
to be reached at this level the rates income position would be significantly improved, however, as it is not certain
whether the Highways Agency will agree to increase this, this study assumes the lesser figure of 50,000 sq m.
3.2.2 Land receipts
Hereford Enterprise Page
Zone 19
21Figure 13 sets out the assumptions that have been made in relation to the anticipated land receipts. These receipts
reflect the timing and scale of development assumed under this scenario and total £781K which is broken down as
follows:
Capital
Year
Receipt (£000)
2013 23
2014 296
2015 350
2016 70
2017 42
TOTAL 781
Figure 13: Scenario 2 land receipts
A more detailed breakdown of these receipts can be found in Appendix C.
3.2.3 Interventions
In addition to the, £3.8m of investment already committed, the Council has identified a further package of
intervention measures to accelerate development of the Enterprise Zone bringing the total investment to £10.1m. The
works proposed under this scenario take into consideration the assumption that the River Wye Crossing will not be
built and consequently the scale of development of the EZ will be restricted and therefore the Council’s opportunity to
intervene to accelerate development is limited.
The works identified under this scenario are as follows:
Cost of
interventions
Year
per annum
(£000)
2012 994
2013 1,317
2014 1,462
2015 1,701
2016 1,970
2017 750
2018 500
2019 200
2020 100
2021 100
2022 100
2023 100
2024 to
300 (100 pa)
2026
Hereford Enterprise Page
Zone 20
22Cost of
interventions
Year
per annum
(£000)
2027 to
550 (50 pa)
2037
10,144
Figure 14: Scenario 2 interventions
It is that assumed that these works are funded over the life of the EZ using annuity loans at an interest rate of 4% such
that all investments are fully paid down by 2038. This is illustrated in Figure 16.
A more detailed breakdown of the proposed investments can be found in Appendix B.
3.2.4 Revenue expenditure
In order for development to occur in!line with the take!up assumptions outlined above, the Council will need to
resource the project appropriately to manage development. This includes an intensification of effort into 2016/17 to
reflect the number of direct developments in place. Figure 15 outlines the assumptions that have been made and
reflects the fact that there will be no further development beyond 2018 in this scenario. Revenue expenditure of
£3.3m for staffing and operational costs has been identified.
Year Annual Revenue
Expenditure (£000)
2012 200
2013 300
2014 400
2015 300
2016 300
2017 200
2018 200
2019 to 2026 800 (100 pa)
2027 to 2037 550 (50 pa)
TOTAL 3,250
Figure 15: Scenario 2 revenue expenditure
The above costs are treated as revenue expenditure in year. This is illustrated in Figure 16.
3.2.5 Financial analysis
Figure 16 below shows the income and expenditure profile of the Enterprise Zone in each year over the life of the EZ
based on the assumption that the interventions outlined in section 3.2.3 take place. Although the level of expenditure
is significantly greater under this scenario than under Scenario 1, the income received increases at a much faster rate
than under the base case assumption. However, it should be noted that the affordability of finance remains an issue in
the early years with a positive net income only being received from 2017 onwards.
Hereford Enterprise Page
Zone 21
23Figure 16: Sceenario 2 incomee and expenditu
ure profile
Figure 17 shoows the aggreegate position
n. Under the aassumptions made
m in Scenario 2, the Herreford EZ wou
uld generate a
surplus of £110.8m over the 25 year apppraisal period.
£m
PROJECTED RATES INC COME* 33.3
CONTINGEENCY (ON IN NCOME) @ 10% (3.3)
Capital Recceipts 0.8
Net Capitaal Expenditurre (10.1)
Financing costs (4%) (5.9)
GROSS CA AP EX. (INCL. FINANCE CO
OSTS @ 4% A
AND CAP REC
CEIPTS) (15.2)
REVENUE EXP. (3.9)
SURPLUS//DEFICIT (INC CL. CONTING
GENCY) 10.8
*includes deducttion of 3% to allow
w for bad debt and
d 2% allowance forr rates reliefs
Figure 17: Sceenario 2 net inco
ome summary
3.3 SCEN
NARIO 3: EZ INTERVENT
TIONS (RIVEER WYE CRO
OSSING COM
MPLETES 20021)
As previously covered in this report, there are ceertain sites within
w the EZ for which deevelopment hinges
h on thee
construction of the Riverr Wye Crossing. Under thhis scenario itt is assumed that this secction of the relief road iss
completed aand that in co
onjunction with this, the CCouncil implements its full package of proposed interventions too
maximise development within the EZ.
On this basiis, the initial future investtments are ffocused at the South Mag gazine, whichh is the area most readilyy
available for developmentt, before proggressing to thee Northern Magazine and then Chapel Rooad as these two
t areas aree
Hereford En
nterprise Paage
Zone 22
24opened up completely by the accelerated infrastructure investment programme proposed by the EZ that will see
£17.3m invested (excluding the proposed investment in the River Wye Crossing) over the life of the EZ. The
importance of this accelerated programme of infrastructure investment cannot be underestimated, on the basis that
by the early opening up of the whole of the EZ, it allows each of the “mini zones” to play to their respective strengths
early in the life of the EZ.
3.3.1 Take!up assumptions
Based on the assumption that the interventions identified below are implemented and the construction of the River
Wye Crossing takes place, a total of 146,925 sq m of development is anticipated which can be broken down as follows:
Year (Take!up sq m)
2014 1,600
2015 15,947
2016 14,273
2017 15,733
2018 16,648
2019 13,600
2020 11.300
2021 11,500
2022 11,850
2023 6,825
2024 4,875
2025 4,875
2026 4,875
2027 4,875
2028 4,875
2029 3275
TOTAL 146,925
Figure 18: Scenario 3 Take!up
Starting off in 2014, with the establishment of the Beck Group in the EZ, take up picks up substantially in 2015 with
eight of the “pipeline” firms taking occupation in the EZ, alongside the establishment and 95% of take up of space at
Skylon Court. The momentum is maintained into 2016, 2017 and 2018 with the establishment of further Herefordshire
Council funded rented speculative space for small businesses at the Innovation Centre, Skylon Court 2, and the Food
Technology Centre, alongside development in the South and then North Magazine.
The Enterprise Zone has received a number of enquiries from small businesses looking to rent rather than buy and the
private sector is not meeting that demand at the moment. Furthermore Herefordshire is home to number of small
scale producers that require next stage space to expand and grow further and cost of this is inhibitory. There is also a
desire to encourage more start up activity through the provision of innovation space and again the nature of the
business audience is that it is not attractive for the private sector to meet those requirements.
Herefordshire Council intend that these developments will target different and non!related occupier sectors and as
such do not expect the three facilities to compete for occupiers. Moreover, these three facilities will target small
enterprises who cannot afford to buy and build their own units, and so Herefordshire Council are of the view that take
Hereford Enterprise Page
Zone 23
25up of space within these facilities will not be at the expense of plot take up at the North and South Magazines which
will be taken by larger firms able to fund their own space.
Take up is expected to gradually tail off from 2018 onwards as the Herefordshire Council speculative space becomes
fully occupied, and the initial pent up demand for space within the Enterprise Zone apparent in the early years of its
life is addressed, such that from 2022 onwards annual take up is closer to the circa 50,000 sq ft take up per annum
DTZ would ordinarily expect it to be in Hereford prior to the awarding of the Enterprise Zone.
As the cumulative take!up of space increases year!on!year, the level of business rates income becomes greater. This is
illustrated by the projected business rates income shown in Figure 22.
3.3.2 Land receipts
Figure 19 sets out the assumptions have been made in relation to the anticipated land receipts. These receipts reflect
the timing and scale of development assumed under this scenario and total £3.5m which is broken down as follows:
Year Capital
Receipt (£000)
2013 23
2014 296
2015 350
2016 70
2017 560
2018 286
2019 682
2020 551
2021 638
TOTAL 3,456
Figure 19: Scenario 3 land receipts
A more detailed breakdown of these receipts can be found in Appendix C.
3.3.3 Interventions
In addition to the, £10.1m of investment already proposed under Scenarios 1 and 2, the Council has identified a
further package of intervention measures to accelerate development of the Enterprise Zone bringing the total
investment requirement to £17.3m. The works assumed under this scenario represent the full package of intervention
measures proposed by Herefordshire Council on the assumption the River Wye Crossing is constructed and the
maximum level of development is permitted. The works identified under this scenario are as follows:
Cost of
interventions
Year
per annum
(£000)
2012 994
2013 1,317
Hereford Enterprise Page
Zone 24
26Cost of
interventions
Year
per annum
(£000)
2014 1,462
2015 3,951
2016 4,720
2017 2,000
2018 1,000
2019 500
2020 to
100
2028
2029 to
50
2037
17,294
Figure 20: Scenario 3 interventions
It is that assumed that these works are funded over the life of the EZ using annuity loans at an interest rate of 4% such
that all investments are fully paid down by 2038. This is illustrated in Figure 22.
A more detailed breakdown of the interventions proposed can be found in Appendix B.
3.3.4 Revenue expenditure
In order for development to occur in!line with the take!up assumptions outlined above, the Council will need to
resource the project appropriately to manage development including an intensive period of infrastructure
investments and direct developments. Figure 21 outlines the assumptions that have been made. Revenue expenditure
of £4.3m for staffing and operational costs has been identified.
Year Annual Revenue
Expenditure (£000)
2012 200
2013 300
2014 400
2015 500
2016 500
2017 500
2018 300
2019 200
2020 200
2021 TO 2028 800 (100 pa)
2022 to 2037 450 (50 pa)
TOTAL 4,350
Figure 21: Scenario 3 revenue expenditure
The above costs are treated as revenue expenditure in year. This is illustrated in Figure 22.
Hereford Enterprise Page
Zone 25
273.3.5 Fin
nancial anallysis
Figure 22 below shows th he income and d expendituree profile of the
e Enterprise Zone
Z in each yyear over the life of the EZZ
based on the assumption n that the Rivver Wye Crosssing is built and the full list of interveentions is made. Based on n
current projeections, affordability of fin
nance will be an issue in thhe early yearss with a posittive net incom
me only beingg
received fromm 2018 onwaards. This is oneo year longger than unde er either Scen
narios 1 or 2 due to the higher level off
investment in the earlier years. Howevver, this earlyy investment leads to a sign nificant increaase in revenues to the LEP P
totalling £33.1m.
Figure 22: Sceenario 3 incomee and expenditu
ure profile
Figure 23 shoows the aggreegate position
n. Under the aassumptions made
m in Scenario 3, the Herreford EZ wou
uld generate a
surplus of £443.9m over the 25 year apppraisal period.
£m
PROJECTED RATES INC
COME* 79.4
CONTINGEENCY (ON IN
NCOME) @ 10% (7.9)
Capital Recceipts 3.5
Hereford En
nterprise Paage
Zone 26
28£m
Net Capitaal Expenditurre (17.3)**
Financing costs (8.6)
GROSS CAAP EX. (INCL. FINANCE COOSTS @ 4% A
AND CAP REC
CEIPTS) (22.4)**
REVENUE EXP. (5.1)
SURPLUS//DEFICIT (INC CL. CONTING
GENCY) 43.9
*includes deducttion of 3% to allow
w for bad debt and
d 2% allowance forr rates reliefs
**Figure does no
ot include contribuution to River Wye
e Crossing
Figure 23: Sceenario 3 net inco
ome summary
This surplus of £43.9m wiill only be ach
hieved if the R
River Wye Cro
ossing is built. This piece off infrastructure is required
d
by 2021, andd a contribution from the Zone may faccilitate other investment and ensure thaat these workks are carried d
out.
In order to d
demonstrate the
t impact tha at making a coontribution to
o the cost of building
b the ccrossing would
d have on thee
net income position, a further scenarrio has been modelled. This scenario is based on the same assumptions ass
Scenario 3 bu n investment/contribution oof £10m towaards the cost of
ut includes an o the Wye Vaalley Crossing in 2019.
Figure 24 below shows th
he income and d expendituree profile of the
e Enterprise Zone
Z in each yyear over the life of the EZZ
based on thee assumption that the River Wye Crossinng is built and the full list of interventionns are carried out includingg
a £10m contribution towaards the cost of
o the crossingg.
Figure 24: Sceenario 3a incom
me and expenditture profile
Hereford En
nterprise Paage
Zone 27
29Figure 25 shows the aggregate position. Under the assumptions made in Scenario 3a, the Hereford EZ would generate
a surplus of £27.4 over the 25 year appraisal period.
£m
PROJECTED RATES INCOME* 79.4
CONTINGENCY (ON INCOME) @ 10% (7.9)
Capital Receipts 3.5
Net Capital Expenditure (27.4)**
Financing costs (4%) (15.0)
GROSS CAP EX. (INCL. FINANCE COSTS @ 4% AND CAP RECEIPTS) (38.9)
REVENUE EXP. (5.1)
SURPLUS/DEFICIT (INCL. CONTINGENCY) 27.4
*includes deduction of 3% to allow for bad debt and 2% allowance for rates reliefs
Figure 25: Scenario 3a net income summary
Although the net income position is £16.5m less than under Scenario 3, the forecast business rates growth under
Scenario 3 will not be received without the construction of the River Wye Crossing. Ideally the Department for
Transport (DfT) would finance the full cost of these works, in which case the full £43.9m can be used to fund other
projects in the region. However, the funding position is not yet clear and the LEP should therefore consider what
positive action can be taken on its part to facilitate other investment and ensure that the Enterprise Zone can be
developed!out to its full potential. If making a contribution to the River Wye Crossing ensures that it is completed on
time then this investment should be considered to provide value for money for the LEP. Based on an investment of
£10m in 2019, the LEP would still receive a total of £16.6m more in business rates growth income over the life of the
EZ than under Scenario 2 where it is assumed that the road is not built and development is capped at 50,000 sq m.
Hereford Enterprise Page
Zone 28
304 Findings & conclusions
4.1 Performance of the Enterprise Zone
The performance of the EZ differs significantly between each of the scenarios both in terms of the wider economic
benefits achievable and also the net income generated from business rates income for the LEP.
Figure 26 below summarises the potential economic benefits to be realised under each option. The benefits
achievable under Scenario 3 are significantly greater than those achievable under Scenarios 1 and 2, highlighting the
importance of the development of the River Wye Crossing in order to maximise the success of the Enterprise Zone.
Scenario 1 Scenario 2 Scenario 3
New workspace created (sq m) 32,525 49,438 146,925
Jobs created 1,211 1,858 5,887
Gross Development Value (£m) 20.3 30.0 86.4
Figure 26: Economic benefits
This point is further emphasised by the financial analysis undertaken which shows the potential for rates additionality
for the LEP to be significant. Based on the above projections, the net revenues from the accelerated development
under Scenario 3 would equate to £43.9m in total over the life of the EZ. This compares to Scenario 1 which is
forecast to generate £10.6m and Scenario 2 which is forecast to generate £10.8m.
Scenario Scenario Scenario
1 (£m) 2 (£m) 3 (£m)
PROJECTED RATES INCOME* 21.3 33.3 79.4
CONTINGENCY (ON INCOME) @ 10% (2.1) (3.3) (7.9)
Capital Receipts 0.7 0.8 3.5
Net Capital Expenditure (3.8) (10.1) (17.3)**
Financing costs (4%) (2.0) (5.9) (8.6)
GROSS CAP EX. (INCL. FINANCE COSTS @ 4% AND CAP RECEIPTS) (5.1) (15.2) (22.4)**
REVENUE EXP. (3.5) (3.9) (5.1)
SURPLUS/DEFICIT (INCL. CONTINGENCY) 10.6 10.8 43.9
*includes deduction of 3% to allow for bad debt and 2% allowance for rates reliefs
**Figure does not include contribution to River Wye Crossing
Figure 27: Hereford EZ net income summary
There remains significant risk that the later phases which are reliant on the development of the River Wye Crossing
will be delayed or in fact, not happen at all which would have significant ramifications for LEP’s expected rates
revenues as illustrated by Figure 27.
Figure 28 below further highlights the differences in take!up for each scenario and serves to illustrate the risk position
and significant reliance on the completion of the River Wye Crossing.
Hereford Enterprise Page
Zone 29
31Figure 28: Herreford EZ take!u
up summary
Figure 28 illu
ustrates the im
mportance of the constructtion of the Rivver Wye Crosssing and the immpact this will have on thee
take!up of sppace within thhe EZ. The cap
p currently plaaced on development of 50 0,000 sq m willl significantlyy restrict take!!
up and thereefore rates revvenues for the
e LEP resultingg in an estimaated loss of income from buusiness rates of o £33.1m. Ass
this income will not be reeceived witho out the const ruction of the e River Wye Crossing,
C the LEP should consider
c whatt
positive actio
on can be takken on its parrt to ensure thhat the Enterrprise Zone ca an be developped!out to its full potentiall
and the exteent to which the anticipated growth in bbusiness ratess income can be b used to prrovide fundingg towards thee
River Wye Crrossing.
4.2 APPR
ROACH TO FUNDING
F
The above aanalysis has been
b prepared pproved interventions are all financial using annuityy
d on the basiis that the ap
loans over thhe remainder of the life of the
t EZ such thhat all debts are
a fully paid down
d by the ttime these expire i.e. 2038,,
an interest raate of 4% has been used.
Adopting this approach, we
w can see the e forecast ratees growth income exceeds the cost of fuunding the intterventions in
n
each year so
o that there is a faster revvenue surpluss which can either
e be accu
umulated or used by the LEP for otherr
purposes.
The surplus rrevenue can be
b used to add
dress further iinterventions desired and not
n yet approvved.
An alternativve approach could
c be to in
nsist that sur plus revenues are all direccted towards the priority repayment
r off
borrowings ffor the interveentions approved. If this appproach were adopted then n all revenues from rates in
ncome growth
h
available to tthe LEP would
d be committeed until 2026. This is shownn in Figure 29 below.
Hereford En
nterprise Paage
Zone 30
32You can also read


