European Motor Insurance Markets - February 2019 - Insurance Europe
←
→
Page content transcription
If your browser does not render page correctly, please read the page content below
European Motor Insurance Markets
                       February 2019
Insurance Europe is the European insurance and reinsurance federation. Through its 34 member bodies — the
national insurance associations — Insurance Europe represents all types of insurance and reinsurance undertakings,
eg pan-European companies, monoliners, mutuals and SMEs. Insurance Europe, which is based in Brussels,
represents undertakings that account for around 95% of total European premium income. Insurance makes a
major contribution to Europe’s economic growth and development. European insurers generate premium income
of more than €1 200bn, directly employ over 950 000 people and invest over €10 100bn in the economy.
www.insuranceeurope.euContents
Methodological note, ratios and abbreviations 4
Glossary 5
Member associations and country codes 6
1. Executive summary 7
2. Main European motor insurance trends 9
2.1 Total motor 9
2.2 Compulsory motor third-party liability (MTPL) 12
2.3 Optional damage cover 15
2.4 National motor insurance markets 16
3. Uninsured driving and innovation 21
3.1 Uninsured driving 21
3.2 Motor insurance-related innovation 22
4. Opportunities and challenges for the EU motor insurance sector 25
Reporting countries 27
Notes 29
European Motor Insurance Markets 3Methodological note
Data sources All data on motor insurance comes from Insurance Europe member associations. Data on GDP,
purchasing power parity-adjustments to GDP, population and exchange rates are taken from Eurostat.
Currency Insurance Europe collects data from its member associations in their national currency. For non-euro
area countries, it is then converted into euro. All absolute figures are converted with the current end-
of-year exchange rates. All growth rates and ratios are calculated using constant (2016) end-of-year
exchange rates.
Representativeness 27 of Insurance Europe’s members participated in this survey. They account for 98% of the total gross
written premiums of Insurance Europe’s membership.
Samples Not all data, and in particular historical data, is available for all markets. See the “Reporting countries”
section on p27 for the sample for each indicator.
Rounding Figures are rounded up to the nearest thousand and are in millions of euros, unless otherwise stated.
Premiums Premiums are gross written premiums (direct business) on home territory underwritten by domestic
enterprises and third-country branches
Solvency II In 2016, a number of countries started reporting data based on the definitions in the EU’s new
Solvency II regulatory regime. This means that the 2016 figures in this report are not directly comparable
with those of earlier years. For more detail, see the Notes on p29.
Ratios
Average premium (per insured) Gross earned premiums divided by the number of policies1
Cost of claims Gross claims expenditure divided by the number of claims notified, excluding nil claims2
Frequency of claims Number of claims notified divided by the number of insured vehicle years3
Combined ratio Sum of the loss ratio and the expense ratio
Expense ratio Gross operating expenses as a percentage of gross direct premiums written
Loss or claims ratio Gross claims expenditure as a percentage of total gross earned premiums
Abbreviations
EEA European Economic Area
EU European Union
GDP gross domestic product
na not available
p.p. percentage point
ppp purchasing power parity
1 If not available, number of insureds or number of insured vehicle years
2 If not available, number of claims including nil claims
3 If not available, number of insureds or number of policies
4 Insurance EuropeGlossary4
Bodily injury Physical harm to one’s person
Claims expenditure Gross claims and claims management expenses paid during the accounting year (ie
gross payments related both to that year’s claims and unpaid claims from previous
years), together with the movement in the gross provisions for outstanding claims, net
of salvage and subrogation recoveries.
Comprehensive cover A motor insurance policy that includes both MTPL and damage cover4
Damage cover Optional motor insurance cover that can be purchased in addition to compulsory MTPL
cover. Such a policy covers the insured for a range of first-party damages, eg own
damage to the vehicle (ie damage caused directly by the insured driver), damage to
glass parts, damage caused by vandalism, fire or natural forces, and theft.
Domestic market Domestic market includes all domestic companies operating in the country of review,
including subsidiaries of EU/EEA and non-EU/EEA country companies and branches of
companies from third (non-EU/EEA) countries. It excludes branches of companies from
EU/EEA countries and those operating under EU freedom of services (FOS) provisions.
Gross direct premiums written Gross premiums written by the insurer during the year under review. Accepted
reinsurance is not included.
Gross earned premiums Gross written premiums minus the change in gross provisions for unearned premiums.
The provision for unearned premiums comprises the share of gross premiums written
that is to be allocated to subsequent financial years.
Insured vehicle year A measure of exposure equivalent to one vehicle insured for one year, two vehicles
insured for six months each, etc.
MTPL Motor third-party liability, which refers to a person’s legal liability for the bodily injury
and/or property damage sustained by another as the result of a motor vehicle-related
accident. The EU Motor Insurance Directive mandates that all motor vehicles are
covered by insurance for third-party liability.
Net risk premium The amount of premium required to cover claims expected for a risk. The net risk
premium therefore does not include operating expenses, the cost of capital and
reinsurance, taxes and parafiscal charges. It is calculated as the average claims cost
multiplied by the average claims frequency.
Number of claims The number of claims notified (excluding nil claims)
Nil claim A claim that results in no payment by the insurer
“Premium” or “premium income” Gross direct premiums written
P&C Property and casualty insurance business lines (ie non-life excluding health)
Total market Total market includes all the elements of the domestic market, as well as branches of
companies from EU/EEA countries and those operating under EU freedom of services
(FOS) provisions.
Total motor MTPL and damage cover
4 In Germany, comprehensive cover also includes “motor accident” cover, which provides compensation for an insured’s own bodily injury or death in the event of a motor vehicle accident,
regardless of fault
European Motor Insurance Markets 5Member associations and country codes
Austria (AT) — Verband der Versicherungsunternehmen Österreichs (VVO)
Belgium (BE) — Assuralia
Bulgaria (BG) — Association of Bulgarian Insurers (ABZ)
Croatia (HR) — Hrvatski ured za osiguranje (HUO)
Cyprus (CY) — Insurance Association of Cyprus
Czech Republic (CZ) — Česká asociace pojišťoven (ČAP)
Denmark (DK) — Forsikring & Pension (F&P)
Estonia (EE) — Eesti Kindlustusseltside Liit
Finland (FI) — Finanssiala ry
France (FR) — Fédération Française de l’Assurance (FFA)
Germany (DE) — Gesamtverband der Deutschen Versicherungswirtschaft (GDV)
Greece (GR) — Hellenic Association of Insurance Companies
Hungary (HU) — Magyar Biztosítók Szövetsége (MABISZ)
Iceland (IS) — Samtök Fjármálafyrirtækja (SFF)
Ireland (IE) — Insurance Ireland
Italy (IT) — Associazione Nazionale fra le Imprese Assicuratrici (ANIA)
Latvia (LV) — Latvijas Apdrošinātāju Asociācija (LAA)
Liechtenstein (LI) — Liechtensteinischer Versicherungsverband
Luxembourg (LU) — Association des Compagnies d’Assurances et de Réassurances du Grand-Duché de Luxembourg (ACA)
Malta (MT) — Malta Insurance Association (MIA)
Netherlands (NL) — Verbond van Verzekeraars
Norway (NO) — Finans Norge
Poland (PL) — Polska Izba Ubezpieczeń (PIU)
Portugal (PT) — Associação Portuguesa de Seguradores (APS)
Romania (RO) — Uniunea Naţională a Societăţilor de Asigurare şi Reasigurare din Romania (UNSAR)
Slovakia (SK) — Slovenská asociácia poist’ovní (SLASPO)
Slovenia (SI) — Slovensko Zavarovalno Združenje (SZZ)
Spain (ES) — Unión Española de Entidades Aseguradoras y Reaseguradoras (UNESPA)
Sweden (SE) — Svensk Försäkring
Switzerland (CH) — Schweizerischer Versicherungsverband (ASA/SVV)
Turkey (TR) — Türkiye Sigorta, Reasürans ve Emeklilik Şirketleri Birliği
United Kingdom (UK) — The British Insurers’ European Committee:
Association of British Insurers (ABI)
International Underwriting Association of London (IUA)
Lloyd’s
6 Insurance Europe1. Executive summary
This report presents the trends and developments in Europe’s national motor insurance markets, using figures from Insurance
Europe’s members. It is a follow-up to the European Motor Insurance Markets Report (November 2015) and the European
Motor Insurance Markets Addendum (June 2016), with updated figures.
Motor insurance remains the largest property and casualty (P&C) insurance business line in Europe, accounting for 38%
of total P&C premiums in 2016. The diversity of the national motor insurance markets in Europe reflects differences in EU
member states’ regulatory, risk and economic environment.
Europe’s motor Economic recovery in Europe in recent years, measured in terms of GDP growth, has
insurance sector been broadly mirrored in the motor insurance markets. Motor insurance premiums
continues to grew 2.4% in 2015 and 4.0% in 2016 to total €135.3bn. Claims expenditure by motor
expand steadily insurers increased 0.6% in 2015 and 4.5% in 2016 to total €103.5bn.
There are differences between EU member states: for compulsory motor third-party
Disparities exist
liability (MTPL) insurance, average premiums in 2016 ranged from €34 in Latvia to €348
between EU member
in Italy. The average cost of MTPL claims ranged from €1 123 in Malta to €5 856 in
states
France.
While there were national differences, the cost of MTPL claims increased 3.1% between
Cost of claims rises 2014 and 2016 and 6.8% in the decade to 2016. The cost of damage claims rose
2.7% from 2014 to 2016 and 15.1% in the decade to 2016.
The opposite trend was seen in the frequency of claims. Between 2014 and 2016, the
Frequency of frequency of MTPL claims fell 0.1 of a percentage point. Between 2007 and 2016 it
claims falls decreased 1.0 percentage point. The frequency of damage claims was down 0.2 of a
percentage point and 1.3 percentage points over the same periods.
Vehicle connectivity The automotive industry is going through unprecedented changes as a result of
and automation significant and ongoing technological advances, including the increased connectivity
advances and automation of cars.
European Motor Insurance Markets 7A number of important questions are raised by the data generated by connected
Vehicles generate vehicles, notably whether drivers have control over if and with which third parties they
more data, questions share their data. For insurers, having access to the data generated by vehicles could
remain over access to help them: deal with claims faster and more efficiently; correctly apportion liability
data following an accident/incident; better understand and price the risks they underwrite;
and provide new and innovative services to their policyholders.
Road safety Technological advances improve road safety, leading to fewer accidents and affecting
improves the frequency of claims.
Section 2 of this report presents a summary of the main European motor insurance trends: the evolution of premiums, claims
and profitability, together with the split between mandatory MTPL and optional damage cover, with country-specific figures
where possible.
Section 3 examines the actions taken by European countries to reduce the risk of uninsured driving and motor insurance-
related innovations enabled by digitalisation.
Section 4 provides an overview of the opportunities and challenges created for motor insurers in Europe by increasingly
connected and automated vehicles.
2017 overview
This report covers historical data up to and Chart 1: Total motor premium growth by country — 2017
including 2016, outlining the main trends
and most recent regulatory and market
developments.
Total 2017 premium figures broadly
confirm the trend observed between 2014
and 2016 of growth in most countries. RO
FI
8 Insurance Europe2. Main European motor insurance trends
2.1 Total motor
Over the past decade, the motor insurance share of property and casualty (P&C) business in Europe has been steadily
decreasing. Nonetheless, motor remained the largest P&C business line at 38% in 2016, followed by property insurance
(27%) and general liability insurance (11%).
Market size
Europe’s national motor insurance markets are generally very Chart 2: Motor premiums as proportion of P&C
competitive, but tend to be subject to cycles of expansion and premiums — 2007–2016
contraction. 42%
41.1%
41%
In 2016, the number of motor insurance companies in 40.3%
40.0% 39.9%
40%
domestic markets shrank 6.1% compared to 2014 and 2.8% 39.7%
39.3%39.3%
compared to 2015. 39% 39.5% 38.9%
38%
In a number of markets, such as Malta and the Netherlands, 37.9%
37%
the last few years were characterised by intense competition
and waning profitability, forcing some companies to transform 36%
2007 2008 2009 2010 2011 2012 2013 2014 2015 2016
their operations or to stop operating in those markets.5
Malta has seen a fall in the number of insurers In the Netherlands, three motor insurance companies
and a hardening of premium rates in the last three that used to operate as local entities now operate
years. Three insurers stopped operating: Allcare as branches of foreign entities, shifting an estimated
was bought by Mapfre Middlesea, while branches €650m out of the domestic total between 2014 and
of Qatar Insurance and SOVAG both closed. As a 2016.
result, there has been some lack of capacity to insure
certain types of risks, such as international haulage
trucks, vehicles requiring hire and reward insurance,
vehicles owned or driven by non-EU residents and
private drivers with a negative claims record.
Chart 3: Number of motor insurers per country — Chart 4: Number of motor policies — 20165 (m)
2015–2016 m
120 14%
8
7
24
23
100
100 12%
90
80
10%
70 80
60 8%
50 60
40
6%
30 40
4%
20
10 20 2%
0
0 0%
DE FR IT UK PL ES TR SE AT NL CZ PT FI HU NO HR BG DK SI
Number of policies Growth rate
2015 2016 Number of policies Growth rate
5 DE = number of risks insured
European Motor Insurance Markets 9The number of vehicles on the road depends largely on the economic environment and the demographics in each state.
Boosted by European economic recovery, the number of insured vehicles increased 3.4% between 2014 and 2016.
The total number of MTPL and damage policies increased 4.8% between 2014 and 2016 and 3.0% between 2015 and
2016. Most countries experienced growth in the total number of MTPL and damage policies.
Premiums
Total motor premium income amounted to €135.3bn in 2016, up 4.0% on the year before and showing stronger growth
than the 2.4% increase in 2015.
The five largest European motor markets — Germany, France, the UK, Italy and Spain — accounted for almost 68% of the
total in 2016, down 1.6 percentage points on 2015. In 2016, motor premiums increased in the UK (+3.6%), Spain (+3.0%),
Germany (+2.7%) and France (+1.6%). In Italy, motor premiums continued the downward trend that began back in 2011,
with 3.1% fewer motor insurance premiums collected in 2016 than the year before.
Over the past decade, motor premiums in Europe grew 8.1%, largely due to an 18.1% increase in optional motor damage
insurance. Premiums for mandatory MTPL cover decreased 0.8% over the same period.
Chart 5: Total motor premiums — 2007–2016 (€bn) Chart 6: Growth in total motor, MTPL and damage
€bn premiums — 2008–2016
140 6%
5%
4% 4%
120
3%
2%
100 2%
0%
1%
80
-2% 0%
-1%
60 -4%
2007 2008 2009 2010 2011 2012 2013 2014 2015 2016
-2%
Premiums
Premiums Growth
Growthrate
rate
-3%
2008 2009 2010 2011 2012 2013 2014 2015 2016
Total MTPL Damage
Total MTPL Damage
Claims
After four consecutive years of decline (2011–2014), total motor claims expenditure rose slightly (0.6%) in 2015, followed by
a further 4.5% increase in 2016, to total €103.5bn. The number of claims rose 2.3% in 2015 and 1.9% in 20166.
Chart 7: Total motor claims expenditure — Chart 8: Total motor claims and claims expenditure —
2007–2016 (€bn) 2007–2016
m €bn
€bn 8% 40 105
100
6%
39
90 4% 100
38
2%
80
0% 37 95
70
-2% 36
60 90
-4%
35
50 -6%
2007 2008 2009 2010 2011 2012 2013 2014 2015 2016
34 85
Claims expenditure Growth rate 2007 2008 2009 2010 2011 2012 2013 2014 2015 2016
Claims expenditure Growth rate Number of claims
Number of claims Claims expenditure
Claims expenditure
6 For the number of claims notified, the sample of reporting countries is different from that in Insurance Europe’s previous motor insurance publications, so the figures are not directly
comparable
10 Insurance EuropeCombined ratio
After a peak of 108.1% in 2009, motor insurers’ combined ratio fell every year until 2015, when it reached a low of 96.9%,
before rising to 98.6% in 2016. The slight increase in 2016 is largely due to increases in the combined ratio in France
(+3.9 p.p.), Italy (+3.3 p.p.) and the UK (+4.9 p.p.). In a number of other countries, the combined ratio continued to decrease
in 2016. These included Turkey (-15.4 p.p.), Poland (-4.9 p.p.), Finland (-4.8 p.p.), the Netherlands (-2.5 p.p.) and Belgium
(-1.7 p.p.).
Chart 9: Total motor combined ratio — 2007–2016 Chart 10: Total motor underwriting results —
2007–2016 (€bn)
110% €bn
108.1% 4 110%
108% 107.5%
2.0 2.2
106% 2 1.5
1.1 1.0 106%
103.6%
104% 0.1
0
102% -0.3 102%
100.4%
100% -2
99.9% 97.9% 98.6%
98% -2.7 98%
98.5% -4
96% 97.1% 96.9%
-5.2 94%
94% -6 -5.5
92%
-8 90%
90% 2007 2008 2009 2010 2011 2012 2013 2014 2015 2016
2007 2008 2009 2010 2011 2012 2013 2014 2015 2016 Underwriting results
Underwriting results Average combined
Average combined ratio ratio
The longer term trend of improved combined ratios reflects improved underwriting profitability which, after four years of
negative results between 2009 and 2012, returned to a positive €1.1bn in 2013 and stood at €1bn in 2016.
Cycles in P&C insurance
P&C insurance is typically characterised by cycles of upward and then downward movements in premiums and
combined ratios. A cycle comprises a hard market of intense competition and a soft market in which reserves can be
accumulated.
Motor insurance is cyclical in nature too. The financial crisis of 2007–2008 left its mark on the European motor
sector: the highest combined ratio (108.1%) and the worst underwriting results (-€5.5bn) were recorded in 2009.
Most European countries registered their highest combined ratio in the 2008–2010 period, notably Germany (107%),
France (109%), Italy (119.5%) and the UK (115.6%). After the 2008–2010 peak, combined ratios and underwriting
results started to improve but then began to rise again in 2016.
In France, the motor insurance industry remained unprofitable in 2016: the combined ratio showed signs of recovery after a
peak of 109% in 2009, but was still 106% in 2016. The main
Chart 11: Total motor combined ratio by country —
driver of the high combined ratios was increasingly costly
2015–2016
claims squeezing insurers’ profit margins.
110%
100%
In Malta, profitability has been under pressure in recent years,
but owing to an improving claims ratio (excluding expenses 90%
and investment income) of 64.5% in 2016, down from 80%
67.4% in 2015, underwriting results started to improve in 70%
2016. This positive trend was expected to continue in 2017. 60%
50%
In Portugal, 2016 saw a significant fall in the motor
underwriting result to -€43m, down from -€1m in 2015. 2015 2016
European Motor Insurance Markets 11Although low investment returns in a difficult financial environment were the main cause, the 2.2 p.p. growth in the loss
ratio (to 77.5% in 2016) also contributed to the deterioration in underwriting results.
MTPL premiums accounted for 56.3% of total motor premiums in 2016, 0.2 percentage points up on 2015. This is the first
increase seen in the MTPL share after nine years of gradual decline.
2.2 Compulsory motor third-party liability (MTPL)
Premiums
MTPL premiums increased for the second year in a row: up 1.0% Chart 12: MTPL premiums — 2007–2016 (€bn)
in 2015 and 4.0% in 2016 to reach €61.1bn. Strong growth in €bn
2016 was recorded in Turkey (+76.3%), Poland (+42.9%) and 65 6%
Hungary (+34.2%), whereas several other markets experienced 4%
a decline, notably Latvia (-15.8%), Greece (-9.6%), Italy (-4.9%), 55
2%
Finland (-2.2%) and Norway (-1.6%). Large and mature markets
such as Germany, Spain, France and the Netherlands registered 0%
45
2.9%, 2.7%, 1.2% and 0.5% growth respectively. -2%
35 -4%
Average MTPL premiums rose by a modest 1.1% in 2016 to 2007 2008 2009 2010 2011 2012 2013 2014 2015 2016
€205 as a result of a 4.0% increase in premiums and a 2.9% Premiums
Premiums Growth
Growth raterate
increase in the number of policies.
Chart 13: Growth in MTPL premiums by country — Chart 14: Average MTPL premiums — 2007–2016 (€)
2015–2016 €
%
%
76 0%
%
250 10%
.2
.9
.3
.
34
42
45
20%
15% 200 6%
10%
150 2%
5%
100 -2%
0%
50 -6%
-5%
-10% 0 -10%
2007 2008 2009 2010 2011 2012 2013 2014 2015 2016
Average premiums Growth rate
-15%
Average premiums Growth rate
-20%
2015 2016
Claims Chart 15: MTPL claims expenditure — 2007–2016 (€bn)
MTPL claims expenditure has been on the rise over the past €bn
55 6%
three years and in 2016 it increased by 5.0% to €51.4bn.
50 4%
45
The number of MTPL claims grew from 2014 to 2016 after 2%
40
three years of decline. In 2016, growth was 3.7%, which 0%
35
brought the total number of claims to 12.7m, still well below
-2%
the 2010 peak of 13.9m. 30
25 -4%
The average cost of an MTPL claim rose 1.5% in 2016 to 20 -6%
2007 2008 2009 2010 2011 2012 2013 2014 2015 2016
€3 468 and has been on the rise since a low of €3 023 in 2010.
Claims expenditure Growth rate
12 Insurance EuropeThe frequency of MTPL claims has declined from a peak of 6.2% in 2010 and was broadly stable between 2013 and 2016,
at just over 5%.
Chart 16: MTPL claims and claims expenditure — Chart 17: Number of MTPL claims — 2007–2016 (m)
2007–2016 m
m €bn
14 4%
16 55
15
53
13 0%
14
51
13
49 12 -4%
12
47
11
11 -8%
10 45 2007 2008 2009 2010 2011 2012 2013 2014 2015 2016
2007 2008 2009 2010 2011 2012 2013 2014 2015 2016
Number of claims Growth rate
Number of claims Growth rate
Number of claims Claims expenditure
Chart 18: Cost of MTPL claims — 2007–2016 (€) Chart 19: Frequency of MTPL claims — 2007–2016
€
3 500 10% 6.2%
6.2% 6.1%
3 300 6.1%
6.1%
5.8%
5% 5.8%
3 100
2 900
0% 5.4% 5.4%
2 700 5.1% 5.1%
5.2% 5.2%
5.0%
2 500 -5% 2007 2008 2009 2010 2011 2012 2013 2014 2015 2016
2007 2008 2009 2010 2011 2012 2013 2014 2015 2016
Average cost of claims Growth rate
Average cost of claims Growth rate
Bodily injury claims
In 2016, MTPL claims involving bodily injury represented Chart 20: Number of bodily injury claims as a share of
12% of the total number of MTPL claims and had grown total MTPL claims — 2014–2016
6.2% year on year to 1.2m. 25%
20%
The share of bodily injury claims in all MTPL claims varied
widely between countries: from 2.1% in Malta to 19.1%
15%
in Sweden.
10%
The frequency of claims involving bodily injury (number
of personal injury claims per insured) increased 0.02 5%
percentage points in 2016, after a 0.05 p.p. increase the
year before, to reach 0.6%. This is still significantly below 0%
the 0.8% registered in 2010. 2014 2014
2015 2015
2016 2016
In France, to take one example, bodily injury claims accounted for only around 10% of the total number of MTPL claims, but
69% of the cost of MTPL claims in 2016. French insurers received 4.2% more bodily injury claims and paid out 8.6% more
in 2016 than in 2015. The cost of personal liability insurance covering bodily injuries has also risen by an average of 5% each
year over the past three years.
European Motor Insurance Markets 13Chart 21: Number of bodily injury claims — Chart 22: Frequency of bodily injury claims —
2007–2016 2007–2016
0.9%
m
10%
Millions
1.5
0.79% 0.80%
0.8%
5%
1.3
0.78% 0.78%
1.1 0% 0.7% 0.69%
0.9
-5% 0.60%
0.6% 0.58%
0.7
-10% 0.57% 0.53%
0.5
0.5% 0.53%
-15%
0.3
0.1 -20% 0.4%
2007 2008 2009 2010 2011 2012 2013 2014 2015 2016 2007 2008 2009 2010 2011 2012 2013 2014 2015 2016
Number ofofclaims
Number claims Growth
Growth rate rate
Combined ratio
The MTPL combined ratio increased 0.3 of a percentage point Chart 23: MTPL combined ratio — 2007–2016
in 2016 to 100.9%, compared with 100.6% in 2015 and 110%
98.5% in 2014.
105% 104.4% 104.4%
102.2%
In the Czech Republic, MTPL business has been unprofitable
100.6% 100.9%
99.7%
since 2011, with the highest combined ratio of 110% reached 100% 100.0% 98.6% 98.5%
in 2015. A slight improvement was recorded in 2016 (106%)
95% 96.0%
mainly due to a reduction in technical reserves as a result of
the new classification in the EU’s Solvency II regulation. The
90%
combined ratio in new business was even higher (112% for 2007 2008 2009 2010 2011 2012 2013 2014 2015 2016
passenger vehicles, 130% for trucks and lorries).
In Italy, a decline in MTPL premiums, combined with Chart 24: MTPL combined ratio by country —
stable claims costs, resulted in a worsened combined ratio 2014–2016
of 97.5% in 2016 (up from 93.6% in 2015). A positive 130%
contribution from investment returns, albeit down slightly
year-on-year, and the particularly positive liquidation of 110%
excess claims reserves for previous years both helped
to produce a positive overall technical balance in 2016, 90%
though lower than in 2015.
70%
The MTPL technical results in Poland have been negative
for the past 10 years. This is due to a variety of factors, 50%
including strong competition and substantial growth
2014 2015 2016
in bodily injury payments due to major legal changes,
including Supreme Court resolutions.
14 Insurance EuropeNet risk premium
The MTPL net risk premium is the minimum premium required to cover the claims expected from a risk. Between 2007 and
2016, the net risk premium first gradually decreased then slowly rebounded in 2014, reaching €178 in 2016.
Chart 25: MTPL net risk premium — 2007–2016 (€) Chart 26: MTPL net risk premium by country —
€ 2015–2016 (€)
€
200 5%
250
160
3% 200
120
150
0%
80
100
-3%
40
50
0 -5%
2007 2008 2009 2010 2011 2012 2013 2014 2015 2016
Net risk premium Growth rate 0
Net risk premium Growth rate
2015 2016
2.3 Optional damage cover
Optional damage premiums grew for the seventh consecutive
year, rising 3.3% in 2016 to €47.3bn. The increases in the two Chart 27: Damage premiums — 2007–2016 (€bn)
previous years were 1.5% in 2014 and 3.0% in 2015. The €bn
45 6%
growing popularity of this product translated into an increase
40
in the number of policies both in 2015 (+2.3%) and in 2016
35 4%
(+3.7%) to reach 74.5m.
30
25 2%
Claims expenditure also grew — by 2.1% in 2015 and then 20
2.9% in 2016. In line with this, the number of claims grew 2% 15 0%
in 2015 and 1.8% in 2016 to reach 19.2m. 10
5 -2%
2007 2008 2009 2010 2011 2012 2013 2014 2015 2016
In Croatia, total damage claims paid have declined over the
Premiums Growth rate
past seven years and fell 0.5% in 2016 to HRK 568m (€75m). At
the same time, premium income rose, causing the ratio of claims paid to gross written premiums to fall from 91% in 2014 to
71% in 2016 and increasing the profitability of the damage insurance sector.
In 2016, France registered an increase in damage claims, especially those due to floods.
Chart 28: Damage claims expenditure — Chart 29: Damage combined ratio — 2007–2016
2007–2016 (€bn)
102%
€bn
30 99.5%
98.8%
8%
25 98%
96.6%
95.8%
20 4%
94.8%
94%
15
0%
92.0%
10 89.4% 89.4%
90%
-4% 90.0%
5 88.8%
-8% 86%
2007 2008 2009 2010 2011 2012 2013 2014 2015 2016 2007 2008 2009 2010 2011 2012 2013 2014 2015 2016
Claims expenditure Growth rate
Claims expenditure Growth rate
European Motor Insurance Markets 152.4 National motor insurance markets
Average premium
A wide range of regulatory, risk and economic factors determine insurers’ calculations of premiums. Premiums are set in
proportion to expected risks and need to cover not just expected claims but also operational and administrative costs and
other obligations. All these factors differ widely from one country to another, which explains the varying levels of average
premium across Europe.
Chart 30: Average motor premium by country — Chart 31: Average motor premium (PPP-adjusted)
2015–2016 (€) by country — 2015–2016 (€)
€
€
700 600
600
500
500
400
400
300 300
200 200
100
100
0
0
2015 2016
2015 2016
The average motor premium in 2016 ranged from €66 in Latvia to €622 in the UK.
In France, the average motor premium (before tax for category one vehicles, ie excluding two-wheelers and car fleets) was
relatively stable at around €400 per annum from 2011 to 2016.
And in Norway, over the last three years the average motor premium has decreased 3.6% due to intense competition and
low loss ratios.
The average MTPL premium in 2016 stood at €205 and ranged from €34 in Latvia to €348 in Italy. The average was €2
(1.1%) higher than in 2015. Between 2007 and 2016, the average MTPL premium decreased by an average of 1.2% a year.
In Croatia, market liberalisation in 2013 triggered a drop in the average MTPL premium and by the end of 2016 the cumulative
decline since 2013 was 39%.
Chart 32: Average MTPL premium by country — Chart 33: Average MTPL premium (PPP-adjusted)
2015–2016 (€) by country — 2015–2016 (€)
€ €
300 400
300
200
200
100
100
0
0
2015 2016 2015 2016
16 Insurance EuropeIn the Czech Republic, the average MTPL premium remained stable throughout the period 2012–2016 at between €105 and
€110.
In Italy, the average MTPL premium fell by over 20% between 2012 and 2016, bringing the average premium down to its
1998 level as a result of the economic environment, intense competition, reduced compensation for minor bodily injury
claims and the increasing use of connected devices (see box in Section 3.2).
In Slovenia, the average MTPL premium fell steadily from €217 in 2007 to €130 in 2016 due to both economic uncertainty
and intense price competition among insurers, resulting in promotions and bonuses.
Chart 34: Average damage premium by country — Chart 35: Average damage premium (PPP-adjusted)
2015–2016 (€) by country — 2015–2016 (€)
€ €
350 700
300 600
250 500
200 400
150 300
100 200
100
50
0
0
2015 2016 2015 2016
Frequency of claims
The frequency of claims is an important measure Chart 36: Frequency of MTPL claims by country — 2015–2016
of the risk exposure of a policy and hence directly 8%
affects how insurers price the policy. Road and traffic- 7%
related factors stemming from demographics, terrain 6%
5%
and driving habits can affect the frequency of claims.
4%
Moreover, the national regulatory environment, such 3%
as liability rules, litigation rules, compulsory MTPL 2%
insurance obligations, as well as perceptions and 1%
attitudes to rules and obligations, can also strongly 0%
influence the frequency of claims.
2015 2016
Chart 37: Frequency of damage claims in Chart 38: Frequency of bodily injury claims by country —
selected countries — 2015–2016 2015–2016
1.4%
35% 1.2%
30%
1.0%
25%
0.8%
20%
0.6%
15%
0.4%
10%
0.2%
5%
0% 0.0%
2015 2016 2015 2016
European Motor Insurance Markets 17As these factors vary between countries, the frequency of MTPL claims varies across Europe, from 2.4% in Finland to 7.3%
in Portugal and 7.5% in Turkey in 2016. Vast differences are also observed in the frequency of MTPL claims involving bodily
injury: ranging from 0.13% in the Czech Republic through 0.98% in Italy to 1.28% in Turkey.
The frequency of damage claims in 2016 ranged from 11.0% in Germany through 20.8% in Slovenia to 30.4% in Turkey.
Cost of claims
The cost of claims is another important measure of risk exposure. The socio-economic environment of a state plays a role in
the cost of claims, as it can affect the cost of vehicle repair (including the costs of labour and materials), medical expenses
and the value of vehicles at risk of theft.
Similarly to the differences in the frequency of claims, national differences in the cost of claims are also significant. In 2016,
the cost of an MTPL claim in Europe ranged from €1 123 in Malta to €5 856 in France, with an average of €3 468, while the
cost of a damage claim ranged from €528 in Malta to €1 620 in Germany, with an average of €1 340.
Chart 39: Cost of MTPL claims by country — Chart 40: Cost of MTPL claims (PPP-adjusted) by
2015–2016 (€) country — 2015–2016 (€)
€ €
6 000 6 000
5 000 5 000
4 000 4 000
3 000 3 000
2 000 2 000
1 000 1 000
0 0
2015 2016 2015 2016
Chart 41: Cost of damage claims by country — Chart 42: Cost of damage claims (PPP-adjusted) by
2015–2016 (€)
€
country — 2015–2016 (€)
€ €
1 700
2 000
1 500
1 600
1 300
1 200
1 100
800
900
700 400
500 0
2015 2016 2015 2016
Material costs
The price of motor spare parts constitutes a significant component of overall material damage claims costs and, ultimately,
of motor premiums. The development of increasingly connected and automated vehicles has made replacing parts more
expensive. This trend of the rising cost of spare parts driving up the cost of claims is observed in most national markets.
18 Insurance EuropeIn France, the higher cost of materials has led to a steady rise in the cost of claims. The average cost of repairs, representing
65% of expenses and 98% of claims, has been rising increasingly fast since 2011 and grew 3.1% in 2016 .
In Norway, until 2016 the loss ratio was quite low, but it increased slightly in 2016, especially for damage, due to increasing
repair costs. The 2016 spare parts price survey7 shows generic average part prices rose 1.1% from 2015 to 2016.
In the UK, the cost of vehicle repairs is also rising, with average generic part prices increasing 8.3% in 20167. This trend
is driven by the rising cost of imported vehicle parts and an increasing use of advanced driver assistance systems (ADAS),
whose parts are costly to replace.
The 2016 spare parts price survey shows average generic part prices also went up in Austria (+3.5%), Belgium (+2.6%),
Finland (+4.3%), Germany (+3.2%) and Spain (+1.8%).
The cost of MTPL claims involving bodily injury, which is usually much higher than other MTPL claims, also varied between
countries. In 2016, the average PPP-adjusted cost of bodily injury claims ranged from €8 840 in Turkey to €20 913 in
Greece.
Compensation for bodily injury claims Chart 43: Cost of bodily injury claims (PPP-
In the Czech Republic, a new Civil Code was introduced in 2014 adjusted) in selected countries — 2015–20168 (€)
€
that brought fundamental changes to the compensation of bodily 20 000
injury claims, driving costs up. As a result, the average PPP-adjusted
cost of bodily injury claims rose from €8 637 in 2014 to €14 620 15 000
in 2016.8 10 000
In Germany, a new law in July 2017 introduced the right to claim 5 000
compensation for psychological suffering for surviving dependents
in the event of a death (new paragraph 3, Section 844, German
2015 2016
Civil Code (BGB)). The amount of the claim is left to the discretion
of the court. Court rulings on these “shock” damages are intended to provide guidance on the amount of the claim.
In Latvia, a new law came into force in 2014 that substantially raises the level of compensation for non-material losses,
mostly focusing on bodily injury compensation. Specifically, the amount the insurance company should now pay a victim
who suffers tissue damage with functional disorders as a result of a car accident was raised to an equivalent of three times
the minimum monthly wage; a 14-fold increase. A person who is classified in the first disability group (80-100% loss of
capacity to work) now receives compensation equivalent to 10 times the minimum monthly wage, ie 15 times more than
before. The compensation to the dependent or spouse in the event of the death of the policyholder was increased 76-fold.
In the event of the policyholder, dependent or spouse’s first group disability, the compensation was increased 51-fold, to
an equivalent of 20 times the minimum monthly wage.
In Malta, the minimum limits of indemnity were increased to reflect the requirements of the Motor Insurance Directive
(Chapter 104 of the Laws of Malta). The new limits of €1.22m for total and permanent disability and €6.07m for third-
party insurance per accident came into force in June 2017.
In Poland, the Financial Supervision Authority (KNF) issued Guidelines on motor vehicle insurance claims settlement
in 2015. A year later, it adopted Recommendations on the process of determining and paying compensation for non-
pecuniary damage from MTPL contracts. These regulations changed the claims-handling process and altered best practices
in the market. They also standardised the rules for paying indemnities under MTPL.
7 Spare parts price survey as at 1 January 2016, Centro Zaragoza, Instituto de Investigación sobre Vehículos
8 GR 2015 data unavailable
European Motor Insurance Markets 19In Spain, a revision of the legal system for assessing bodily injury compensations, Baremo, came into force on 1 January 2016. Its impact is seen in the evolution of the outstanding claims provision: in 2016, the surge in these costs eroded MTPL business profitability. In the UK, the reduction in 2017 of the Ogden Discount Rate used in assessing lump sum awards from 2.5% to -0.75% made personal injury claims significantly more expensive and thus caused average motor insurance premiums to rise further. 20 Insurance Europe
3. Uninsured driving and innovation
Two of the issues that are occupying insurers in all motor markets in Europe are uninsured driving and technological
innovation.

3.1 Uninsured driving

Uninsured driving affects accident victims, insurers and policyholders. The victims of accidents caused by uninsured vehicles
can struggle to obtain compensation as the owners of these vehicles are frequently unable to pay. Victims are therefore
more likely to be compensated by the national guarantee funds to which insurers contribute. Insurers are also already
missing out on the premiums from uninsured drivers. The costs created by uninsured drivers are therefore transferred to
regular policyholders in the form of higher premiums.

While the obligation to have MTPL insurance is one of the core principles of the EU’s Motor Insurance Directive, uninsured
driving continues to be a pressing — and in some cases — growing problem throughout Europe, and several European
countries have taken action to reduce it.

In the Czech Republic, approximately 1% of all MTPL claims are currently caused by uninsured vehicles. That said, the
number of uninsured vehicles reduced between 2009 and 2015 from a high of approximately 1.7% after the first
introduction of contributions to a guarantee fund by fining owners of vehicles caught uninsured. The contribution scheme
was reintroduced again in 2018 in an effort to further reduce uninsured driving.

In France, a legislative measure to tackle uninsured driving was adopted in 2016 and was effective from 1 January 2019.
Police are authorised to detect uninsured vehicles with automated tools and to access a database compiled by insurers to
check the status of vehicles’ insurance contracts.

In Germany, the estimated number of uninsured vehicles on the road is significantly less than 1% of all vehicles as a result
of the compulsory MTPL required to register a vehicle. Vehicle registration is withdrawn if the MTPL insurance expires.
Furthermore, drivers of uninsured vehicles face penalties ranging from hefty fines to jail sentences.

In Italy, it is estimated that 2.8 million vehicles — 6.3% of the total — were not covered by insurance in 2017, down from
an estimated 2.9 million in 2016 and 3.4 million in 2015. This decline may be due to the replacement of motor vehicle
insurance windshield stickers by an instant computer check of vehicle registration plates to ascertain MTPL insurance cover.
Of the 6.3% uninsured vehicles nationally in 2017 there are significant geographical differences, with rates much higher
(10%) in southern Italy, almost in line with the national average in central Italy and much lower (4.1%) in the north.

In Norway, owners of uninsured vehicles have been charged a daily omission fee of NOK 150 (€15) by the Norwegian
Motor Insurers’ Bureau since 1 March 2018. The omission fees directly contribute to the national MTPL Guarantee Fund,
which compensates victims of accidents involving uninsured driving. The new system has contributed to a decrease in the
percentage of uninsured vehicles from 3.4% (July 2017) to 1.2% (July 2018).

In Poland, around 0.5% of all vehicles are estimated to be uninsured. Although the number of vehicles in Poland continues
to increase, the number of uninsured vehicles has not. The successful containment of uninsured driving is the result of
heavy fines; for a passenger car, for example, the fine can be up to €1 000. Accidents or collisions caused by uninsured
vehicles have to be compensated by the owners of those vehicles. Moreover, according to recent analyses by the Insurance
Guarantee Fund, in most cases lack of MTPL insurance cover is not intentional but an oversight or a lack of knowledge
of regulations: MTPL insurance is renewed automatically at the end of each year if a policyholder pays premiums for the
entire year, but if the vehicle is sold, the MTPL policy will not be automatically extended.

                                                                                         European Motor Insurance Markets 21
Slovenia is among the member states in which an MTPL insurance policy is a condition of the registration of a vehicle and, consequently, the share of uninsured vehicles is low. The estimated number of uninsured vehicles in 2016 was 3 992, 0.27% of the 1.5 million registered vehicles. The national guarantee fund run by the Slovenian Insurance Association recorded 210 claims in 2016 caused by uninsured vehicles with Slovenian registration plates. 3.2 Motor insurance-related innovation Technological developments, innovations such as telematics — the combination of computers and telecommunication technologies to transfer information — and digitalisation have brought rapid changes and challenges for the insurance sector. Black boxes In-vehicle telematics, or black boxes, have been installed in vehicles in increasing numbers over recent years. Many European insurers have begun to offer drivers policies that are linked to black boxes, though at varying speeds in different markets. In Germany, insurers offer telematic tariffs using different recording systems: black boxes, smartphones, OBD2-devices9 and other connected devices. In Hungary, one insurance company started a telematics project in 2016 in which 428 cars were installed with a free telematics device used with a mobile application. Vehicle data can be freely checked by the driver and can be accessed by the insurer. The company may introduce a special policy involving telematics, depending on the results of the project. Two other insurance companies have damage policies linked to telematic devices. A premium discount of 10-20% can be offered to customers who choose these products. In France, only one insurance company has started to offer products linked to in-vehicle telematics, with a premium discount of up to 50%. These products quickly attracted young drivers, who usually pay high premiums. Compared to standard policyholders, customers who opt for this technology receive, on average, a 20% discount and register a 20% reduction in claim frequency and cost10. In Italy, demand for more economical motor policies has led to a rise in policies including black boxes, which sometimes offer very substantial premium discounts. The steady increase in the number of installed devices has enabled insurers to reduce fraud and to have a more accurate valuation of damage (see box on p23). In Latvia, black boxes have been installed for some corporate clients (vehicle fleets), but not yet for individual clients. In Malta, two insurers have introduced telematics-based policies targeted at drivers aged under 30 and offering more affordable premiums. Their aim is to encourage people to drive more carefully knowing they are being monitored. In Norway, two companies started using black boxes for motor insurance pricing in 2017. However, these companies only represent a very small part of the total motor insurance market. Other companies have announced their interest in introducing similar policies. In the UK, an increasing use of telematics has been observed in recent years, especially by younger drivers who otherwise pay comparatively high premiums. 9 OBD2 is the second generation of on-board diagnostics 10 Source: “Voiture autonome: une réglementation à reconnecter”, L’Argus de l’Assurance, February 2018 22 Insurance Europe
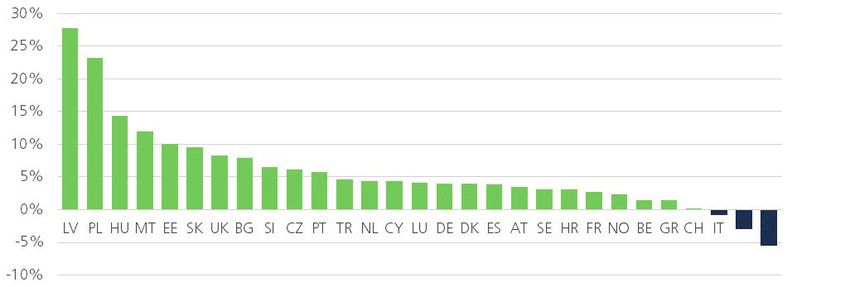
Black boxes in Italy

   Connected cars bring many opportunities for innovative product development, reduced premiums and increased
   coverage. In Italy, the impacts of telematics (black boxes) being fitted in cars are already being seen, as both pay-
   how-you-drive and mileage-based products have been offered to customers since 2011. More and more tailormade
   products are being offered based on driving styles, as well as awarding more favourable tariffs to lower-risk drivers.

   Telematics can truly change a market. For many years, young drivers in Italy and drivers in the south of Italy paid higher
   premiums than other drivers. Young drivers are attracted to the in-vehicle telematics solution due to the discounts
   offered on their premiums. This is shown by the fact that the percentage of vehicles installed with telematics is higher
   for younger drivers. In addition, geography plays a role. Suburban drivers — those that theoretically need to do more
   driving — have taken up telematic policies more than urban drivers.

   With the most sophisticated black boxes on the market, premiums are determined on the basis of the actual use
   of the car, be it distance driven, driving style or obedience to the rules of the road. More precise risk measurement
   benefits honest, prudent drivers.

    Chart 44: Number of vehicles with black boxes —                 Chart 45: Share of vehicles with black boxes as %
    2012–2017 (m)                                                   of all insured vehicles — 2012–2017

    2012           1.2                                               2012         4.7%

    2013                 2                                           2013                7.9%

    2014                                4                            2014                          13.1%

    2015                                       4.8                   2015                             14.7%

    2016                                             5.4             2016                                  17.3%

    2017                                                   6.3       2017                                          19.8%

Digitalisation
Digitalisation allows insurers to provide innovative services that improve their offerings to customers. In some countries,
digital tools have been developed to allow policyholders to report accidents and file claims electronically.

Since 1972, there has been an agreement in place in Belgium whereby the victim of a traffic accident is compensated by the
driver’s own MTPL insurer instead of by the insurer of the liable party. The advantage of this procedure is that the insured
person is assisted more quickly and effectively. An electronic platform has been set up through which all communication
between the insureds and the insurers can take place. That platform also has the advantage of providing an overview of all
the messages exchanged and the time of claims notification. Financial settlements by insurers following a claim can also be
made using the platform.

Furthermore, in January 2017, an application called Crashform was launched, which makes it possible to report traffic
accidents to the insurer electronically. Currently, this report can only be made via a single smartphone or tablet, but it will
soon become possible to do it from two devices.

In the Netherlands a free mobile application, the “MobielSchadeMelden” app, was launched in 2016. Developed by the
police, together with the Dutch Association of Insurers, the app allows users to report motor accidents electronically via a
smartphone.

                                                                                                European Motor Insurance Markets 23
For the last few years, the Slovenian Insurance Association (SIA) and its members have focused on improving the data quality of their different IT solutions and databases, ie the motor insurance database (RAZ) and fraud detection system (AdmiralMIA), and the exchange of e-police reports including photos and sketches. The SIA and its members are regularly involved in and support road safety activities, together with the Slovenian Traffic Safety Agency. In Turkey, the Insurance Information and Monitoring Centre has developed new mobile technologies. With its Mobile Accident Report application (KTT), users can now access information such as the claim amount, vehicle details, parts replaced, policy, accident and injured party without having to contact an agent. With this application, it is possible to view accident locations on an online, interactive map. Drivers can now easily find out where and when most accidents take place. Furthermore, with KTT, users can prepare their accident reports on their smartphones. Users can also compare the minimum, maximum and average premiums for liability insurance policies issued by insurance companies in the previous 30 days. 24 Insurance Europe
4. Opportunities and challenges for the EU
motor insurance sector
The figures presented in previous chapters underline the relative stability of the EU motor insurance industry. Growth in
premiums is broadly steady, generally mirroring economic growth. In the future, motor insurance business is likely to be
increasingly influenced by trends in the automotive industry, such as greater automation, which is likely to have a profound
impact on road safety, and greater connectivity, which will impact transport in general.

For the insurance sector, beyond the impact on premiums that these trends may have, there are important questions around
liability and access to the vehicle-generated data.

Autonomous vehicles and the question of liability
Self-driving or autonomous cars are usually the first thing that comes to mind when considering the future of the automotive
industry. Both automotive and technology giants have been testing their autonomous vehicle capabilities extensively in recent
years. Greater automation of vehicles is expected to reduce — if not remove entirely — the human element of driving, which
is likely to mean fewer road accidents overall. However, these accidents could be more expensive, as the vehicles and their
parts will be more complex and costly.

Roads will increasingly be populated with autonomous vehicles, but there will be a transition period during which these
vehicles will have to share the road with manually operated cars. This transition period will raise first and foremost the
question of whether victims of road accidents involving autonomous vehicles will be compensated, and so, more generally,
whether these vehicles can be insured. There is also the question of whether this can be organised inside the existing
legislative framework.

In this discussion, it is important to keep in mind that even with fully automated vehicles, accidents will still occur and it will
remain vital to have a system that permits the smooth compensation of victims. Insurance Europe believes that the current
EU Motor Insurance Directive framework is the right tool to achieve this goal, and that it will continue to play a vital role
in ensuring the appropriate protection of victims of car accidents, whether or not they are caused by automated vehicles.
This was also the conclusion reached by the High Level Group GEAR 203011 in its report on automotive competitiveness and
sustainability for the European Commission.

However, for smooth compensation to happen, it will be vital that insurers and other parties with a legitimate interest have
access to the in-vehicle data that establishes the facts of an accident, so that liability can be correctly apportioned. Another
reason for insurers to be given access to vehicle-generated data is that this would enable them to better understand the new
risks related to these types of vehicles and therefore provide their customers with better products.

Can the driver control access to the data from connected vehicles?
When a vehicle generates data that can be traced back to its owner or driver, that data should be treated as personal data
according to the EU’s General Data Protection Regulation. It is therefore absolutely fundamental that the owner or driver is in
control of who accesses this data and for what purpose.

At the same time, the data generated by vehicles and drivers, in combination with other fast-moving technological advances,
provides not only the opportunity for an improved customer experience, but also ways to make road transport safer, cleaner
and more efficient.

11 GEAR 2030 was established by the European Commission in October 2015, made up of authorities from EU countries and representatives of, inter alia, consumers, service providers and
the automotive industry. Its report can be found at https://ec.europa.eu/growth/content/high-level-group-gear-2030-report-on-automotive-competitiveness-and-sustainability_en.

                                                                                                                                 European Motor Insurance Markets 25
With the increase in the data produced while driving, insurers can offer usage-based products such as pay as you drive (PAYD) and pay how you drive (PHYD), which are more tailored to driver behaviours. As complements to these products, insurers have begun to offer services such as driver coaching. Such innovation can benefit all road-users by improving safety. Continued innovation in products and services can only occur if insurers and other third parties are given access, with consumers’ consent, to the wealth of vehicle data available. Currently, some vehicle manufacturers are developing systems that effectively make them the sole gatekeepers of vehicle data, rather than the driver. These systems deprive consumers of the benefits of increased competition in the market for data-based services related to their vehicle — not just insurance but also repairs, maintenance and the many location-based services enabled by increased connectivity (traffic management information, directing drivers to the nearest garage or hotel, etc.). Allowing vehicle manufacturers to be the sole gatekeeper of vehicle data will reduce the choice of service providers available to consumers, as well as the quality of the services on offer. Indeed, the model developed by some vehicle manufacturers means that service providers might only have access to a small fraction of the data that connected vehicles produce. What is ultimately at stake when discussing the type of technology used to access vehicle-generated data is consumer choice. To truly be in control, drivers must be able to choose freely from a variety of providers, rather than being bound by agreements pre-negotiated by vehicle manufacturers with third parties. 26 Insurance Europe
Reporting countries
Indicator                              Reporting countries

1. Executive summary
Total motor premiums (3-year sample)   AT, BE, BG, CH, CY, CZ, DE, DK, EE, ES, FI, FR, GR, HR, HU, IE, IT, LU, LV, MT, NL,
                                       NO, PL, PT, RO, SE, SI, SK, TR, UK
Total motor claims expenditure         AT, BE, BG, CH, CY, CZ, DE, DK, EE, ES, FI, FR, GR, HR, HU, IE, IT, LU, LV, MT, NL,
(3-year sample)                        NO, PL, PT, RO, SE, SI, SK, TR, UK
Average MTPL premiums                  BE, CZ, DE, DK, ES, FI, FR, HR, HU, IT, LV, MT, NL, NO, PL, PT, SE, SI, TR
Average cost of MTPL claims            BE, CZ, DE, DK, FI, FR, GR, HR, HU, IT, NO, PL, PT, SE, TR
Average frequency of MTPL claims       BE, CZ, DE, DK, FI, FR, GR, HR, HU, IT, MT, NO, PL, PT, SE, SI, TR
Average cost of damage claims          CZ, DE, DK, FI, FR, GR, HR, HU, IT, MT, PL, PT, SE, TR
Average frequency of damage claims     DE, HR, HU, PL, SI, TR

2. Main European motor insurance trends
2.1 Total motor
Premiums                               AT, BE, BG, CH, CY, CZ, DE, DK, EE, ES, FI, FR, GR, HR, HU, IE, IT, LU, LV, MT, NL,
                                       NO, PL, PT, RO, SE, SI, SK, TR, UK
Claims expenditure (3-year sample)     AT, BE, BG, CH, CY, CZ, DE, DK, EE, ES, FI, FR, GR, HR, HU, IE, IT, LU, LV, MT, NL,
                                       NO, PL, PT, RO, SE, SI, SK, TR, UK
Claims expenditure (10-year sample)    AT, BE, BG, CH, CY, CZ, DE, DK, EE, ES, FI, FR, GR, HR, HU, IE, IT, LU, LV, MT, NL,
                                       NO, PL, PT, RO, SE, SI, SK, TR, UK
Number of claims                       CY, CZ, DE, DK, FI, FR, GR, HR, HU, IE, IT, MT, NO, PL, PT, SE, SI, TR, UK
Average motor combined ratio           BE, CY, CZ, DE, ES, FI, FR, HR, IE, IT, NL, PL, PT, SE, SI, TR, UK
(3-year sample)
Average motor combined ratio           BE, CY, DE, FI, FR, HR, IT, NL, PL, PT, TR, UK
(10-year sample)
Underwriting results                   BE, CY, FI, FR, HR, IT, NL, PL, PT, TR, UK
Year-on-year growth in total motor,    Total: AT, BE, BG, CH, CY, CZ, DE, DK, EE, ES, FI, FR, GR, HR, HU, IE, IT, LU, LV,
MTPL, damage premiums                  MT, NL, NO, PL, PT, RO, SE, SI, SK, TR, UK
                                       MTPL: AT, BG, CY, CZ, DE, DK, ES, FI, FR, HR, HU, IT, LV, MT, NL, NO, PL, PT, SE,
                                       SI, TR, UK
                                       Damage: BE, CH, CZ, DE, DK, ES, FI, FR, GR, HR, HU, IT, LV, MT, NL, NO, PL, PT,
                                       SE, SI, SK, TR

2.2 Compulsory motor third-party liability (MTPL)
Premiums                               BE, CH, CZ, DE, DK, ES, FI, FR, GR, HR, HU, IT, LV, MT, NL, NO, PL, PT, SE, SI, SK,
                                       TR
Number of policies (3-year sample)     AT, BG, CY, CZ, DE, DK, ES, FI, FR, HR, HU, IT, LV, MT, NL, NO, PL, PT, SE, SI, TR, UK
Number of policies (10-year sample)    AT, BG, CZ, DE, DK, ES, FI, FR, HR, HU, IT, LV, MT, NO, PL, PT, SE, SI, TR, UK
Claims expenditure                     BE, CH, CZ, DE, DK, ES, FI, FR, GR, HR, HU, IT, NL, NO, PL, PT, SE, SK, TR
Combined ratio                         BE, CZ, DE, ES, FI, FR, HR, HU, IT, NL, PL, PT, SE, TR
Net risk premiums (3-year sample)      BE, CZ, DE, DK, FI, FR, GR, HR, HU, IT, MT, NO, PL, PT, SE, TR
Net risk premiums (10-year sample)     BE, CZ, DE, FI, FR, GR, HR, HU, IT, NO, PL, PT, SE, TR
Number of claims (3-year sample)       BE, CZ, DE, DK, FI, FR, GR, HR, HU, IT, MT, NO, PL, PT, SE, SI, TR
Number of claims (10-year sample)      BE, CZ, DE, FI, FR, GR, HR, HU, IT, MT, NO, PL, PT, SE, SI, TR

                                                                                        European Motor Insurance Markets 27
You can also read