A fully integrated machine learning scan of selection in the chimpanzee genome
←
→
Page content transcription
If your browser does not render page correctly, please read the page content below
Published online 3 September 2020                                                   NAR Genomics and Bioinformatics, 2020, Vol. 2, No. 3 1
                                                                                                              doi: 10.1093/nargab/lqaa061

A fully integrated machine learning scan of selection
in the chimpanzee genome
Jessica Nye1 , Mayukh Mondal1 , Jaume Bertranpetit1,* and Hafid Laayouni                                                           1,2,*

1
 Institut de Biologia Evolutiva (UPF-CSIC), Universitat Pompeu Fabra, Doctor Aiguader 88, 08003 Barcelona,
Catalonia, Spain and 2 Bioinformatics Studies , ESCI-UPF, Pg. Pujades 1, 08003 Barcelona, Spain

Received November 03, 2019; Revised June 11, 2020; Editorial Decision July 18, 2020; Accepted July 31, 2020

                                                                                                                                                                  Downloaded from https://academic.oup.com/nargab/article/2/3/lqaa061/5901065 by guest on 17 October 2020
ABSTRACT                                                                          though the four subspecies are genetically and geographi-
                                                                                  cally distinct, it is clear that there has been an extensive gene
After diverging, each chimpanzee subspecies has                                   flow among chimpanzee subspecies and introgression with
been the target of unique selective pressures. Here,                              bonobo (4).
we employ a machine learning approach to clas-                                       The demographic history of a species is an important
sify regions as under positive selection or neutral-                              key in understanding their evolution. The size of a popu-
ity genome-wide. The regions determined to be un-                                 lation’s breeding pool can indicate how many positive selec-
der selection reflect the unique demographic and                                  tive events are likely to have taken place (5) and how strong
adaptive history of each subspecies. The results                                  the effects of genetic drift may in fact be (6). Furthermore,
indicate that effective population size is important                              introgression between species and gene flow from a close
for determining the proportion of the genome un-                                  subspecies may be a source for beneficial genetic material, as
der positive selection. The chimpanzee subspecies                                 reviewed by Arnold and Martin (7).
                                                                                     Beyond demography, unique selective events are likely
share signals of selection in genes associated with
                                                                                  to have impacted the genomes of chimpanzee based on
immunity and gene regulation. With these results,                                 their habitats. The four subspecies live in two distinct
we have created a selection map for each popu-                                    regions of Africa. Pan troglodytes verus (western chim-
lation that can be displayed in a genome browser                                  panzee) lives in Ivory Coast and Guinea, while the other
(www.hsb.upf.edu/chimp browser). This study is the                                three subspecies live in central Africa. Specifically, P.t. el-
first to use a detailed demographic history and ma-                               lioti (Nigeria–Cameroon) lives in its namesake countries,
chine learning to map selection genome-wide in                                    P.t. schweinfurthii (eastern) inhabits seven countries but
chimpanzee. The chimpanzee selection map will im-                                 primarily in the Democratic Republic of Congo and P.t.
prove our understanding of the impact of selection                                troglodytes (central) inhabits five countries but primarily
on closely related subspecies and will empower fu-                                Gabon. The selective pressures that these populations face
ture studies of chimpanzee.                                                       are likely due to their unique habitats. In different re-
                                                                                  gions, these populations will experience exposure to diver-
                                                                                  gent pathogens, differing quantity and quality of resources,
INTRODUCTION                                                                      and, most importantly, for a social animal, separate cul-
                                                                                  tures. All these factors together are likely to be responsi-
Although chimpanzees are the closest genetic relative to hu-                      ble for some of the genetic differences we observe between
mans, sharing much of our genetic information, we still un-                       chimpanzees.
derstand little about their evolutionary history. In recent                          Here, we present the first comprehensive scan of the chim-
years, a more comprehensive picture of their demographic                          panzee genome that integrates varied selective simulations
history has been elucidated (1–3). Chimpanzees and bono-                          that encompass complete and ongoing selection occurring
bos diverged around a million years ago. The two major                            between present time and some 60 kya. These simulations
branches of the chimpanzee lineage began to split from each                       are interrogated by 15 statistical tests, and with a random
other some 500 thousand years ago (kya). Today, we iden-                          forest machine learning approach we map positive selection
tify four subspecies of chimpanzee, and understand that Pan                       to better understand the unique evolutionary history of our
troglodytes verus and P.t. ellioti are more closely related and                   genetic cousins, unveiling their adaptive history through the
diverged from each other first (∼250 kya), followed by P.t.                       unique or shared signals of positive selection.
troglodytes and P.t. schweinfurthii (diverging
2 NAR Genomics and Bioinformatics, 2020, Vol. 2, No. 3

                                                                            been estimated from the full genome sequences included in
                                                                            this study. This results in the fact that the used demogra-
                                                                            phy is the most accurate depiction of the complex relation-
                                                                            ships between analyzed subspecies as estimated from the an-
                                                                            alyzed samples.

                                                                            Simulations
                                                                            We used the coalescent simulator msms (11). For the neu-
                                                                            tral simulations, we simulated 2000 replicates of 600 000 bp
                                                                            sections. We matched the sample sizes of each subspecies re-
                                                                            sulting in sample sizes of n = 18 for P.t. troglodytes, n = 19
                                                                            for P.t. schweinfurthii, n = 10 for P.t. ellioti and n = 12 for P.t.

                                                                                                                                                   Downloaded from https://academic.oup.com/nargab/article/2/3/lqaa061/5901065 by guest on 17 October 2020
                                                                            verus. Each subspecies was modeled independently because
                                                                            each subspecies is an independent lineage where selection
                                                                            and divergence have been impacting each group uniquely
                                                                            for >5000 generations.
                                                                               For the selective scenarios, we used the demographic
Figure 1. Demographic model indicating population divergence times, ef-     model introduced above. We chose to simulate selection at
fective population sizes and migration within the Pan clade. Migration      the following generation time points: 600, 900, 1200, 1500,
(black arrows) indicates bidirectional migrational pulses over time. Pop-   1800, 2100 and 2400 (generation time is 25 years), in order
ulation size is indicated in the upper right-hand corner.                   to take advantage of the predicted power of positive selec-
                                                                            tion statistics, discussed below. To do this, we used the tag
MATERIALS AND METHODS                                                       -e. We allowed for hard selection (where selection begins on
                                                                            a singleton in the populations) using the tag -SAA.
Genome sequences                                                               We allowed for the selection coefficient to vary between
Full genome sequences of chimpanzee and bonobo were                         0.05 and 0.55. These coefficients were chosen to combat the
obtained from the Great Ape Genome Project (3,4) as vcf                     power of drift. As genetic drift is a more powerful evolu-
files aligned to chimpanzee genome release Pantro4. The                     tionary force than selection in small populations, the short
sample sizes are 18 P.t. troglodytes, 19 P.t. schweinfurthii,               timescale of the most recent selection events required the
10 P.t. ellioti, 12 P.t. verus and 10 P. paniscus. The ances-               use of high coefficients. We independently selected 1000 sim-
tral states for each single-nucleotide variant (SNV) were ex-               ulations where the final allele frequency (FAF) was fixed
tracted from the 1000 Genomes data (8) using the human–                     (complete sweep) and 1000 simulations where the FAF was
gorilla–chimpanzee alignment from Ensemble release 54.                      between 0.6 and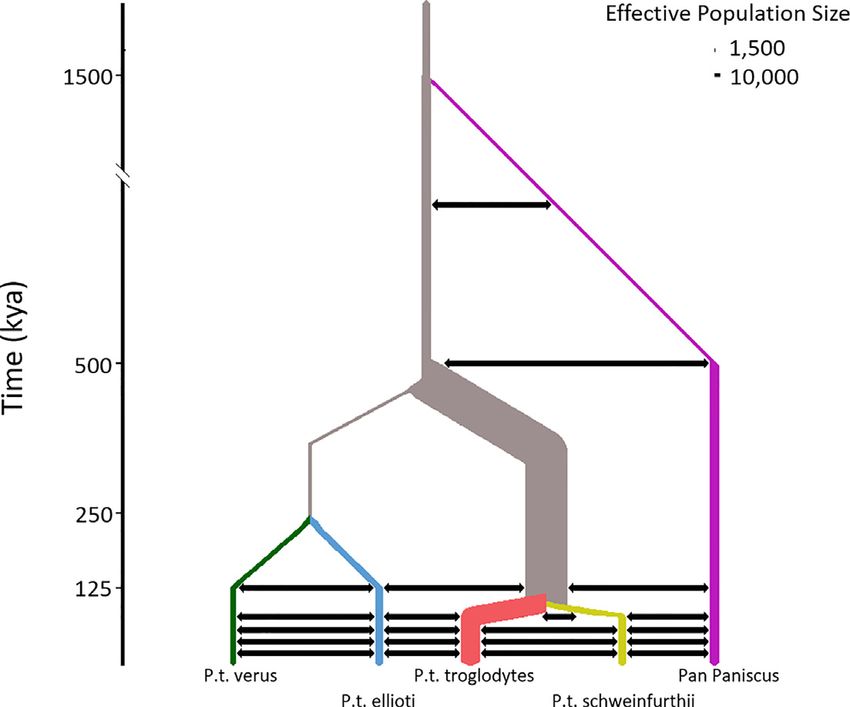
NAR Genomics and Bioinformatics, 2020, Vol. 2, No. 3 3

Table 1. Tests calculated in the chimpanzee genomes and used to train     calculated statistics for both the neutral simulations and the
the random forest algorithm in order to calculate a composite score of    selective simulations. We modeled extensive selection sce-
selection                                                                 narios occurring between present time and 60 kya, when
Principle                                           Method                the test statistics are robust (8–9,11–21). We grew forests
                                                                          of 5000 random trees; all other parameters were set to de-
Site frequency spectrum                         Tajima’s D (12)
                                              Fu and Li’s D (13)
                                                                          fault. The measures of accuracy for random forest algo-
                                              Fu and Li’s F (13)          rithms are out-of-bag (OOB) error rates. These values are
                                                    R2 (14)               calculated by randomly selecting a subset of the statistics for
Linkage disequilibrium                             iHS (15)               random simulated regions to train and test the accuracy of
                                               EHHAverage (16)            the model based on the non-sampled instances. OOB error
                                                 Wall’s B (17)
                                                 Wall’s Q (18)            rates are similar to the more common cross-validation pro-
                                                  Fu’s F (19)             cedures, as they are both bootstrapping methods. An OOB
                                                                          rate indicates the probability that the instance belongs to

                                                                                                                                             Downloaded from https://academic.oup.com/nargab/article/2/3/lqaa061/5901065 by guest on 17 October 2020
                                                    Za (20)
                                                   ZnS (21)               any class. The random forest was modeled independently
                                                    ZZ (20)
Population differentiation                        DAF (22)
                                                                          for each subspecies.
                                                 XP-EHH (23                  According to our OOB error estimates, ∼500 trees are ad-
Descriptive statistics                    π (nucleotide diversity) (24)   equate (Supplementary Figures S45–S48). The output of a
                                                                          random forest is the majority voting score. Each randomly
                                                                          generated tree categorizes the input region; that is, an out-
statistic are presented in Supplementary Figures S2–S22,                  put score of 0.60 selection and 0.40 neutral indicates that
and for simulated neutral and selective scenarios in Supple-              60% of the 5000 trees categorized the input region as un-
mentary Figures S23–S43.                                                  der selection while 40% of the trees categorized the input
                                                                          region as neutral. In order to be as conservative as possi-
                                                                          ble, we accepted only signals of putative positive selection
Random forest algorithm
                                                                          where at least 95% of trees categorized the region as under
We employed a machine learning approach in order to dif-                  selection. This cutoff is not the same as other cutoffs like
ferentiate between regions of the genome, split into 30 kb                a false discovery rate (FDR) in which the study accepts an
windows with a 3 kb sliding window, that are neutral and                  error rate of 5%. In the case of random forests, each tree
regions that have evidence of a selective sweep. Random                   is trained with a unique combination of the underlying pa-
forest uses decision trees as a base classifier. This learning            rameters, which means that not all trees have been trained
method is used for classification and regression of data. We              with the correct scenarios to detect selection in every place
chose a random forest method because it is an improvement                 in the genome; in other words, this 95% cutoff allows for
on previous machine learning approaches such as decision                  ‘badly’ designed trees to be ignored. Error rates are calcu-
trees (which run the risk of overparameterization when us-                lated separately using OOB (Supplementary Table S6). Our
ing correlated input statistics) (26,27) or bagging (i.e. boot-           final model is a function of the 15 selection tests that give,
strap aggregating, which runs the risk of basing the regres-              for each window, a value that tells what portion of the trees
sion model on too many similar trees) (28). Our input data                in the forest predicts that positive selection has acted in that
consist of many correlated statistics (Figure 2), all of which            given window.
have benefits and disadvantages. The random forest algo-
rithm is an extension of bagging, in that it constructs an
                                                                          Negative selection
entire forest with trees of random structure at each node
by randomly selecting training instances for each tree (i.e.              To remove false positives due to background selection, we
each tree is trained with a different set of simulations and a            perform the McDonald–Kreitman (MK) test (37) using the
unique random subset of the calculated statistics). This en-              program PopGenome version 2.7.1 (38) in R version 3.5.2
sures that the ultimate regression model is based on a suffi-             (36). We split the genome into gene regions using Ensembl
cient mixture of the underlying data that avoids both over-               release 90 annotations. The outgroup was set as bonobo and
parameterization and bias being built into the underlying                 all sample sizes were matched (N = 10).
model (29). New statistical advances are using new methods
to extract information from complex dataset; for example,
                                                                          Gene ontology
approximate Bayesian computation is used to infer past de-
mographic events from genome-wide sequencing data (30)                    Gene ontology (GO) analysis was performed using PAN-
and deep learning methods are applied to identify the best                THER classification system version 14.1 (39) with Ensem-
demographical models (31) or to jointly infer natural selec-              ble 95 annotations. In all cases, gene lists were uploaded and
tion and demography (32). The random forest model has                     analyzed using the P. troglodytes organism annotations and
been observed to be particularly apt for use in computa-                  statistical overrepresentation test using a Fischer’s exact test
tionally difficult problems like selection in genomes (32,33)             and correction by FDR.
or models where single predictors have little power (34).
For more information, see Section 1.3 in the Supplemen-
                                                                          Genes under selection
tary Data.
   We used the R package randomForest version 4.6-14 (35)                 To extract the genes within windows under selection, we
in R version 3.5.2 (36). The model was trained with the 15                used intersectBed from BEDTools version 2.28.0 (40) using
4 NAR Genomics and Bioinformatics, 2020, Vol. 2, No. 3
Downloaded from https://academic.oup.com/nargab/article/2/3/lqaa061/5901065 by guest on 17 October 2020
Figure 2. Correlation between calculated statistics for each subspecies: (A) P.t. troglodytes, (B) P.t. schweinfurthii, (C) P.t. ellioti and (D) P.t. verus.
the .gtf file from Ensembl release 90. The gene overlap was panzees (see Section 1.2 in the Supplementary Data and
plotted using jvenn (41). We then used the desktop version Supplementary Figure S1 for further information). We used
of the Ensembl variant effect predictor [release 93 (42)] to the simulations to train a random forest algorithm; see the
extract possible functional variants under selection. We ex- ‘Materials and Methods’ section for additional informa-
tract all sites with predicted impact high, moderate and low. tion. We observe a low OOB error rate for each subspecies
We extract allele frequencies for each variant site for all four (P.t. verus = 2.94%, P.t. ellioti = 2.62%, P.t. schweinfurthii
subspecies in order to assess differences among them. = 1.26% and P.t. troglodytes = 1.09%), indicating that we
are able to discern between selective and neutral regions,
based on selective simulations (see Supplementary Figures
RESULTS S44–S51 and Supplementary Tables S2–S5 for subspecies-
specific and test-specific performances). For all four sub-
Regions identified using the random forest machine learning
species, the model has higher false negative (i.e. incorrectly
approach
categorizing as neutral) rates than false positive (i.e. incor-
We trained a machine learning algorithm to discern be- rectly categorizing as selection) in all cases; the false positive
tween regions of the genome that have been evolving neu- rate isNAR Genomics and Bioinformatics, 2020, Vol. 2, No. 3 5
Table 2. Regions of the genome for each subspecies of chimpanzee identified as under selection (P.t.v. is P.t. verus, P.t.e. is P.t. ellioti, P.t.s. is P.t. schwein-
furthii and P.t.t. is P.t. troglodytes)
Regions under Relative genome Total number of Number of unique Proportion of regions
Subspecies selection proportion genes genes without genes
P.t.v. 373 0.48% 302 257 54.4%
P.t.e. 322 0.42% 381 322 28.6%
P.t.s. 328 0.58% 356 269 33.2%
P.t.t. 743 1.11% 823 694 29.1%
main confident that we are extracting true signatures of pos- Table 3. The number of regions and genes identified as under selection in
itive selection, we test whether these regions are the target of more than one subspecies (P.t.v. is P.t. verus, P.t.e. is P.t. ellioti, P.t.s. is P.t.
background selection. Negative selection is a demography- schweinfurthii and P.t.t. is P.t. troglodytes)
Downloaded from https://academic.oup.com/nargab/article/2/3/lqaa061/5901065 by guest on 17 October 2020
free process (43) that can cause similar reductions in genetic Subspecies Overlapping regions Overlapping genes
diversity, which may be falsely picked up in our positive se-
P.t.e.–P.t.s. 10 5
lection scan. While previous research indicates that positive P.t.e.–P.t.t. 29 39
selection is needed to explain the reduced genetic diversity P.t.e.–P.t.v. 10 11
around gene regions in the great apes (5), we performed the P.t.s.–P.t.t. 63 64
MK test (6) in all gene regions as compared with bonobo in P.t.s.–P.t.v. 11 10
order to confirm that our identified regions have not been P.t.t.–P.t.v. 22 16
P.t.e.–P.t.s.–P.t.t. 4 2
confounded by negative selection. We found that none of P.t.e.–P.t.t.–P.t.v. 1 2
the regions determined as under positive selection in our P.t.s.–P.t.t.–P.t.v. 5 6
random forest model reached genome-wide significance for
the MK test. However, a small fraction of regions (1, indicating a decrease in non-silent di- ble 2 and Supplementary Table S12), we find 823 genes as
vergence. We removed these regions from the remainder of being targets of selection for P.t. troglodytes, while the re-
our analysis. These results indicate that our input statistics maining three subspecies have around 300 genes each. For
effectively removed regions under strong negative selection all four subspecies, the signals of selection are enriched for
but were confounded by regions under weak negative selec- genes, based on randomly sampling the same number of
tion. This is likely since none of our 15 statistics is using regions 100 000 times for each subspecies P-value6 NAR Genomics and Bioinformatics, 2020, Vol. 2, No. 3
P.t. troglodytes is ‘U12-type spliceosomal complex’ because
these two subspecies share a signal of selection in Splicing
Factor 3B subunits 2–4 (SF3B2, SF3B3 and SF3B4). These
genes encode for proteins that are part of a four-protein
complex that is essential for the splicing of pre-mRNA (49).
For a detailed description of genes and the unique divergent
variants shared between two subspecies of chimpanzee, see
Section 2.2 in the Supplementary Data.
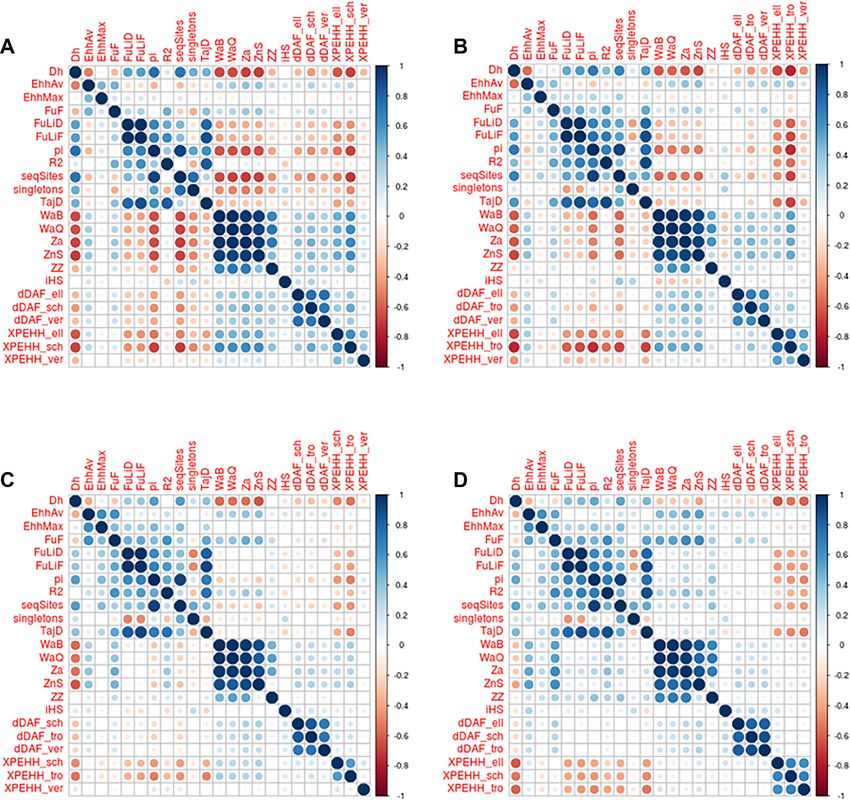
By far, the majority of selective sweeps are observed to
be unique to each subspecies (Figure 3). These sweeps have
largely acted on gene regions (Supplementary Tables S8–
S12). We observe 4 significant (FDR < 0.05) GO terms for
P.t. verus, 7 for P.t. ellioti, 4 for P.t. schweinfurthii and 16
Downloaded from https://academic.oup.com/nargab/article/2/3/lqaa061/5901065 by guest on 17 October 2020
for P.t. troglodytes (Supplementary Table S14). The same
GO term from above, ‘U12-type spliceosomal complex’, is
again significant, and in addition to the three subunits of
SF3B, P.t. troglodytes additionally has a signal in the fourth
subunit SF3B1 as well as RNA-Binding Region-Containing
Protein 3 (RNPC3), which acts as bridge between the U11
and U12 spliceosomes (50). These signals in concert with
the large signals of selection outside coding regions indicate
the importance of regulation to the evolutionary history of
chimpanzee.
Despite indications that regulation is an important tar-
get of selection, the majority of signals are in coding re-
Figure 3. Venn diagram depicting the number of genes, predicted to be gions, and we have identified many possible functional tar-
under putative positive selection, which overlap between subspecies. P.t.e. gets of selection. Altogether, we identify 329 genes with mis-
represents P.t. ellioti, P.t.s. represents P.t. schweinfurthii, P.t.t. represents sense substitutions, 6 genes with splice acceptors/donors,
P.t. troglodytes and P.t.v. represents P.t. verus. 95 genes with splice variants, 1 gene with a start loss, 1 gene
with a stop loss, 9 genes with a stop gain and 371 genes with
a synonymous substitution (Supplementary Table S15–S19)
tect selection in common targets of selection may be due that are unique to the subspecies with the signal of selection.
to power more than biology; specifically, our power for this In addition, we detected 24 candidate derived alleles that are
subspecies is 88%. In general, the dearth of common signals shared between subspecies having overlapping signals of se-
may be due to power in general, as our false negative rates lection, where the subspecies lacking the signal do not have
are relatively high (up to 16%). Furthermore, within these that candidate derived allele segregating in its population
regions, half of the common genes overlap; therefore, it is (Supplementary Table S15). See Section 2.3 in the Supple-
unlikely that all genes are driving the signal of selection. For mentary Data for specifics.
more information about the specific genes and their func-
tions, see Section 2.1 in the Supplementary Data and Sup-
Chimpanzee selection map
plementary Table S12.
For regions of selection common between two subspecies, We provide a comprehensive genome-wide map of selec-
we observe a pattern that largely matches geography of tion signals. These data can be viewed and used in the
chimpanzee. The largest proportion of sharing can be ob- form of a USCS genome browser, available at http://hsb.upf.
served between P.t. troglodytes and P.t. schweinfurthii (64 edu/chimp browser/index.html, following the criteria and
genes; Figure 3 and Supplementary Table S12). This large configuration of a published human dataset (25,44). The
proportion of sharing would be expected because their habi- UCSC-style format facilitates the integration with the rich
tats are neighboring, split by the Congo River. The sec- UCSC browser tracks. A search allows easy access to re-
ond highest amount of sharing is between P.t. troglodytes sults for specific genes or genomic regions, and all raw data
and P.t. ellioti. These subspecies live in central Africa west for each test and the composite random forest score can be
of the Congo River, and were only recognized as separate conveniently downloaded using the UCSC Table function.
subspecies through genetics (47,48). Their close proximity We expect this to be a valuable resource for a wide range
would suggest that they likely encounter similar selective of future analyses. As such, it provides a broad picture of
pressures, leading to the observed high proportion of shared the action of positive selection in each genomic region in all
selective sweeps despite their long divergence time. four chimpanzee subspecies.
We observe seven significant (overall FDR < 0.05) GO
terms for genes that are shared between two subspecies,
DISCUSSION
specifically three terms for P.t. ellioti and P.t. schweinfurthii,
one for P.t. schweinfurthii and P.t. troglodytes, and three for We have produced a descriptive genomic map for chim-
P.t. troglodytes and P.t. verus (Supplementary Table S14). panzee positive selection. With these results, we created
The one GO term shared between P.t. schweinfurthii and a community resource that allows researchers to furtherNAR Genomics and Bioinformatics, 2020, Vol. 2, No. 3 7
investigate selection at the level of subspecies in chim- ter understanding the genotype–phenotype map of chim-
panzee. These tracks can be viewed using the UCSC genome panzees.
browser website; each of the calculated statistics has its own
track that can be selectively viewed or downloaded using the
Table function. It will be of use to researchers investigat- SUPPLEMENTARY DATA
ing chimpanzee phenotypes, clinicians investigating disease Supplementary Data are available at NARGAB Online.
differences among human and great apes, and evolutionary
biologists interested in speciation, among others.
These results indicate that positive selection is an im- FUNDING
portant driver for differentiation between populations and Agencia Estatal de Investigación (Spain) [PID2019-
eventual speciation. We find that out of all the genes with 110933GB-I00, CEX2018-000792-M, in part]; Secretaria
signals of positive selection, the vast majority are unique to d’Universitats i Recerca del Departament d’Economia i
a certain subspecies. While these signals may be decreased
Downloaded from https://academic.oup.com/nargab/article/2/3/lqaa061/5901065 by guest on 17 October 2020
Coneixement de la Generalitat de Catalunya [GRC 2017
due to power, this indicates that many interesting differ- SGR 702]; Agency for Management of University and
ences between the subspecies appear to be mainly driven by Research Grants [FI-DGR 2015 to J.N.]; Part of the
environmental differences. Although three of the four sub- “Unidad de Excelencia Marı́a de Maeztu” [MDM-2014-
species live in seemingly ecologically similar habitats, their 0370], funded by the Ministerio de Economı́a, Industria y
genomes indicate that exposures to subtle differences have Competividad (MINECO, Spain).
resulted in differential adaptations. Our results confirm a Conflict of interest statement. None declared.
previous study, which found that allopatric speciation was
not sufficient to explaining the divergence between P.t. el-
lioti and P.t. troglodytes (10,36). Coupled with our results, REFERENCES
we find evidence that selection has been a major driver for 1. Kaessmann,H., Wiebe,V. and Paabo,S. (1999) Extensive nuclear DNA
differentiation. sequence diversity among chimpanzees. Science, 286, 1159–1162.
We observe a clear impact by the demographic history on 2. Fischer,A., Wiebe,V., Paabo,S. and Przeworski,M. (2004) Evidence
the signals of selection. The population that has more than for a complex demographic history of chimpanzees. Mol. Biol. Evol.,
twice the number of signals, P.t. troglodytes, as compared 21, 799–808.
3. Prado-Martinez,J., Sudmant,P.H., Kidd,J.M., Li,H., Kelley,J.L.,
with the other three subspecies has the highest effective size. Lorente-Galdos,B., Veeramah,K.R., Woerner,A.E., O’Connor,T.D.,
This is an expected result because genetic drift is weaker in Santpere,G. et al. (2013) Great ape genetic diversity and population
populations with large effective populations; as a result, se- history. Nature, 499, 471–475.
lection can more easily drive beneficial alleles to high fre- 4. de Manuel,M., Kuhlwilm,M., Frandsen,P., Sousa,V.C., Desai,T.,
Prado-Martinez,J., Hernandez-Rodriguez,J., Dupanloup,I., Lao,O.,
quencies (5). We also observe a higher proportion of signals Hallast,P. et al. (2016) Chimpanzee genomic diversity reveals ancient
outside coding regions for P.t. verus, although the biological admixture with bonobos. Science, 354, 477–481.
reason for this remains unclear. Moreover, GO results point 5. Nam,K., Munch,K., Mailund,T., Nater,A., Greminger,M.P.,
to genic controls on regulation (e.g. mRNA preprocessing Krutzen,M., Marquès-Bonet,T. and Schierup,M.H. (2017) Evidence
with significant enrichment of signals of selection indicat- that the rate of strong selective sweeps increases with population size
in the great apes. Proc. Natl Acad. Sci. U.S.A., 114, 1613–1618.
ing that regulatory regions are significant targets in driving 6. Ohta,T. and Kimura,M. (1969) Linkage disequilibrium at steady state
adaptation). Demographic models used here are based on determined by random genetic drift and recurrent mutation. Genetics,
(10) and adapted to take into account meaningful admix- 63, 229–238.
ture events and long-term effective population size differ- 7. Arnold,M.L. and Martin,N.H. (2009) Adaptation by introgression. J.
Biol., 8, 82.
ences between subspecies; however, it is worth mentioning 8. 1000 Genomes Project Consortium (2005) A haplotype map of the
that the robustness of our scan is sensitive to any misspec- human genome. Nature, 437, 1299–1320.
ified demography [see (51) for a discussion]. Our statistical 9. Howie,B.N., Donnelly,P. and Marchini,J. (2009) A flexible and
framework used neutral and positive selection to train the accurate genotype imputation method for the next generation of
random forest algorithm using different selection times and genome-wide association studies. PLoS Genet., 5, e1000529.
10. Schmidt,J.M., de Manuel,M., Marques-Bonet,T., Castellano,S. and
coefficients. These two parameters were coupled to increase Andrés,A.M. (2019) The impact of genetic adaptation on chimpanzee
the efficiency of simulation by increasing the selection coef- subspecies differentiation. PLoS Genet., 15, e1008485.
ficient for short and recent selection times. However, this 11. Ewing,G. and Hermisson,J. (2010) MSMS: a coalescent simulation
design precludes selection coefficient and timescale to be program including recombination, demographic structure and
selection at a single locus. Bioinformatics, 26, 2064–2065.
separated in the analysis and to evaluate the random for- 12. Tajima,F. (1989) Statistical method for testing the neutral mutation
est power to detect different strengths of selection. hypothesis by DNA polymorphism. Genetics, 123, 585–595.
Our comprehensive scan of the chimpanzee genome cou- 13. Fu,Y.X. and Li,W.H. (1993) Statistical tests of neutrality of
pled with the extensive simulations of selection scenarios mutations. Genetics, 133, 693–709.
occurring in the last 60 kya allows for robust categoriza- 14. Ramos-Onsins,S.E. and Rozas,J. (2002) Statistical properties of new
neutrality tests against population growth. Mol. Biol. Evol., 19,
tion of regions of the genome as under selection. This work 2092–2100.
confirms and expands previous scans of selection in chim- 15. Voight,B.F., Kudaravalli,S., Wen,X.Q. and Pritchard,J.K. (2006) A
panzee (5,32,45,52). Our data are available for use by the map of recent positive selection in the human genome. PLoS Biol., 4,
community in a convenient genome browser. A detailed 446–558.
16. Sabeti,P.C., Reich,D.E., Higgins,J.M., Levine,H.Z.P., Richter,D.J.,
map of interesting genetic differences between these sub- Schaffner,S.F., Gabriel,S.B., Platko,J.V., Patterson,N.J.,
species is an important tool to use when building a bet- McDonald,G.J. et al. (2002) Detecting recent positive selection in the
human genome from haplotype structure. Nature, 419, 832–837.8 NAR Genomics and Bioinformatics, 2020, Vol. 2, No. 3
17. Wall,J.D. (1999) Recombination and the power of statistical tests of 36. R Core Team. (2017) In: R: A Language and Environment for
neutrality. Genet. Res., 74, 65–79. Statistical Computing. R Foundation for Statistical Computing,
18. Wall,J.D. (2000) A comparison of estimators of the population Vienna.
recombination rate. Mol. Biol. Evol., 17, 156–163. 37. McDonald,J.H. and Kreitman,M. (1991) Adaptive protein evolution
19. Fu,Y.X. (1997) Statistical tests of neutrality of mutations against at the Adh locus in Drosophila. Nature, 351, 652–654.
population growth, hitchhiking and background selection. Genetics, 38. Pfeifer,B., Wittelsbuerger,U., Ramos-Onsins,S.E. and Lercher,M.J.
147, 915–925. (2014) PopGenome: an efficient Swiss army knife for population
20. Rozas,J., Gullaud,M., Blandin,G. and Aguade,M. (2001) DNA genomic analyses in R. Mol. Biol. Evol., 31, 1929–1936.
variation at the rp49 gene region of Drosophila simulans: evolutionary 39. Mi,H., Muruganujan,A., Ebert,D., Huang,X. and Thomas,P.D.
inferences from an unusual haplotype structure. Genetics, 158, (2019) PANTHER version 14: more genomes, a new PANTHER
1147–1155. GO-slim and improvements in enrichment analysis tools. Nucleic
21. Kelly,J.K. (1997) A test of neutrality based on interlocus associations. Acids Res., 47, D419–D426.
Genetics, 146, 1197–1206. 40. Quinlan,A.R. and Hall,I.M. (2010) BEDTools: a flexible suite of
22. Hofer,T., Ray,N., Wegmann,D. and Excoffier,L. (2009) Large allele utilities for comparing genomic features. Bioinformatics, 26, 841–842.
frequency differences between human continental groups are more 41. Bardou,P., Mariette,J., Escudié,F., Djemiel,C. and Klopp,C. (2014)
Downloaded from https://academic.oup.com/nargab/article/2/3/lqaa061/5901065 by guest on 17 October 2020
likely to have occurred by drift during range expansions than by jvenn: an interactive Venn diagram viewer. BMC Bioinformatics, 15,
selection. Ann. Hum. Genet., 73, 95–108. 293.
23. Sabeti,P.C., Varilly,P., Fry,B., Lohmueller,J., Hostetter,E., 42. McLaren,W., Gil,L., Hunt,S.E., Singh Riat,H., Ritchie,G.R.S.,
Cotsapas,C., Xie,X., Byrne,E.H., McCarroll,S.A., Gaudet,R. et al. Thormann,A., Flicek,P. and Cunningham,F. (2016) The Ensembl
(2007) Genome-wide detection and characterization of positive variant effect predictor. Genome Biol., 17, 122.
selection in human populations. Nature, 449, 913–918. 43. Charlesworth,B., Morgan,M.T. and Charlesworth,D. (1993) The
24. Nei,M. and Li,W.H. (1979) Mathematical model for studying genetic effect of deleterious mutations on neutral molecular variation.
variation in variation in terms of restriction endonucleases. Proc. Natl Genetics, 134, 1289–1303.
Acad. Sci. U.S.A., 76, 5269–5273. 44. Pybus,M., Luisi,P., Dall’Olio,G.M., Uzkudun,M., Laayouni,H.,
25. Pybus,M., Dall’Olio,G.M., Luisi,P., Uzkudun,M., Bertranpetit,J. and Engelken,J. (2015) Hierarchical boosting: a
Carreno-Torres,A., Pavlidis,P., Laayouni,H., Bertranpetit,J. and machine-learning framework to detect and classify hard selective
Engelken,J. (2014) 1000 Genomes Selection Browser 1.0: a genome sweeps in human populations. Bioinformatics, 31, 3946–3952.
browser dedicated to signatures of natural selection in modern 45. Cagan,A., Theunert,C., Laayouni,H., Santpere,G., Pybus,M.,
humans. Nucleic Acids Res., 42, D903–D909. Casals,F., Prüfer,K., Navarro,A., Marquès-Bonet,T., Bertranpetit,J.
26. Kass,G.V. (1980) An exploratory technique for investigating large et al. (2016) Natural selection in the great apes. Mol. Biol. Evol., 33,
quantities of categorical data. J. Appl. Stat., 20, 119–127. 3268–3283.
27. Breiman,L., Friedman,J.H., Olshen,R.A. and Stone,C.J. (1984) In: 46. Nye,J., Laayouni,H., Kuhlwilm,M., Mondal,M., Marques-Bonet,T.
Classification and Regression Trees, Wadsworth, Inc., Belmont. and Bertranpetit,J. (2018) Selection in the introgressed regions of the
28. Krzywinski,M. and Altman,N. (2017) Classification and regression chimpanzee genome. Genome Biol. Evol., 10, 1132–1138.
trees. Nat. Methods, 14, 755–756. 47. Gonder,M.K., Oates,J.F., Disotell,T.R., Forstner,M.R.J.,
29. Breiman,L. (2001) Random forests. Mach. Learn., 45, 5–32. Morales,C.J. and Melnick,D.J. (1997) A new west African
30. Jay,F., Boitard,S. and Austerlitz,F. (2019) An ABC method for chimpanzee subspecies? Nature, 388, 337.
whole-genome sequence data: inferring Paleolithic and Neolithic 48. Pilbrow,V. (2006) Population systematics of chimpanzees using molar
human expansions. Mol. Biol. Evol., 36, 1565–1579. morphometrics. J. Hum. Evol., 51, 646–662.
31. Mondal,M., Bertranpetit,J. and Lao,O. (2019) Approximate Bayesian 49. Gozani,O., Feld,R. and Reed,R. (1996) Evidence that
computation with deep learning supports a third archaic sequence-independent binding of highly conserved U2 snRNP
introgression in Asia and Oceania. Nat. Commun., 10, 246. proteins upstream of the branch site is required for assembly of
32. Sheehan,S. and Song,Y.S. (2016) Deep learning for population spliceosomal complex A. Genes Dev., 19, 233–243.
genetic inference. PLoS Comput. Biol., 12, e1004845. 50. Benecke,H., Luhrmann,R. and Will,C.L. (2005) The U11/U12
33. Sugden,L.A., Atkinson,E.G., Fischer,A.P., Rong,S., Henn,B.M. and snRNP 65K protien acts as a molecular bridge, binding the U12
Ramachandran,S. (2018) Localization of adaptive variants in human snRNA and U11-59K protein. EMBO J., 24, 3057–3069.
genomes using averaged one-dependence estimation. Nat. Commun., 51. Smith,M.L., Ruffley,M., Espı́ndola,A., Tank,D.C., Sullivan,J. and
9, 703. Carstens,B.C. (2017) Demographic model selection using random
34. Rahman,R., Dhruba,S.R., Ghosh,S. and Pal,R. (2019) Functional forests and the site frequency spectrum. Mol. Ecol., 26, 4562–4573.
random forest with applications in dose-response prediction. Sci. 52. Mitchell,M.W., Locatelli,S., Ghobrial,L., Pokempner,A.A., Sesink
Rep., 9, 1628. Clee,P.R., Abwee,E.E., Nicholas,A., Nkembi,L., Anthony,N.M.,
35. Liaw,A. and Wiener,M. (2002) Classification and regression by Morgan,B.J. et al. (2015) The population genetics of wild chimpanzee
randomForest. R News, 2, 18–22. in Cameroon and Nigeria suggests a positive role for selection in the
evolution of chimpanzee subspecies. BMC Evol. Biol., 15, 3.You can also read