Renaissance Square OFFERING MEMORANDUM - FORT WORTH, TX
←
→
Page content transcription
If your browser does not render page correctly, please read the page content below
Renaissance Square
    FORT WORTH, TX

OFFERING MEMORANDUM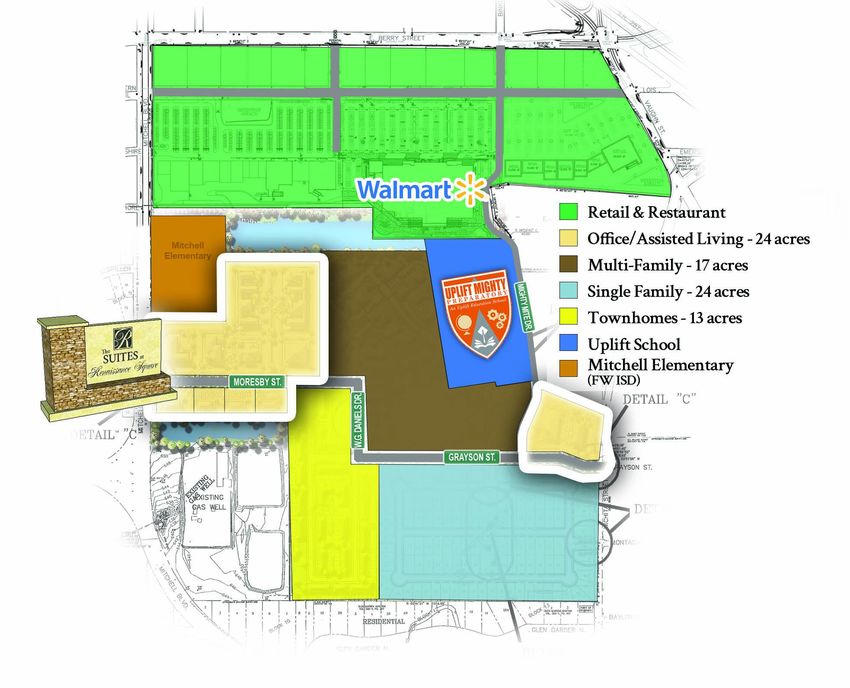
Renaissance Square
                                                    FORT WORTH, TX

                                 CONFIDENTIALITY AND DISCLAIMER

The information contained in the following Marketing Brochure is proprietary and strictly confidential. It is intended to be
reviewed only by the party receiving it from Marcus & Millichap and should not be made available to any other person or
entity without the written consent of Marcus & Millichap. This Marketing Brochure has been prepared to provide summary,
unverified information to prospective purchasers, and to establish only a preliminary level of interest in the subject property.
The information contained herein is not a substitute for a thorough due diligence investigation. Marcus & Millichap has not
made any investigation, and makes no warranty or representation, with respect to the income or expenses for the subject
property, the future projected financial performance of the property, the size and square footage of the property and
improvements, the presence or absence of contaminating substances, PCB's or asbestos, the compliance with State and Federal
regulations, the physical condition of the improvements thereon, or the financial condition or business prospects of any tenant,
or any tenant’s plans or intentions to continue its occupancy of the subject property. The information contained in this
Marketing Brochure has been obtained from sources we believe to be reliable; however, Marcus & Millichap has not verified,
and will not verify, any of the information contained herein, nor has Marcus & Millichap conducted any investigation
regarding these matters and makes no warranty or representation whatsoever regarding the accuracy or completeness of the
information provided. All potential buyers must take appropriate measures to verify all of the information set forth herein.

                                       NON-ENDORSEMENT NOTICE

Marcus & Millichap is not affiliated with, sponsored by, or endorsed by any commercial tenant or lessee identified in this
marketing package. The presence of any corporation’s logo or name is not intended to indicate or imply affiliation with, or
sponsorship or endorsement by, said corporation of Marcus & Millichap, its affiliates or subsidiaries, or any agent, product,
service, or commercial listing of Marcus & Millichap, and is solely included for the purpose of providing tenant lessee
information about this listing to prospective customers.

              ALL PROPERTY SHOWINGS ARE BY APPOINTMENT ONLY. PLEASE CONSULT YOUR
                          MARCUS & MILLICHAP AGENT FOR MORE DETAILS.
Renaissance Square
                 FORT WORTH, TX

              TABLE OF CONTENTS

Section 1                 PRICING AND FINANCIAL ANALYSIS

Section 2                         PROPERTY DESCRIPTION

Section 3                              MARKET OVERVIEW

Section 4                         DEMOGRAPHIC ANALYSIS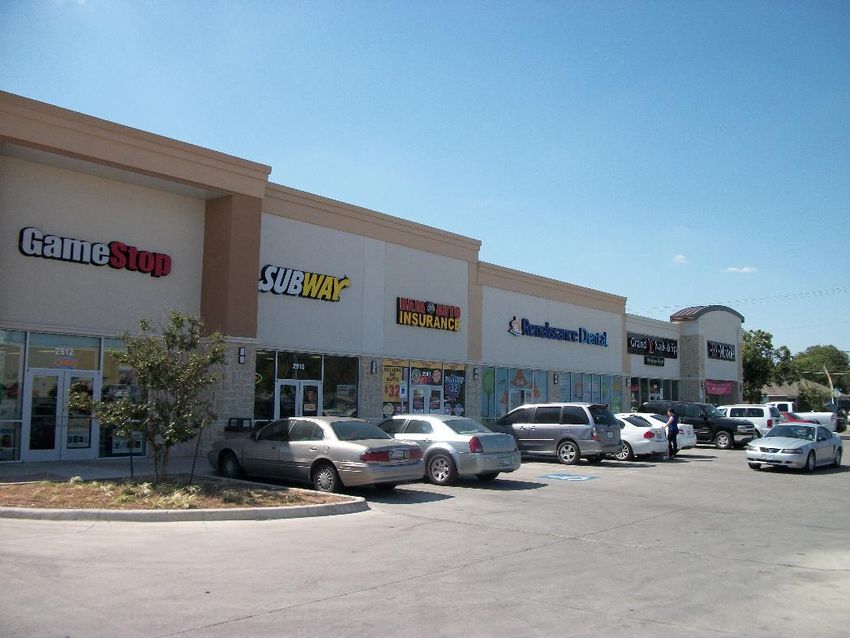
PRICING AND FINANCIAL ANALYSIS

  Renaissance Square
                 FORT WORTH, TX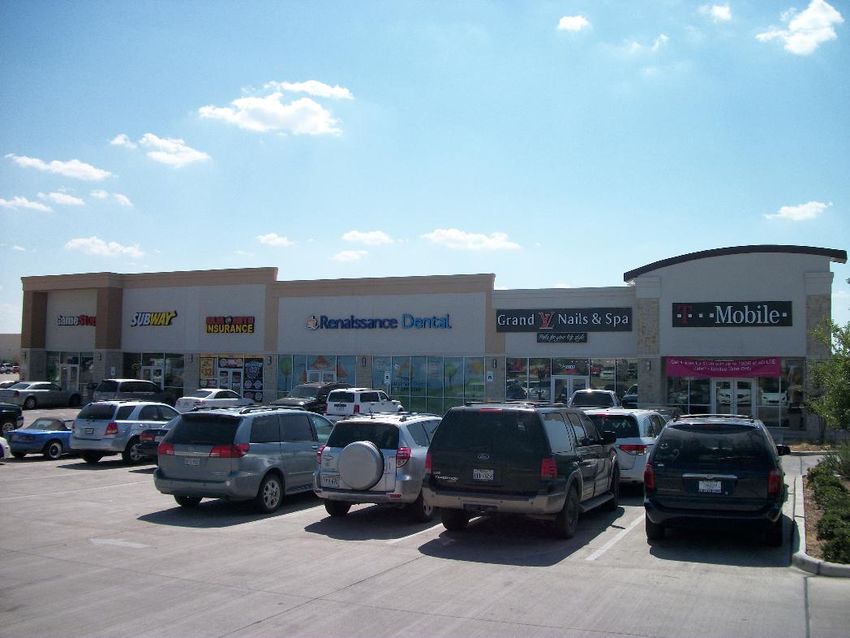
Renaissance Square
FORT WORTH, TX                                                                                                                                    PRICING AND FINANCIAL ANALYSIS

FINANCING

           Existing Financing
           Loan Type                                                                                                                                                  Free and Clear

This information has been secured from sources we believe to be reliable, but we make no representations or warranties, expressed or implied, as to the accuracy of
the information. References to square footage or age are approximate. Buyer must verify the information and bears all risk for any inaccuracies. Marcus &
Millichap is a service mark of Marcus & Millichap Real Estate Investment Services, Inc. © 2015 V0410211 Marcus & Millichap. All rights reserved.

                                                                                                                                                                                       1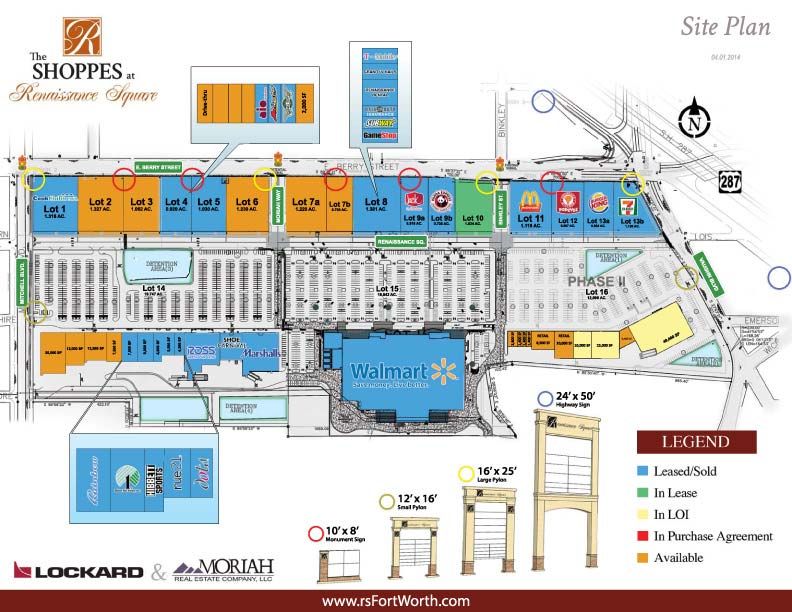
Renaissance Square
FORT WORTH, TX                                                                                                                                    PRICING AND FINANCIAL ANALYSIS

EXPENSES
                                                                                                                                                                      Current    Per SF
  Real Estate Taxes                                                                                                                                                    $63,878    $6.65
  Insurance                                                                                                                                                             $7,700    $0.80
  CAM
       Utilities                                                                                                                                                       $17,115    $1.78
       Parking Lot                                                                                                                                                      $5,558    $0.58
       Trash Removal                                                                                                                                                    $3,043    $0.32
       TOTAL CAM                                                                                                                                                       $25,716    $2.68
  Management Fee                                                                                                                                                       $15,000    $1.56
  TOTAL EXPENSES                                                                                                                                                      $112,294   $11.70

  Tenants (% OF GLA)

                                                                                                                                                 Subway: 12.50%
                               Seham Enterprises, Inc.: 12.50%

                                                                                                                                                 RSQ Dental PLLC: 27.08%
                                             Gamestop, Inc.: 15.63%

                                   Amtel, LLC (T Mobile): 15.63%
                                                                                                                                                 Grand LV Nails: 16.67%

This information has been secured from sources we believe to be reliable, but we make no representations or warranties, expressed or implied, as to the accuracy of
the information. References to square footage or age are approximate. Buyer must verify the information and bears all risk for any inaccuracies. Marcus &
Millichap is a service mark of Marcus & Millichap Real Estate Investment Services, Inc. © 2015 V0410211 Marcus & Millichap. All rights reserved.

                                                                                                                                                                                          2
Renaissance Square
FORT WORTH, TX                                                                                                                                    PRICING AND FINANCIAL ANALYSIS

INCOME & EXPENSES

  Gross Leasable Area (GLA)                                                     9,600         SF

                                                                                                                                                                          Current    Per SF
  Base Rent

          Occupied Space                                                                                                                                                 $226,460    $23.59
          Vacant Space at Market Rents                                                                                                                                         $0
  GROSS POTENTIAL RENT                                                                                                                                                   $226,460    $23.59

  Expense Reimbursements
          Real Estate Taxes                                                                                                                                               $63,878     $6.65
          Insurance                                                                                                                                                        $7,700     $0.80
          CAM                                                                                                                                                             $25,716     $2.68
          Management Fee                                                                                                                                                  $15,000     $1.56

  GROSS POTENTIAL INCOME                                                                                                                                                 $338,754    $35.29
  Vacancy/Collection Allowance (% of GPI)                                                                                                                             5% / $16,938    $1.76
  EFFECTIVE GROSS INCOME                                                                                                                                                 $321,816    $33.52

  Total Expenses                                                                                                                                                         $112,294    $11.70

  NET OPERATING INCOME                                                                                                                                                   $209,522    $21.83

This information has been secured from sources we believe to be reliable, but we make no representations or warranties, expressed or implied, as to the accuracy of
the information. References to square footage or age are approximate. Buyer must verify the information and bears all risk for any inaccuracies. Marcus &
Millichap is a service mark of Marcus & Millichap Real Estate Investment Services, Inc. © 2015 V0410211 Marcus & Millichap. All rights reserved.

                                                                                                                                                                                              3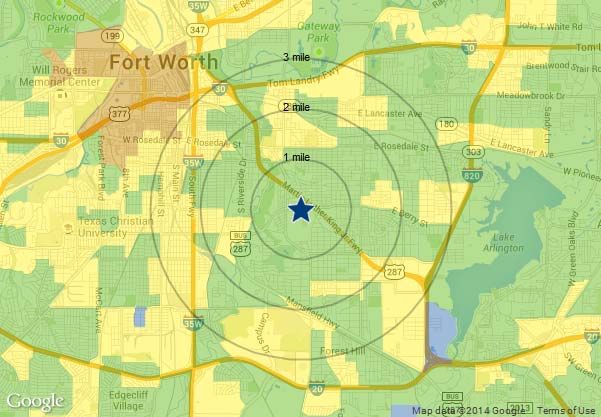
Renaissance Square
        FORT WORTH, TX                                                                                                                                    PRICING AND FINANCIAL ANALYSIS

        TENANT SUMMARY
Suite      Tenant                                       GLA                 % of            Lease                   Lease               Annual           Rent/       Changes Changes       Expense        Other:    Lease
                                                                            GLA          Commence                   Expire                Rent             SF           On:     To:        Reimbs.      Options/     Type
                                                                                                                                                                                                         % Rent

8-1        Amtel, LLC (T Mobile)                       1,500            15.63%                11/27/13           11/30/18           $37,500.00          $25.00                            $17,551.55      2, 5-Yr    NNN
8-2        Grand LV Nails                              1,600            16.67%                  2/25/14            2/25/19          $37,760.00          $23.60        3/01/15   $38,720   $18,719.41      1, 5-Yr    NNN
                                                                                                                                                                      3/01/16   $39,680
                                                                                                                                                                      3/01/17   $40,640
                                                                                                                                                                      3/01/18   $41,600
8-3        RSQ Dental PLLC                             2,600            27.08%                  2/28/14            1/31/24          $62,400.00          $24.00        2/01/20   $68,640   $30,397.99      2, 5-Yr    NNN
8-5        Seham Enterprises, Inc.                     1,200            12.50%                  1/29/14          12/31/18           $26,400.00          $22.00                            $14,036.75      1, 5-Yr    NNN
8-6        Subway                                      1,200            12.50%                  1/15/14            1/31/24          $26,400.00          $22.00        2/01/19   $28,800   $14,036.75      2, 5-Yr    NNN
8-7        Gamestop, Inc.                              1,500            15.63%                10/10/13             1/31/18          $36,000.00          $24.00                            $17,551.55      2, 5-Yr    NNN

           TOTAL VACANT
           TOTAL OCCUPIED                              9,600           100.00%                                                    $226,460.00                                             $112,294.00
           TOTAL                                       9,600           100.00%                                                    $226,460.00                                             $112,294.00

        This information has been secured from sources we believe to be reliable, but we make no representations or warranties, expressed or implied, as to the accuracy of
        the information. References to square footage or age are approximate. Buyer must verify the information and bears all risk for any inaccuracies. Marcus &
        Millichap is a service mark of Marcus & Millichap Real Estate Investment Services, Inc. © 2015 V0410211 Marcus & Millichap. All rights reserved.

                                                                                                                                                                                                                       4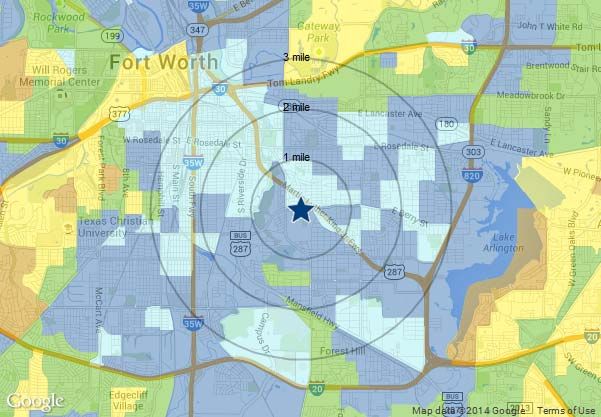
Renaissance Square
FORT WORTH, TX                                                                                                                                              PRICING AND FINANCIAL ANALYSIS

LEASE EXPIRATION SUMMARY

  For The Year Beginning                                       Year 1           Year 2           Year 3           Year 4          Year 5           Year 6           Year 7          Year 8           Year 9                               Year 10
                                                              Jan 2014         Jan 2015         Jan 2016         Jan 2017        Jan 2018         Jan 2019         Jan 2020        Jan 2021         Jan 2022                             Jan 2023
  Tenant(s) Name                                                                                                                Amtel, LLC        Grand LV
                                                                                                                                 (T Mobile)         Nails
                                                                                                                                   Seham
                                                                                                                                Enterprises,
                                                                                                                                    Inc.
                                                                                                                                Gamestop,
                                                                                                                                    Inc.

  Total Number of Tenants                                                                                                            3                1

  Total Square Feet                                                                                                                4,200            1,600

  Total Percentage                                                                                                                 43.8%            16.7%
  Cumulative Percentage                                                                                                            43.8%            60.4%

                                        60%                                                                                                                                                                     3

                                        55%

                                        50%

                                        45%
         Total Project Square Footage

                                        40%                                                                                                                                                                     2

                                                                                                                                                                                                                     Number of Tenants
                                        35%

                                        30%

                                        25%

                                        20%                                                                                                                                                                     1

                                        15%

                                        10%

                                         5%

                                         0%                                                                                                                                                                     0
                                                  Jan 2014       Jan 2015        Jan 2016        Jan 2017        Jan 2018        Jan 2019       Jan 2020        Jan 2021        Jan 2022        Jan 2023
                                                     0%             0%              0%              0%             44%             17%             0%              0%              0%              0%

                                                                         Percentage of SF Expiring              Number of Tenants Expiring             Cumulative % of SF Expiring

                                        Any projections, opinions, assumptions or estimates used here within are for example purposes only and do not represent the current or future performance of the property.

This information has been secured from sources we believe to be reliable, but we make no representations or warranties, expressed or implied, as to the accuracy of
the information. References to square footage or age are approximate. Buyer must verify the information and bears all risk for any inaccuracies. Marcus &
Millichap is a service mark of Marcus & Millichap Real Estate Investment Services, Inc. © 2015 V0410211 Marcus & Millichap. All rights reserved.

                                                                                                                                                                                                                                                    5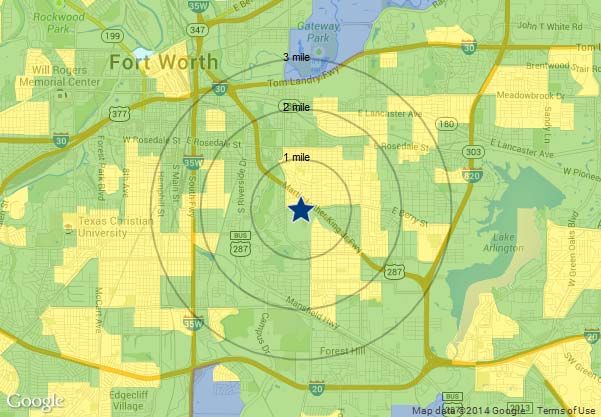
Renaissance Square
FORT WORTH, TX                                                                                                                                    PRICING AND FINANCIAL ANALYSIS

FINANCIAL OVERVIEW
  Location                                                                                               Annualized Operating Data
 2900 East Berry, Lot 8
 Fort Worth, TX 76105                                                                                   Income                                                              Current
                                                                                                        Base Rent
                                                                                                             Occupied Space                                                  $226,460
 Price                                                                 $2,757,000
                                                                                                                Vacant Space at Market Rents                                        $0
 Down Payment                                                             100.0% /
                                                                                                        Gross Potential Rent                                                 $226,460
 Gross Leasable Area (GLA)                                                      9,600
                                                                                                        Expense Reimbursements                                               $112,294
 Price/SF                                                                   $287.19                     Gross Potential Income                                               $338,754
 CAP Rate - Current                                                           7.60%                     Vacancy/Collection Allowance                                      5% / $16,938
 Lot Size                                                             1.381 Acres                       Effective Gross Income                                               $321,816
 Year Built                                                                      2013                   Total Expenses                                                       $112,294
                                                                                                        Net Operating Income                                                 $209,522
                                                                                                        Total Return                                                  7.60% / $209,522

                                                                                                      Expenses

                                                                                                      Real Estate Taxes                                                      $63,878

                                                                                                      Insurance                                                               $7,700
                                                                                                      CAM

                                                                                                              Utilities                                                      $17,115

                                                                                                              Parking Lot                                                     $5,558

                                                                                                              Trash Removal                                                   $3,043

                                                                                                      TOTAL CAM                                                              $25,716

                                                                                                      Management Fee (% of EGI)                                        4.7% / $15,000

                                                                                                      TOTAL EXPENSES                                                        $112,294

                                                                                                      EXPENSES/SF                                                             $11.70

This information has been secured from sources we believe to be reliable, but we make no representations or warranties, expressed or implied, as to the accuracy of
the information. References to square footage or age are approximate. Buyer must verify the information and bears all risk for any inaccuracies. Marcus &
Millichap is a service mark of Marcus & Millichap Real Estate Investment Services, Inc. © 2015 V0410211 Marcus & Millichap. All rights reserved.

                                                                                                                                                                                         6
PROPERTY DESCRIPTION
Renaissance Square
FORT WORTH, TXRenaissance Square
FORT WORTH, TX PROPERTY DESCRIPTION
INVESTMENT OVERVIEW
Investment Highlights
■ 100 Percent Occupied - All Leases are Triple-Net
■ Part of The Shoppes at Renaissance Square - Over 500,000-
Square Foot Walmart Anchored Retail Development
■ Other Major Tenants in the Development Include Marshalls,
Shoe Carnival, Ross Dress for Less, Dots, Hibbett Sports and
Dollar Tree
■ Renaissance Square is a Mixed Use Community Featuring The
Shoppes (Retail), The Villages (Residential), and The Suites
(Office)
■ Located on East Berry Street Just West of Highway 287
■ Densely Populated - Five Mile Population Exceeds 232,945
The subject property is a 9,600-square foot multi-tenant retail center in Fort Worth, Texas. The center is 100 percent
occupied, and all leases are triple-net. Tenants consist of T-Mobile, Grand LV Nails, RSQ Dental, Seham Enterprises,
Subway and GameStop. The building was constructed in 2013 and sits on 1.38 acres of land.
The subject property is located on East Berry Street just west of Highway 287 and is part of The Shoppes at Renaissance
Square, a new retail hub for Southeast Fort Worth. Anchored by Walmart Supercenter, Phase I of The Shoppes
encompasses over 300,000-square feet of general merchandise, clothing, shoes, fast food, and convenience shopping that
opened in 2013. Phase II will include another 200,000-square feet of stores and is expected to launch in 2014. Other
national tenants in the Renaissance Square development include Marshalls, Shoe Carnival, Ross Dress for Less, Dots,
Rue 21, Hibbett Sports, Dollar Tree, Pizza Hut, Wing Stop, Jack in the Box, Panda Express, McDonald’s, Popeyes,
Burger King, 7 Eleven, and others. The area is densely populated, with a five mile population exceeding 232,945.
A survey in 2008 estimated that over $70 million in retail sales left Southeast Fort Worth because of the lack of available
services. Now, with The Shoppes, those sales will stay in the local community and continue to drive growth and vitality.
The Shoppes is expected to create over 1,000 retail jobs, most of which will need to be filled from the surrounding
neighborhoods.
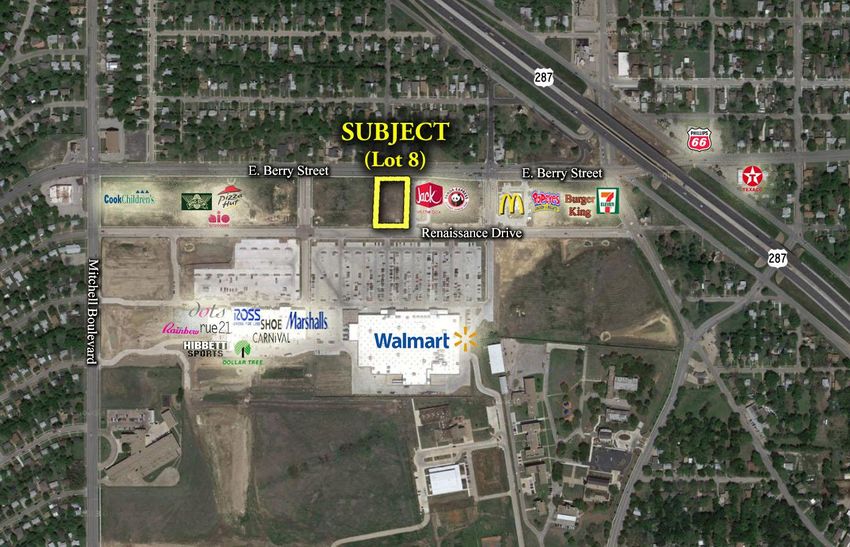
Renaissance Square is a massive mixed use community in the middle of the city, covering 180 acres. In addition to
shopping, dining and entertainment at The Shoppes, the community features The Villages- 80 acres of land zoned and
ready for development into single family homes, townhomes, apartments, and senior living; and The Suites- 20 acres of
land perfectly situated for light office uses. Given its close proximity to downtown and metropolitan services,
Renaissance Square is the perfect location for new urban living.
This information has been secured from sources we believe to be reliable, but we make no representations or warranties, expressed or implied, as to the accuracy of
the information. References to square footage or age are approximate. Buyer must verify the information and bears all risk for any inaccuracies. Marcus &
Millichap is a service mark of Marcus & Millichap Real Estate Investment Services, Inc. © 2015 V0410211 Marcus & Millichap. All rights reserved.
8Renaissance Square
FORT WORTH, TX PROPERTY DESCRIPTION
PROPERTY SUMMARY
The Offering
Property Renaissance Square
Property Address 2900 East Berry, Lot 8
Fort Worth, TX 76105
Site Description
Year Built 2013
Gross Leasable Area (GLA) 9,600 SF
Lot Size 1.381 Acres
Type of Ownership Fee Simple
This information has been secured from sources we believe to be reliable, but we make no representations or warranties, expressed or implied, as to the accuracy of
the information. References to square footage or age are approximate. Buyer must verify the information and bears all risk for any inaccuracies. Marcus &
Millichap is a service mark of Marcus & Millichap Real Estate Investment Services, Inc. © 2015 V0410211 Marcus & Millichap. All rights reserved.
9Renaissance Square
FORT WORTH, TX PROPERTY DESCRIPTION
PROPERTY PHOTOS
This information has been secured from sources we believe to be reliable, but we make no representations or warranties, expressed or implied, as to the accuracy of
the information. References to square footage or age are approximate. Buyer must verify the information and bears all risk for any inaccuracies. Marcus &
Millichap is a service mark of Marcus & Millichap Real Estate Investment Services, Inc. © 2015 V0410211 Marcus & Millichap. All rights reserved.
10Renaissance Square
FORT WORTH, TX PROPERTY DESCRIPTION
AREA MAPS
Local Map Regional Map
This information has been secured from sources we believe to be reliable, but we make no representations or warranties, expressed or implied, as to the accuracy of
the information. References to square footage or age are approximate. Buyer must verify the information and bears all risk for any inaccuracies. Marcus &
Millichap is a service mark of Marcus & Millichap Real Estate Investment Services, Inc. © 2015 V0410211 Marcus & Millichap. All rights reserved.
11Renaissance Square FORT WORTH, TX PROPERTY DESCRIPTION THE SHOPPES - SITE PLAN This information has been secured from sources we believe to be reliable, but we make no representations or warranties, expressed or implied, as to the accuracy of the information. References to square footage or age are approximate. Buyer must verify the information and bears all risk for any inaccuracies. Marcus & Millichap is a service mark of Marcus & Millichap Real Estate Investment Services, Inc. © 2015 V0410211 Marcus & Millichap. All rights reserved. 12
Renaissance Square
 FORT WORTH, TX                                                                                                                                                                                                                PROPERTY DESCRIPTION

 MASTER SITE PLAN

This information has been secured from sources we believe to be reliable, but we make no representations or warranties, expressed or implied, as to the accuracy of the information. References to square footage or age are
approximate. Buyer must verify the information and bears all risk for any inaccuracies. Marcus & Millichap is a service mark of Marcus & Millichap Real Estate Investment Services, Inc. © 2015 V0410211 Marcus &
Millichap. All rights reserved.                                                                                                                                                                                                                   13
Renaissance Square
 FORT WORTH, TX                                                                                                                                                                                                                PROPERTY DESCRIPTION

 AERIAL PHOTO

This information has been secured from sources we believe to be reliable, but we make no representations or warranties, expressed or implied, as to the accuracy of the information. References to square footage or age are
approximate. Buyer must verify the information and bears all risk for any inaccuracies. Marcus & Millichap is a service mark of Marcus & Millichap Real Estate Investment Services, Inc. © 2015 V0410211 Marcus &
Millichap. All rights reserved.                                                                                                                                                                                                                   14
MARKET OVERVIEW

Renaissance Square
         FORT WORTH, TX
Renaissance Square
FORT WORTH, TX MARKET OVERVIEW
DALLAS-FORT WORTH
Market Highlights
High population growth
■ Dallas/Fort Worth’s population growth from
2010 to 2013 ranks among the highest in the
U.S. for a major metro.
Heavy concentration of headquarters
■ The Metroplex is home to 18 Fortune 500
companies and many regional headquarters.
High median household income
■ The annual median household income in
Dallas/Fort Worth, at $59,400, is well above
the U.S. median of $52,400.
Geography
Centrally located in the southern portion of the
United States, Dallas/Fort Worth is one of the
largest metros in the nation, stretching across
9,300 square miles in northern Texas. The eastern
portion of the Metroplex is situated in the
Blackland Prairie region, so named for its fertile
black soil. This area is dotted with man-made
lakes, as well as streams, creeks and rivers. The
western portion of the Metroplex falls within the
Fort Worth Prairie. Much of this former
ranchland sits atop a natural oil field and the
Dallas-Fort Worth-Arlington Metro
Barnett Shale geological formation.
This information has been secured from sources we believe to be reliable, but we make no representations or warranties, expressed or implied, as to the accuracy of
the information. References to square footage or age are approximate. Buyer must verify the information and bears all risk for any inaccuracies. Marcus &
Millichap is a service mark of Marcus & Millichap Real Estate Investment Services, Inc. © 2015 V0410211 Marcus & Millichap. All rights reserved.
16Renaissance Square
FORT WORTH, TX MARKET OVERVIEW
DALLAS-FORT WORTH
Metro
The Dallas/Fort Worth Metroplex is the fourth-largest
metro in the nation and is composed of 12 counties,
with an aggregate of more than 6.7 million residents.
Population growth in the region was tremendous
during the past decade, outperforming most U.S.
metros. The population of the Metroplex is expected to
expand 1.5 percent per year through 2018.
Infrastructure Largest Cities in Metro by Population
Dallas 1,248,700
The region’s transportation network is continually
Fort Worth 781,600
evolving to improve traffic flow as freeways are Arlington 379,800
expanded and tollways and turnpike miles are added. Plano 272,700
Garland 236,100
Recent projects include the LBJ Freeway and State Irving 227,500
Highway 121. Dallas Area Rapid Transit (DART) Sources: Marcus & Millichap Research Services, Experian
operates 612 buses and an 85-mile light-rail system that
serve Dallas and surrounding cities. Trinity Railway Airports
Express is a commuter rail that connects Dallas, Fort ■ Dallas/Fort Worth International Airport
■ Dallas Love Field Airport
Worth and the Dallas/Fort Worth International ■ 13 smaller airports
Airport. Major Roadways
■ Interstates 20, 30, 35, 45, 635 and 820
■ Toll roads, turnpikes
The business community has easy access to major
commercial centers around the globe via Dallas/Fort Rail
■ Freight - Union Pacific, BNSF, Kansas City
Worth International Airport, home to American Southern
Airlines; Dallas Love Field, home to Southwest ■ Passenger - Trinity Railway Express, Amtrak
■ Light rail - DART
Airlines; and Alliance Airport. The Metroplex’s
Port
strategic location on Interstate 35 and the NAFTA ■ International Inland Port of Dallas
Superhighway, its intermodal facilities, and the The Dallas/Fort Worth Metroplex is:
International Inland Port of Dallas, ensure its status as ■ 200 miles from Austin
■ 230 miles from Houston
a national distribution hub for years to come.
■ 880 miles from Denver
■ 925 miles from Chicago
This information has been secured from sources we believe to be reliable, but we make no representations or warranties, expressed or implied, as to the accuracy of
the information. References to square footage or age are approximate. Buyer must verify the information and bears all risk for any inaccuracies. Marcus &
Millichap is a service mark of Marcus & Millichap Real Estate Investment Services, Inc. © 2015 V0410211 Marcus & Millichap. All rights reserved.
17Renaissance Square
FORT WORTH, TX MARKET OVERVIEW
DALLAS-FORT WORTH
Economy
The Dallas/Fort Worth economy continues to evolve.
Companies migrating to the area are attracted by warm
weather, no state income tax, and a right-to-work
policy. These qualities, combined with an educated
work force, diverse population and low housing costs,
have led to extraordinary growth in the Metroplex and
will continue to draw new businesses. Economic
expansion will be further fueled by a rise in financial
services and high-tech companies.
Dallas/Fort Worth is home to 18 Fortune 500
companies in diverse economic sectors including
energy, food, healthcare services, telecommunications,
and retail. They include ExxonMobil, American
Airlines Group, AT&T, Kimberly-Clark and J.C.
Penney. The area also has one of the highest
concentrations of privately held companies
headquartered locally. In addition, nearly 150
companies that employ at least 1,000 workers globally
have headquarters in the Metroplex.
Dallas/Fort Worth’s central location and vast
intermodal facilities allow the Metroplex to be the pre-
eminent distribution hub for the burgeoning
Southwest. This is due in part to increased energy costs,
which have driven the need for a greater regionalized
transportation distribution system. Trade and
transportation companies provide roughly one-fifth of
total employment and infuse billions of dollars each
year into the local economy.
This information has been secured from sources we believe to be reliable, but we make no representations or warranties, expressed or implied, as to the accuracy of
the information. References to square footage or age are approximate. Buyer must verify the information and bears all risk for any inaccuracies. Marcus &
Millichap is a service mark of Marcus & Millichap Real Estate Investment Services, Inc. © 2015 V0410211 Marcus & Millichap. All rights reserved.
18Renaissance Square
FORT WORTH, TX MARKET OVERVIEW
DALLAS-FORT WORTH
Labor
Dallas/Fort Worth is one of the nation’s largest employment markets, with more than 3.1 million jobs. The
Metroplex fared better than most of the nation during the past five years with more than 241,400 positions added,
and local employers are forecast to create nearly 470,500 jobs through the end of 2018. Employment growth can
be attributed to the continuation of north-to-south migration; the Metroplex’s quality of life; lack of state income
taxes, which has attracted employees; and pro-business community evolution, which has drawn both businesses
and workers.
Dallas was one of the few metros that boasted multiple expanding employment sectors through the worst years of
the recent recession. Over the last five years, professional and business services, leisure and hospitality, and the
construction sector have all grown more than 3 percent annually. Every business sector is expected to grow by at
least 1 percent through 2018.
Over the next five years, the construction sector is forecast to register the greatest annual growth, roughly 4.1
percent, as development accelerates to accommodate the area’s expanding population and economy. The
government, manufacturing, and education and health services sectors follow, each recording an expansion of
more than 2.5 percent per year during this period. The trade, transportation and utilities sector is an important
economic driver in the region, employing nearly 650,000 workers. This sector is forecast to grow 1.2 percent
annually through 2018.
This information has been secured from sources we believe to be reliable, but we make no representations or warranties, expressed or implied, as to the accuracy of
the information. References to square footage or age are approximate. Buyer must verify the information and bears all risk for any inaccuracies. Marcus &
Millichap is a service mark of Marcus & Millichap Real Estate Investment Services, Inc. © 2015 V0410211 Marcus & Millichap. All rights reserved.
19Renaissance Square
FORT WORTH, TX MARKET OVERVIEW
DALLAS-FORT WORTH
Employers
Dallas/Fort Worth has evolved from a commodities-
based economy to a high-tech and telecommunications
hub, as well as a haven for corporate headquarters.
There are 18 Fortune 500 companies and more than 40
Fortune 1000 businesses are housed in the area, many
of which are in Las Colinas.
Two major airlines are headquartered locally.
American Airlines operates out of Dallas/Fort Worth
International Airport, and Southwest Airlines operates
from Dallas Love Field.
Texas Instruments is one of the primary employers of Major Employers
high-tech workers. The majority of technology-based Wal-Mart
companies in the region are smaller firms. American Airlines Group
Texas Health Resources
Telecommunications and financial services are growing Baylor Health Care System
industries. Most of the major telecom companies JP Morgan Chase
Lockheed Martin
maintain offices in the region, and State Farm recently
Texas Instruments
signed the areas largest lease in history.
Bank of America Corp.
Verizon Communications, Inc.
Lockheed Martin Corp., based in Fort Worth, anchors
the defense-related manufacturing sector. Other major
defense firms include Bell Helicopter Textron Inc. and
Raytheon Co.
The energy sector includes companies such as
ExxonMobil, Fluor and Atmos Energy. This segment
is expanding due to exploration and gas extraction from
the Barnett Shale formation, which could bring billions
of dollars to the North Texas economy.
This information has been secured from sources we believe to be reliable, but we make no representations or warranties, expressed or implied, as to the accuracy of
the information. References to square footage or age are approximate. Buyer must verify the information and bears all risk for any inaccuracies. Marcus &
Millichap is a service mark of Marcus & Millichap Real Estate Investment Services, Inc. © 2015 V0410211 Marcus & Millichap. All rights reserved.
20Renaissance Square
FORT WORTH, TX MARKET OVERVIEW
DALLAS-FORT WORTH
Demographics
Dallas/Fort Worth’s population has grown significantly
since 2000 with the addition of more than 1.5 million
people, placing the metro among the largest in the
nation. Over the next five years, the population is
expected to grow by more than 500,000 residents.
The Metroplex’s phenomenal population growth is
fueled by strong natural increases, as well as the nation’s
north-to-south migration. The region will continue to
benefit from companies and people moving to the
South for more favorable weather and economic
prospects. The Metroplex remains relatively young; the
median age, at 33.9 years, is well below that of 37.3
years for the nation. Citizens aged 65 years and older
account for just 9 percent of the region’s population.
Unlike many other fast-growing Sun Belt metros,
Dallas/Fort Worth boasts high educational attainment.
Approximately 85 percent of residents age 25 years and
older have earned a high school diploma, and 32.6
percent have attained a bachelor’s degree.
The median household income sits at $59,500 per year,
above the U.S. median of $52,400. Housing prices are
relatively low compared with many other cities
nationwide, which has afforded 62 percent of
households homeownership.
This information has been secured from sources we believe to be reliable, but we make no representations or warranties, expressed or implied, as to the accuracy of
the information. References to square footage or age are approximate. Buyer must verify the information and bears all risk for any inaccuracies. Marcus &
Millichap is a service mark of Marcus & Millichap Real Estate Investment Services, Inc. © 2015 V0410211 Marcus & Millichap. All rights reserved.
21Renaissance Square
FORT WORTH, TX MARKET OVERVIEW
DALLAS-FORT WORTH
Quality Of Life
The Metroplex provides residents with an unparalleled
lifestyle at a reasonable cost. The region continually
ranks high for its affordability when compared with
other large metros.
A temperate climate provides ample opportunities for
sports enthusiasts to enjoy the outdoors. The region has
150 public and private golf courses, as well as several
reservoirs. Dallas/Fort Worth hosts professional teams
in baseball, football, hockey and basketball.
Dallas/Fort Worth is not only recognized for its sports
teams’ accomplishments, but also for its cultural
institutions. There are more than 150 museums and art
galleries including the internationally renowned Kimbell
Art Museum, Perot Science Museum and Modern Art
Museum of Fort Worth.
Metroplex residents are proximate to nationally
recognized health centers: Parkland Memorial Hospital,
Baylor University Medical Center and Texas Health
Harris Methodist Hospital Fort Worth. Four medical
schools also contribute to Dallas/Fort Worth’s excellent
healthcare providers.
The University of Texas at Dallas, Southern Methodist
University, Texas Christian University, and the
University of Texas at Arlington are among the many
institutions of higher learning located in the Metroplex.
The information contained in the market overview comes from sources deemed to be reliable, however, no representation, warranty or guarantee, express or
implied, may be made as to the accuracy or reliability of the information contained herein. The most timely data available at time of production, including
estimates and forecasts, were used and may be subject to revision.
This information has been secured from sources we believe to be reliable, but we make no representations or warranties, expressed or implied, as to the accuracy of
the information. References to square footage or age are approximate. Buyer must verify the information and bears all risk for any inaccuracies. Marcus &
Millichap is a service mark of Marcus & Millichap Real Estate Investment Services, Inc. © 2015 V0410211 Marcus & Millichap. All rights reserved.
22Renaissance Square
FORT WORTH, TX MARKET OVERVIEW
DALLAS
Tight Vacancy, Moderate Construction Elevate Metroplex
The Metroplex retail market appears poised for another strong performance in 2014. In addition to expectations
for outsized job creation and surging residential development, retail construction remains largely tenant driven and
will again fall well below levels recorded from 2007 to 2009. During the year, tightening conditions will provide
property owners more leverage in lease negotiations, and rents in select areas will edge closer to pre-recession peaks.
Asking rents in core central Dallas have already fully recovered, and the submarket stands to outperform once
again as new luxury multifamily projects continue to draw residents to the area. Trader Joe’s targeted the urban
core for its first Metroplex store, located in the Lower Greenville area, and has another in-town location underway
in Preston Hollow Village, a mixed-use project anchored by the niche grocer. In the suburbs, major discounters,
warehouse clubs and large grocery chains are driving retail development. Kroger recently opened a large store in
the Outlying East Dallas area and will build or remodel several additional locations over the next few years. Other
supermarket chains targeting Dallas/Fort Worth for expansion include Whole Foods, Sprouts and Aldi. H-E-B, on
the other hand, has reportedly purchased several Metroplex sites, though the San Antonio-based company has yet
to announce plans for entering the market.
Bright growth prospects this year will help narrow the gap between buyers’ and sellers’ price expectations, spurring
increased velocity. While in-place rents for many local properties remain above market levels, the impact on prices
should moderate as declining vacancy renews rent growth. Cap rates have slipped to between 7.0 and 8.0 percent
for anchored centers in core locations, while performing strips with national tenants trade from 7.5 to 8.5 percent.
Compressed yields have fueled demand for repositioning plays, particularly in Uptown and North Dallas, and in
submarkets proximate to emerging business hubs and new homes, such as Legacy, Mid-Cities, Richardson and the
I-35E and U.S. 75/George Bush corridors.
2014 Annual Retail Forecast
Employment: Dallas/Fort Worth payrolls will rise 3 percent in 2014 with the creation
of 95,000 jobs. The Metroplex added 72,700 new positions in 2013.
Construction: This year, 3 million square feet of new retail space will come online in
the Dallas/Fort Worth market. During 2013, developers delivered 2.8 million square
feet of space.
Vacancy: In 2014, strong retailer demand and still-restrained construction will drive
retail vacancy down 60 basis points to 7.3 percent. In 2013, the vacancy rate declined
70 basis points.
Rents: During 2014, tightening conditions will support a 2.6 percent increase in
asking rents, pushing the average to $14.00 per square foot. Asking rents grew 0.7
percent last year.
This information has been secured from sources we believe to be reliable, but we make no representations or warranties, expressed or implied, as to the accuracy of
the information. References to square footage or age are approximate. Buyer must verify the information and bears all risk for any inaccuracies. Marcus &
Millichap is a service mark of Marcus & Millichap Real Estate Investment Services, Inc. © 2015 V0410211 Marcus & Millichap. All rights reserved.
23Renaissance Square
FORT WORTH, TX MARKET OVERVIEW
DALLAS
Economy
■ Employment increased 3.1 percent over the past year as the metro’s economy generated 94,700 new jobs.
During the previous 12-month period, job growth in the market reached 2.4 percent.
■ Nearly all major employment sectors added jobs over the past year. The strongest gains were recorded in the
leisure and hospitality, trade, transportation and utilities, and professional and business services sectors.
■ Corporate relocations and expansions abound in the Metroplex. Recently announced relocations include
Toyota from California to Plano, Global Logistics from Denver to Irving, and California-based Channell
Corporation to Rockwall. In addition, American Eagle announced plans to build its headquarters in Irving,
while Raytheon decided on Richardson for a new campus.
■ Outlook: Dallas/Fort Worth payrolls will rise 3 percent in 2014 with the creation of 95,000 jobs. In 2013,
employers added 72,700 new positions.
Construction
■ Over the past four quarters, developers delivered 2.7 million square feet of new retail space to the Metroplex,
which is nearly equivalent to completions in the corresponding period last year.
■ In the first quarter, 645,000 square feet of retail space came online. The Outlying East Dallas submarket
accounted for the most sizable share. Within the area, Kroger opened a 125,000 square-foot store at Forney
Marketplace, which will feature additional 200,000 square feet of junior anchor space.
■ The number of planned retail projects in the Metroplex has increased dramatically in recent quarters, as
developers stake positions in the path of upcoming infrastructure improvements and new residential
developments. Several retail projects are planned for northern Dallas suburbs, the Mid-Cities area and north
Fort Worth communities.
■ Outlook: Three million square feet of retail space will come online this year, up moderately from 2.8 million
square feet in 2013.
* Forecast
Source: CoStar Group, Inc.
This information has been secured from sources we believe to be reliable, but we make no representations or warranties, expressed or implied, as to the accuracy of
the information. References to square footage or age are approximate. Buyer must verify the information and bears all risk for any inaccuracies. Marcus &
Millichap is a service mark of Marcus & Millichap Real Estate Investment Services, Inc. © 2015 V0410211 Marcus & Millichap. All rights reserved.
24Renaissance Square
FORT WORTH, TX MARKET OVERVIEW
DALLAS
Vacancy
■ Vacancy ended the first quarter at 7.9 percent, down 50 basis points from one year earlier, and 90 basis points
below the market’s pre-recession level.
■ Over the past 12 months, the Fort Worth area outperformed, with vacancy retreating 90 basis points to 7.4
percent. The most tightening was recorded in the Suburban Fort Worth and Mid-Cities submarkets, which
closed the first quarter with vacancy rates of 6.7 and 7.1 percent, respectively.
■ In the greater Dallas area, vacancy improved 30 basis points over the past year to 8.2 percent. By submarket,
tightening was most pronounced in the North Central Dallas and outlying Ellis County submarkets.
■ Outlook: In 2014, strong retailer demand and restrained construction, relative to 2007 to 2009, will drive
retail vacancy down 60 basis points to 7.3 percent. In 2013, the vacancy rate declined 70 basis points.
Rents
■ Asking rents in Dallas/Fort Worth averaged $13.83 per square foot in the first quarter, up 0.9 percent from 12
months earlier.
■ In the Dallas side of the market, rents advanced 1 percent over the past year to $14.52 per square foot. By
submarket, rents in Dallas range from $10.36 per square foot in the Southwest to $17.61 per square foot in
Central Dallas.
■ Submarket-level variations are less pronounced in the Fort Worth area. The most affordable space can be found
in the Central submarket, where asking rents average $10.34 per square foot. The Mid-Cities submarket claims
the high end of the spectrum with asking rents averaging $13.90 per square foot.
■ Outlook: Tightening conditions and the introduction of repositioned shopping centers will support a 2.6
percent uptick in asking rents this year, pushing the average to $14 per square foot. In 2013, rents grew 0.7
percent.
* Forecast
Source: CoStar Group, Inc.
This information has been secured from sources we believe to be reliable, but we make no representations or warranties, expressed or implied, as to the accuracy of
the information. References to square footage or age are approximate. Buyer must verify the information and bears all risk for any inaccuracies. Marcus &
Millichap is a service mark of Marcus & Millichap Real Estate Investment Services, Inc. © 2015 V0410211 Marcus & Millichap. All rights reserved.
25Renaissance Square
FORT WORTH, TX MARKET OVERVIEW
DALLAS
Single-Tenant Sales Trends**
■ Single-tenant transaction velocity accelerated roughly 10 percent over the past year. General freestanding assets
accounted for the most sizable share of sales, followed by fast-food and restaurant properties.
■ In many instances, cap rates for single-tenant properties have contracted to levels last seen in 2007 and 2008.
On average, single-tenant cap rates compressed to just under 7 percent over the past year.
■ Many investors in the Metroplex are shifting away from drugstores to focus on fast-food properties. This trend
appears to be tied to inflationary concerns, as Walgreens’ leases typically call for flat rents or negligible increases
over an extended term. Rents for fast-food properties, on the other hand, can average around 10 percent every
five years.
■ Outlook: Buyer demand remains strong for single-tenant properties, propping up prices and upholding cap
rates for top-tier assets. Location has become more integral to single-tenant investment decisions, though, and
in some cases could act as an offset to reduced lease term with regard to valuations.
Multi-Tenant Sales Trends**
■ Multi-tenant sales rose modestly over the past 12 months, and likely would have increased to a greater degree if
not for a shortage of available supply.
■ Multi-tenant prices increased by approximately 10 percent over the past 12 months to $215 per square foot.
During the same time period, the average cap rate declined to 7.7 percent.
■ Anchored centers in the market can trade at cap rates in the 7 to 8 percent range, while performing strip
centers with at least one or two national tenants often sell between 7.5 and 8.5 percent, depending on location.
■ Outlook: Tightening conditions and elevated values in the Metroplex should prompt more shopping center
owners to list this year. Among local investors, demand will remain particularly strong for value-add deals, such
as under-performing and/or aging assets in core locations and emerging submarkets.
** Trailing 12-Month Period
Sources: CoStar Group, Inc., Real Capital Analytics
This information has been secured from sources we believe to be reliable, but we make no representations or warranties, expressed or implied, as to the accuracy of
the information. References to square footage or age are approximate. Buyer must verify the information and bears all risk for any inaccuracies. Marcus &
Millichap is a service mark of Marcus & Millichap Real Estate Investment Services, Inc. © 2015 V0410211 Marcus & Millichap. All rights reserved.
26Renaissance Square
FORT WORTH, TX MARKET OVERVIEW
DALLAS
Capital Markets
■ The Fed continues to feel confident about the economic recovery and projects it will improve, notwithstanding
the disappointing growth in this year’s first quarter, which they believed to be impacted by the harsh winter
weather. The withdrawal of stimulus continues; at the end of April, the FOMC voted to reduce its monthly
bond purchases by an additional $10 billion. The yield on the 10-year U.S. Treasury remained in the mid- to
high-2 percent range throughout the first quarter, and is projected to stay in this range over the next few
months.
■ The national retail sector posted a solid performance in the first quarter this year. The vacancy rate ticked
down 20 basis points to 7.0 percent in the first three months of this year as total employment and retail
spending grew, generating new demand for retail space. Completions were also subdued, as only 6.9 million
square feet was brought online. This year, new demand will exceed completions and support a further drop in
the national vacancy rate.
■ Regional and local banks increased their share of lending on retail properties to 13 percent this year as they
escalated lending throughout 2013. Greater liquidity enhanced investors’ ability to obtain loans for the
purchase of small unanchored shopping centers. Across all lending institutions, the rising confidence in the
strengthening economy is generating an abundance of capital, which, in turn, is providing more leverage in
secondary and even tertiary markets.
Local Highlights
■ Raytheon recently announced plans to join State Farm at the CityLine development in Richardson.
Collectively, the companies will employ an estimated 9,700 workers in the area. CityLine’s first phase also
includes apartments, 90,000 square feet of dining and shop space, and a grocery-anchored center.
■ The North Central Dallas submarket stands to benefit from the opening of Nebraska Furniture Mart in The
Colony. In addition to a distribution facility, the development will also feature a 560,000 square-foot
showroom, which the company projects will draw 8 million visitors per year.
■ Vacancy in Far North Dallas remains above 10 percent. The submarket became oversupplied with retail in the
last cycle, but it appears positioned for near-term improvement amid resurgent home building in the area’s
affluent communities.
This information has been secured from sources we believe to be reliable, but we make no representations or warranties, expressed or implied, as to the accuracy of
the information. References to square footage or age are approximate. Buyer must verify the information and bears all risk for any inaccuracies. Marcus &
Millichap is a service mark of Marcus & Millichap Real Estate Investment Services, Inc. © 2015 V0410211 Marcus & Millichap. All rights reserved.
27DEMOGRAPHIC ANALYSIS
Renaissance Square
FORT WORTH, TXRenaissance Square
FORT WORTH, TX DEMOGRAPHIC ANALYSIS
DEMOGRAPHIC REPORT
1 Mile 3 Miles 5 Miles
2000 Population 10,492 91,611 220,895
2010 Population 11,039 93,711 223,925
2013 Population 11,413 97,297 232,946
2018 Population 11,511 96,850 233,453
2000 Households 3,053 28,170 73,300
2010 Households 3,123 28,134 73,516
2013 Households 3,235 29,332 76,902
2018 Households 3,314 29,757 78,470
2013 Average Household Size 3.45 3.19 2.92
2013 Daytime Population 1,045 30,652 154,196
2000 Median Housing Value $0 $56,000 $66,424
2000 Owner Occupied Housing Units 61.82% 56.41% 53.77%
2000 Renter Occupied Housing Units 30.93% 34.40% 37.42%
2000 Vacant 8.13% 10.56% 8.83%
2013 Owner Occupied Housing Units 59.22% 55.14% 55.25%
2013 Renter Occupied Housing Units 40.78% 44.86% 44.75%
2013 Vacant 9.39% 10.21% 9.73%
2018 Owner Occupied Housing Units 58.56% 54.64% 54.81%
2018 Renter Occupied Housing Units 41.44% 45.36% 45.19%
2018 Vacant 9.70% 10.11% 9.85%
$ 0 - $14,999 28.3% 27.9% 22.0%
$ 15,000 - $24,999 19.4% 19.8% 17.1%
$ 25,000 - $34,999 16.0% 15.3% 14.5%
$ 35,000 - $49,999 15.9% 15.1% 15.2%
$ 50,000 - $74,999 12.6% 12.5% 14.7%
$ 75,000 - $99,999 4.2% 4.9% 7.1%
$100,000 - $124,999 2.0% 2.4% 4.0%
$125,000 - $149,999 0.8% 0.8% 1.8%
$150,000 - $199,999 0.3% 0.6% 1.6%
$200,000 - $249,999 0.3% 0.3% 0.9%
$250,000 + 0.3% 0.4% 1.3%
2013 Median Household Income $26,225 $26,329 $32,467
2013 Per Capita Income $10,111 $11,402 $16,968
2013 Average Household Income $35,227 $36,570 $49,883
Demographic data © 2012 by Experian.
This information has been secured from sources we believe to be reliable, but we make no representations or warranties, expressed or implied, as to the accuracy of
the information. References to square footage or age are approximate. Buyer must verify the information and bears all risk for any inaccuracies. Marcus &
Millichap is a service mark of Marcus & Millichap Real Estate Investment Services, Inc. © 2015 V0410211 Marcus & Millichap. All rights reserved.
29Renaissance Square
FORT WORTH, TX DEMOGRAPHIC ANALYSIS
SUMMARY REPORT
Geography: 5 miles
Population
In 2013, the population in your selected geography was 232,946. The population has changed by 5.45% since 2000. It is estimated
that the population in your area will be 233,453 five years from now, which represents a change of 0.21% from the current year. The
current population is 50.2% male and 49.7% female. The median age of the population in your area is 30.7, compare this to the U.S.
average which is 37. The population density in your area is 3,254.80 people per square mile.
Households
There are currently 76,902 households in your selected geography. The number of households has changed by 4.91% since 2000. It
is estimated that the number of households in your area will be 78,470 five years from now, which represents a change of 2.03%
from the current year. The average household size in your area is 2.91 persons.
Income
In 2013, the median household income for your selected geography is $32,467, compare this to the U.S. average which is currently
$53,535. The median household income for your area has changed by -9.62% since 2000. It is estimated that the median household
income in your area will be $34,118 five years from now, which represents a change of 5.08% from the current year.
The current year per capita income in your area is $16,968, compare this to the U.S. average, which is $28,888. The current year
average household income in your area is $49,883, compare this to the U.S. average which is $75,373.
Race & Ethnicity
The current year racial makeup of your selected area is as follows: 48.10% White, 27.32% African American, 0.73% Native American
and 2.27% Asian/Pacific Islander. Compare these to U.S. averages which are: 72.20% White, 12.65% African American, 0.96%
Native American and 5.01% Asian/Pacific Islander.
People of Hispanic origin are counted independently of race. People of Hispanic origin make up 47.25% of the current year
population in your selected area. Compare this to the U.S. average of 16.55%.
Housing
The median housing value in your area was $66,424 in 2000, compare this to the U.S. average of $110,781 for the same year. In
2000, there were 43,230 owner occupied housing units in your area and there were 30,084 renter occupied housing units in your
area. The median rent at the time was $470.
Employment
In 2013, there are 154,196 employees in your selected area, this is also known as the daytime population. The 2000 Census revealed
that 56.1% of employees are employed in white-collar occupations in this geography, and 43.8% are employed in blue-collar
occupations. In 2013, unemployment in this area is 6.08%. In 2000, the median time traveled to work was 21.4 minutes.
Demographic data © 2012 by Experian.
This information has been secured from sources we believe to be reliable, but we make no representations or warranties, expressed or implied, as to the accuracy of
the information. References to square footage or age are approximate. Buyer must verify the information and bears all risk for any inaccuracies. Marcus &
Millichap is a service mark of Marcus & Millichap Real Estate Investment Services, Inc. © 2015 V0410211 Marcus & Millichap. All rights reserved.
30Renaissance Square
FORT WORTH, TX DEMOGRAPHIC ANALYSIS
POPULATION DENSITY
Demographic data © 2012 by Experian.
Number of people living in a given area per square mile.
This information has been secured from sources we believe to be reliable, but we make no representations or warranties, expressed or implied, as to the accuracy of
the information. References to square footage or age are approximate. Buyer must verify the information and bears all risk for any inaccuracies. Marcus &
Millichap is a service mark of Marcus & Millichap Real Estate Investment Services, Inc. © 2015 V0410211 Marcus & Millichap. All rights reserved.
31Renaissance Square
FORT WORTH, TX DEMOGRAPHIC ANALYSIS
EMPLOYMENT DENSITY
Demographic data © 2012 by Experian.
The number of people employed in a given area per square mile.
This information has been secured from sources we believe to be reliable, but we make no representations or warranties, expressed or implied, as to the accuracy of
the information. References to square footage or age are approximate. Buyer must verify the information and bears all risk for any inaccuracies. Marcus &
Millichap is a service mark of Marcus & Millichap Real Estate Investment Services, Inc. © 2015 V0410211 Marcus & Millichap. All rights reserved.
32Renaissance Square
FORT WORTH, TX DEMOGRAPHIC ANALYSIS
AVERAGE HOUSEHOLD INCOME
Demographic data © 2012 by Experian.
Average income of all the people 15 years and older occupying a
single housing unit.
This information has been secured from sources we believe to be reliable, but we make no representations or warranties, expressed or implied, as to the accuracy of
the information. References to square footage or age are approximate. Buyer must verify the information and bears all risk for any inaccuracies. Marcus &
Millichap is a service mark of Marcus & Millichap Real Estate Investment Services, Inc. © 2015 V0410211 Marcus & Millichap. All rights reserved.
33Renaissance Square
FORT WORTH, TX
OFFERING MEMORANDUM
Offices Throughout the U.S and Canada
www.MarcusMillichap.comYou can also read