Driving commerce and prosperity through our unique diversity - RSPO

Page created by Hazel Lyons
 
CONTINUE READING
Driving commerce and prosperity through our unique diversity - RSPO
Sustainability Summary 2017

Driving commerce and
prosperity through
our unique diversity
Driving commerce and prosperity through our unique diversity - RSPO
Standard Chartered
                Sustainability Summary 2017

                               Contributing to sustainable          Being a responsible
OVERVIEW                       economic growth                      company                          Investing in communities         Sustainability data     Carbon Trust assurance

Who we are
Standard Chartered is a leading international
banking group. Our heritage and values are
expressed in our brand promise, Here for good.
We operate in 63 markets worldwide, including some of
the world’s most dynamic. More than 80 per cent of our
income and profits are derived from Asia, Africa and the
Middle East. Our businesses serve four client segments
in four regions, supported by seven global functions.

                     Europe &                                                                                          Greater China
                     Americas                                                                                          & North Asia

                                                                         Africa &
                                                                         Middle East                                         ASEAN &
                                                                                                                             South Asia

 For more information about our sustainability performance, please visit sc.com
                                                                    ort
 Sustainability reporting is embedded throughout our 2017 Annual Report
 and Accounts. Visit sc.com/annualreport

          @StanChart

          linkedin.com/company/standard-chartered-bank

          facebook.com/standardchartered

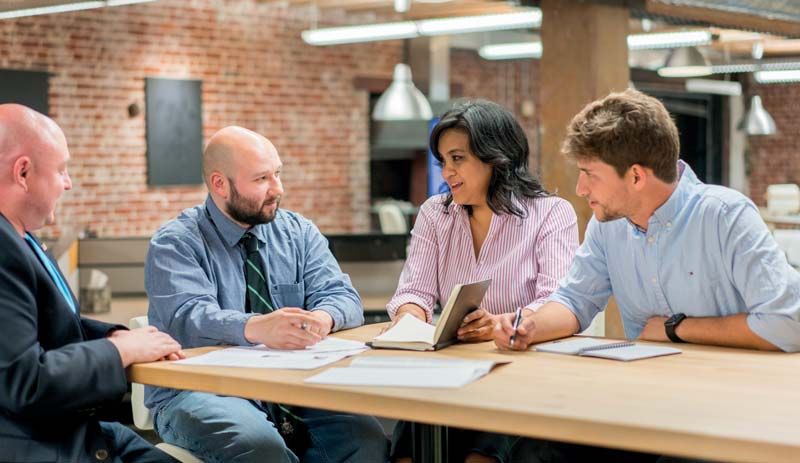
 Photo competition                                                                                $ in this document means US
                               Unless another currency is specified, the word ‘dollar’ or symbol ‘$’                            S dollar and the word ‘cent’
 Our aim was to make this      or symbol ‘c’ means one-hundredth of one US dollar.
 year’s cover as engaging      Unless the context requires, within this document, ‘China’ refers to the People’s Republic of China and, for the purposes of
 and diverse as possible.      this document only, excludes Hong Kong Special Administrative Region (Hong Kong), Macau Special Administration Region
 As part of this, we invited   (Macau) and Taiwan. ‘Korea’ or ‘South Korea’ refers to the Republic of Korea. Greater China & North Asia (GCNA) includes
 all colleagues to             China, Hong Kong, Japan, Korea, Macau and Taiwan; ASEAN & South Asia (ASA) includes Australia, Bangladesh, Brunei,
 participate in a photo        Cambodia, Laos, India, Indonesia, Malaysia, Myanmar, Nepal, Philippines, Singapore, Sri Lanka, Thailand and Vietnam; and
 competition. The top          Africa & Middle East (AME) includes Bahrain, Egypt, Iraq, Jordan, Lebanon, Oman, Pakistan, Qatar, Saudi Arabia and the
 three entrants can be         United Arab Emirates (UAE).
 found on the front and        Standard Chartered PLC is headquartered in London. The Group’s head office provides guidance on governance and
 back covers.                  regulatory standards. Standard Chartered PLC stock codes are: HKSE 02888; LSE STAN.LN; and BSE/NSE STAN.IN.
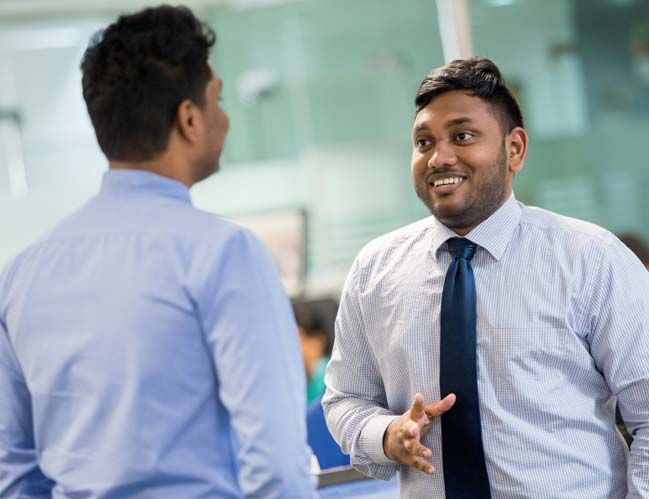
Driving commerce and prosperity through our unique diversity - RSPO
Standard Chartered
01         Sustainability Summary 2017

                                Contributing to sustainable
OVERVIEW                        economic growth                Being a responsible company      Investing in communities       Sustainability data

Embedding sustainability
across our business
                                                     As an international bank, we create real,              of economic opportunities for girls and women
                                                     positive change for people in the 63 dynamic           in our markets – the launch of a second
                                                     and diverse markets where we operate.                  Women in Technology incubator in Kenya,
                                                     We do this by working with our clients to              which follows the successful model we have
                                                     help them achieve their ambitions and by               established in New York, and our first Goal
                                                     supporting social and economic development             girls’ empowerment summit in South Africa.
                                                     in the communities where we live and work.             We furthered our commitment to Seeing is
                                                                                                            Believing raising $5.6 million and once
                                                     This approach comes to life through our
                                                                                                            again, our employees demonstrated their
                                                     sustainability pillars – contributing to sustainable
                                                                                                            passionate support for our community
                                                     economic growth, being a responsible
                                                                                                            programmes by providing more than 66,000
                                                     company and investing in communities –
                                                                                                            days of volunteering. Much of this was
                                                     and 11 Sustainability Aspirations, which set
                                                                                                            focused on financial education.
                                                     out actions and targets to ensure we live up
2017 Highlights                                      to our promises. These pillars and Aspirations         During 2018. we will be revising our Position
                                                     form the basis for this summary of our 2017            Statements and developing a deeper
We have achieved our 2017                            performance, which we publish alongside                understanding of the social and economic
targets around conduct, financial                     our 2017 Annual Report and Accounts.                   impact of our activities, including climate
crime prevention, people and                         Our Aspirations provide focus and
                                                                                                            change. This will start with the release of our
                                                                                                            East Africa Impact Report and, later in the
diversity. We are also on track                      momentum for our sustainability work, and
                                                                                                            year, we will share the outcomes of an impact
to deliver those Sustainability                      we have made good progress in their first
                                                                                                            assessment of our flagship community
                                                     year. As well as maximising opportunities
Aspirations with a longer time                       in our markets through the Aspirations,
                                                                                                            engagement programme, Seeing is Believing.
horizon. We have delivered                                                                                  We remain committed to delivering better,
                                                     we remained committed to managing
                                                                                                            more sustainable outcomes for our clients
our microfinance Aspiration                           environmental and social risks in line with
                                                                                                            and communities.
                                                     our Position Statements, which set out
three years ahead of schedule.
                                                     sector-specific standards that are regularly
Between 2016 and 2017, we                            reviewed and updated.
extended just over $1 billion                        Our long-standing relationships with NGOs
to microfinance institutions for                      and community partners, as well as the
onward lending to the smallest                       support of our employees, enabled us to                Vasuki Shastry
                                                     deliver our community engagement                       Global Head,
business owners, helping our                                                                                Public Affairs & Sustainability
                                                     programmes. Two major initiatives in 2017
clients transform the lives of                       demonstrated our support for the creation
thousands of people, and their
families, across our markets.
Although we have met this target
early, our commitment to support
microfinance will continue.

                                                            “We remain committed to delivering responsible,
                                                        sustainable banking. We’re honouring this commitment
                                                             through our three pillars and 11 Sustainability
                                                        Aspirations, alongside industry and global collaborations
                                                        including our participation in the UN Global Compact.”
                                                                                                    Bill Winters
                                                                                                Group Chief Executive
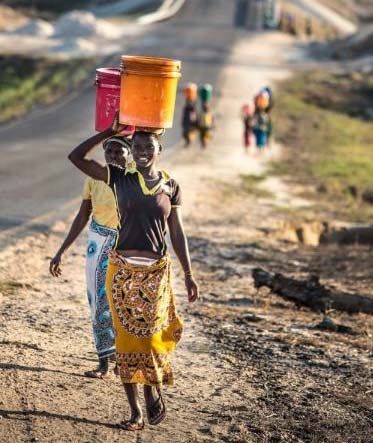
Driving commerce and prosperity through our unique diversity - RSPO
Standard Chartered
02     Sustainability Summary 2017

                              Contributing to sustainable
OVERVIEW                      economic growth               Being a responsible company    Investing in communities        Sustainability data

What we do

Client segments focused
on differentiated expertise

     Global
      Corporate & Institutional Banking                                     Private Banking
      Serving over 5,300 large corporations, governments, banks             Helping 7,000 high-net-worth individuals manage, preserve
      and investors.                                                        and grow their wealth.

      Operating income                                                      Operating income

      $6,496m $6,523m
      Underlying basis                  Statutory basis
                                                                            $500m
                                                                            Underlying basis
                                                                                                               $500m
                                                                                                               Statutory basis

     Regional
      Commercial Banking                                                    Retail Banking
      Supporting over 40,000 local corporations and medium-                 Serving over nine million individuals and small businesses.
      sized enterprises across Asia, Africa and the Middle East.

      Operating income                                                      Operating income

      $1,333m $1,329m
      Underlying basis                  Statutory basis
                                                                            $4,834m $4,903m
                                                                            Underlying basis                   Statutory basis

      Central & other items (segment)                                       Total operating income
      Operating income

      $1,126m
      Underlying basis
                                        $1,170m
                                        Statutory basis
                                                                            $14,289m $14,425m
                                                                            Underlying basis                    Statutory basis

      Global functions

      Our client-facing businesses are supported                      Human Resources              Legal                         IT & Operations
                                                                      Recruits and builds talent   Enables sustainable           Responsible for the
      by seven global functions, which work                           while providing learning     business and protects         Group’s operations,
      together to ensure the Group’s                                  and development              the Group from                systems development
      day-to-day operations run smoothly and                          opportunities to             legal-related risk            and technology
                                                                      motivate colleagues                                        infrastructure
      are compliant with banking regulations.
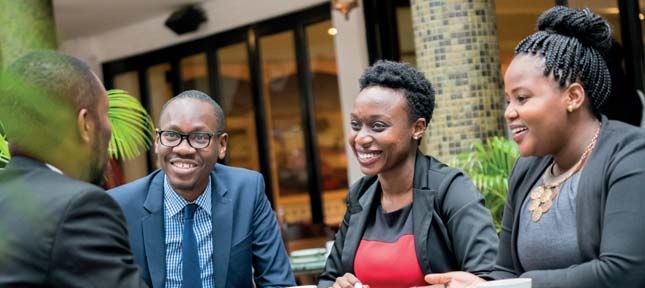
Driving commerce and prosperity through our unique diversity - RSPO
Standard Chartered
 03          Sustainability Summary 2017

                                  Contributing to sustainable
OVERVIEW                          economic growth                   Being a responsible company      Investing in communities      Sustainability data

Where we do it

Building a sustainable
business in dynamic economies

           Greater China & North Asia                                                  ASEAN & South Asia
           Serving clients in China, Hong Kong, Korea, Japan,                          Our largest markets in ASEAN & South Asia by income
           Taiwan and Macau. The Group’s largest region by income.                     are Singapore and India. We are active in all 10 ASEAN
                                                                                       countries.
           Operating income                                                            Operating income

           $5,616m $5,613m
           Underlying basis                 Statutory basis
                                                                                       $3,833m $3,870m
                                                                                       Underlying basis                  Statutory basis

           Africa & Middle East                                                        Europe & Americas
           Present in 25 markets, of which the most sizeable by                        Centred in London and New York with a presence across
           income are the UAE, Nigeria, Pakistan and Kenya.                            both continents. Key income originator for the Group.

           Operating income                                                            Operating income

           $2,764m $2,764m
           Underlying basis                 Statutory basis
                                                                                       $1,601m $1,596m
                                                                                       Underlying basis                  Statutory basis

         Central & other items (region)                                              Total operating income
         Operating income

         $475m
         Underlying basis
                                            $582m
                                            Statutory basis
                                                                                     $14,289m $14,425m
                                                                                     Underlying basis                     Statutory basis

Risk & Compliance                    Group COO                             Group CFO                            Corporate Affairs & Brand
Responsible for the                  Provides control and                  Incorporates seven support           and Marketing
sustainability of our business       governance to operating               functions: Finance, Treasury,        Manages the Group’s
through good management              platforms and processes,              Strategy, Investor Relations,        communications and engagement
of risk across the Group             ensuring operating efficiency          Corporate Development,               with stakeholders in order to
and ensuring that business                                                 Supply Chain and Property.           protect and promote the Group’s
is conducted in line with                                                  The leaders of these functions       reputation, brand and services
regulatory expectations                                                    report directly to Andy Halford,
                                                                           Group Chief Financial Officer
Driving commerce and prosperity through our unique diversity - RSPO
Standard Chartered
04     Sustainability Summary 2017

                                 Contributing to sustainable
OVERVIEW                         economic growth                Being a responsible company      Investing in communities      Sustainability data

Our approach
to sustainability
                                                      Our purpose as an international bank is to drive commerce and prosperity
                                                      through our unique diversity. We seek to ensure that the financial
             Contributing to
               sustainable                            services we provide to individuals, businesses and global institutions
            economic growth
                                                      improve livelihoods and provide new economic opportunities for
                                                      people in our markets.
                     Here
                                                      Our diverse, local network means we are a trusted partner for trade and development across
                   for good
                                                      our markets. We work closely with clients to address the issues that jeopardise sustainable
       Being a                                        economic growth, such as the infrastructure deficit, climate change and financial exclusion.
     responsible               Investing in
      company                 communities             Our relationships with governments and other development institutions help them access
                                                      financial markets, and we draw on our relationships with all stakeholders, including our
                                                      colleagues, to create prosperous communities through our community engagement
                                                      programmes around health and education. This is only possible if we remain committed
                                                      to operating responsibly, encouraging good conduct and ethical behaviour across
                                                      our organisation.
                                                      This is why our approach to sustainability focuses on three pillars – contributing to sustainable
                                                      economic growth, being a responsible company, and investing in communities. Within each
                                                      pillar, we have identified a number of Sustainability Aspirations, which set out measurable
                                                      actions to achieve sustainable business outcomes. Our Aspirations form part of our response
                                                      to the issues that matter to us and our stakeholders.

                                                      Understanding our sustainability themes
                                                      We regularly engage with a range of stakeholders to understand the sustainability themes
                                                      that matter to them, and that affect our business. During 2017, we undertook a desk-based
                                                      materiality review, supported by external specialists, which identified topics of importance
                                                      to both our business and our stakeholders. We share how we manage and measure progress
                                                      against these through policies and statements on sc.com, the Group’s 2017 Annual Report
                                                      and Accounts and this publication.
                                                      The table below sets out where stakeholders can find responses to the top five topics identified:

                                                      SUSTAINABILITY THEMES             RESPONSES
                                                      Climate change                    ¼     Climate Change Position Statement (sc.com/positionstatements)
                                                                                        ¼     Climate Change Aspiration (p7)
                                                                                        ¼     Principal Uncertainty in Risk & Capital Review (p181 of the
                                                                                              2017 Annual Report & Accounts)

                                                      Conduct, values                   ¼     Group Code of Conduct (sc.com/codeofconduct)
                                                      and ethics                        ¼     Conduct Aspiration (p9)
                                                                                        ¼     Stakeholders and responsibilities (p36-41 of the 2017
                                                                                              Annual Report and Accounts)

                                                      Environmental and                 ¼     Environmental & Social Risk Assessment (sc.com/esrisk)
                                                      social risk management            ¼     Standards and policies (sc.com/positionstatements)

                                                      Human rights                      ¼     2017 Modern Slavery Statement (sc.com/modernslavery)
                                                                                        ¼     Human Rights Position Statement (sc.com/positionstatements)
                                                                                        ¼     Stakeholders and responsibilities (p36-41 of the 2017
                                                                                              Annual Report and Accounts)

                                                      Talent attraction and             ¼     People Aspiration (p9)
                                                      engagement                        ¼     Stakeholders and responsibilities (p36-41 of the 2017
                                                                                              Annual Report and Accounts)
Driving commerce and prosperity through our unique diversity - RSPO
Standard Chartered
05         Sustainability Summary 2017

                                Contributing to sustainable
OVERVIEW                        economic growth               Being a responsible company   Investing in communities    Sustainability data

OUR APPROACH TO SUSTAINABILIT Y                                              We created our Sustainability Aspirations in 2016 after engaging
                                                                             with stakeholders and colleagues to understand the main
                                                                             sustainability issues and opportunities we face as a business.

Launching our                                                                The Aspirations set out measurable activities, and annual and
                                                                             multi-year targets, in the areas where we believe we can have
                                                                             the greatest impact.

Aspirations                                                                  We have taken steps to embed the Aspirations within Standard
                                                                             Chartered through a series of workshops with colleagues in
                                                                             Singapore, New York and Hong Kong, These were aimed at
                                                                             illustrating the connection between participants’ daily work for
                                                                             the Bank and our sustainability approach.
                                                                             Senior business leaders recognise the potential of the Aspirations
                                                                             to connect our core business with positive social and economic
                                                                             outcomes in our markets and guide our contribution to the
                                                                             United Nation’s Sustainable Development Goals.
                                                                             In 2017, we achieved the targets for annual Aspirations in conduct,
                                                                             people and financial crime compliance, and achieved our multi-year
                                                                             Aspiration for microfinance three years ahead of schedule. Our aim
                                                                             for 2018 is to maintain this momentum and continue to help
                                                                             colleagues understand how they contribute to our ability to have
                                                                             a positive impact as an organisation.
Driving commerce and prosperity through our unique diversity - RSPO
Standard Chartered
06         Sustainability Summary 2017

                                  CONTRIBUTING
                                  TO SUSTAINABLE
Overview                          ECONOMIC GROWTH        Being a responsible company   Investing in communities      Sustainability data

Contributing to
sustainable economic growth
                                               Objective
                 Contributing to
                   sustainable
                                               We use our core business of banking to promote sustainable
                economic growth                development in our markets.

                       Here
                                               Overview
                     for good                  We finance individuals, businesses and projects that contribute to sustainable economic
                                               growth in some of the world’s most dynamic and diverse markets. In 2017, we provided loans
                                               and advances of $262,859 million to customers across Corporate & Institutional, Commercial
                                               and Retail Banking.
                                               We work with clients to generate positive environmental and social impacts from our lending
                                               activities in sectors as varied as infrastructure and microfinance. This includes identifying and
                                               developing opportunities for blended finance solutions. In 2017, we funded and facilitated
                                               $1.2 billion towards clean technology and made $1 billion available to microfinance
                                               institutions for onward lending to entrepreneurs in 2016 and 2017, achieving our Aspiration
                                               three years early.
                                               Managing our impact includes minimising environmental and social risks, and in 2017, our
                                               Environmental and Social Risk Management team reviewed 487 transactions against our
                                               20 Position Statements, which set out best-practice environmental and social management
                                               standards. We updated our Position Statement on Palm Oil and started a similar review
                                               of all Position Statements, with updates due to be published in 2018.
                                               Our performance against the six Aspirations under this pillar is set out on the opposite page.

                 IMPACT AND SUSTAINABLE FINANCE                                 Working together with the Asian Development Bank (ADB),
                                                                                we help drive prosperity for people traditionally excluded
                 Developing                                                     from the financial system.
                                                                                We have extended a unique Risk Participation deal –
                 partnerships to deliver                                        the first of its type for the microfinance sector in Asia when
                                                                                it launched in 2013 – with the ADB to increase the flow
                 financial inclusion                                             of credit to microfinance institutions (MFIs) across Asia.
                                                                                By increasing the capital available, partner MFIs are able
                 Value of loans to MFIs in                                      to reach more unbanked individuals and finance additional
                 Bangladesh, Indonesia and India                                micro enterprises.
                                                                                Originally, we aimed to originate and service a $150 million

                 $325m                                                          portfolio of MFI loans across Asia by the end of 2018, with
                                                                                the ADB sharing 50 per cent of the risk on the portfolio.
                                                                                Due to the programme’s success, the ADB increased their
                                                                                risk participation ceiling from $75 million to $120 million,
                                                                                allowing us to increase the total programme size to
                                                                                $240 million outstanding at any given time. The programme
                                                                                has now been recognised as part of the ADB’s mainstream
                                                                                operations with no specified end date.
                                                                                Together with the ADB, we have provided approximately
                                                                                125 loans totalling $325 million to 13 MFIs in Bangladesh,
                                                                                Indonesia and India, with the potential to expand to
                                                                                additional markets in Asia.
Driving commerce and prosperity through our unique diversity - RSPO
Standard Chartered
 07          Sustainability Summary 2017

                                  CONTRIBUTING
                                  Contributing to sustainable
                                  TO SUSTAINABLE
Overview                          economic
                                  ECONOMIC  growth
                                               GROWTH                    Being a responsible company   Investing in communities        Sustainability data

                                           Target
Aspiration                                 We will work with our clients to:            Target date                        Progress
                                           ¼   Provide advisory, financing,              ¼   Jan 2017 – Dec 2019            Ongoing
Infrastructure                                 debt structuring services and                (infrastructure)
Everyone should have access to                                                                                             2017: $12.8 billion
                                               policy advice for $25 billion
safe, reliable and affordable power            of infrastructure projects,
and infrastructure which transforms            including $4 billion toward              ¼   Jan 2016 – Dec 2020            Ongoing
lives and strengthens economies                clean technology                             (clean technology)
                                                                                                                           2017: $1.2 billion
                                                                                                                           for clean technology
                                                                                                                           2016-2017: $2 billion
                                                                                                                           for clean technology

                                           ¼                                            ¼
Climate change                                 Introduce criteria to assess
                                               alignment to a 1.5 degree
                                                                                            May 2016 – Dec 2017            Partly achieved

Climate change is one of                                                                                                   We have developed criteria
                                               climate scenario for energy
today’s greatest challenges                                                                                                for assessing energy utilities
                                               sector clients and transactions
and addressing it is essential                                                                                             clients’ power generation assets
to promote sustainable                                                                                                     against a range of physical and
economic growth                                                                                                            transition risks, under multiple
                                                                                                                           climate scenarios and a range
                                                                                                                           of time horizons. The next step
                                                                                                                           is to introduce the criteria into
                                                                                                                           the business

                                           ¼   Expand climate assessment                ¼   Jan 2018 – Dec 2018            Ongoing
                                               criteria to other high-emitting
                                               sectors

                                           ¼                                            ¼
Entrepreneurs                                  Provide $6 billion to Business
                                               Banking clients
                                                                                            Jan 2017 – Dec 2019            Ongoing

Entrepreneurs are the heart of                                                                                             2017: $2.9 billion
local economies, creating jobs
and empowering people                      ¼   Grow our lending to smaller              ¼   Jan 2017 – Dec 2019            Ongoing
                                               business clients in our
                                                                                                                           2017: 17%
                                               Commercial Bank by 20%
                                                                                                                           (Jan 2017 baseline: $24.1 billion)
                                               as measured by assets

                                           ¼                                            ¼
Digital                                        Continue to provide ‘last mile’
                                               payments and collections to
                                                                                            Jan 2017 – Dec 2019            Ongoing

Everyone should have access to                                                                                             2017: 15 mobile wallets markets
                                               clients in our footprint though
digital banking products enabling                                                                                          – up from 12 in 2016
                                               our Straight2Bank wallet
safe, efficient and inclusive banking                                                                                       2017: 61% increase in average
                                                                                                                           mobile money transactions to
                                                                                                                           more than 70,000 per month

                                           ¼                                            ¼
Commerce                                       Bank 8,000 of our clients’
                                               international and domestic
                                                                                            Jan 2017 – Dec 2020            Ongoing

Trade creates jobs and contributes                                                                                         2017: 2,099 new clients
                                               networks of suppliers and
to economies by enabling people                buyers through banking the
to connect across borders                      ecosystem programmes.

                                           ¼   Provide $1 billion of financing           ¼   Jan 2016 – Dec 2020
Impact and                                     to microfinance institutions to
                                                                                                                           Achieved/Ongoing
sustainable                                    extend access to finance                                                     2017: $591 million
finance                                                                                                                     2016-2017: $1 billion
Innovative financial products and
partnerships can help us solve             ¼   Facilitate opportunities for             ¼   Jan 2016 – Dec 2020            Ongoing
global development challenges                  our Private Bank clients to
                                                                                                                           2017: 3 funds launched
and improve the lives of millions              invest in impact investing funds
in our markets                                 in our markets                                                              2016-2017: 3 funds launched

                                           ¼   Continue to promote blended              ¼   Jan 2016 – Dec 2020            Ongoing
                                               finance capabilities
                                                                                                                           (see case study on previous page)
Driving commerce and prosperity through our unique diversity - RSPO
Standard Chartered
08         Sustainability Summary 2017

                                  Contributing to sustainable   BEING A RESPONSIBLE
Overview                          economic growth               COMPANY                       Investing in communities      Sustainability data

Being a
responsible company
                                                       Objective

                                                       We manage our company responsibly by promoting the right values
                                                       and behaviours, investing in people, managing our environmental
                                                       impact and supporting the fight against financial crime.
                       Here
                     for good                          Overview
        Being a                                        We recognise that sound governance practices are a central element of responsible banking.
      responsible                                      We continued to encourage good conduct as a priority with 99.4 per cent of employees
       company
                                                       recommitting to the Group Code of Conduct in September 2017. We further enhanced our
                                                       approach to financial crime prevention by strengthening our policies and extending training
                                                       for employees on the front line of fighting financial crime.
                                                       Our diversity is a unique strength that helps us to deliver a positive impact on society. We work
                                                       hard to create a culture of inclusion where talent and individuality are valued and respected.
                                                       In 2017, we introduced a standard flexible working practice to ensure all colleagues can
                                                       choose how they work and increased the benefits we offer parents globally. Our new Fair Pay
                                                       Charter, agreed in 2017, sets out the principles which guide all of our reward and performance
                                                       decision-making. This includes continuing to reward colleagues in a way that is free from
                                                       discrimination on the basis of diversity, including gender. We supported more than 50
                                                       country-based employee networks and three global networks (Women, Disability and
                                                       LGBT & Allies), offering professional development, mentoring, networking and connections to
                                                       employees. We have set new targets under the People Aspiration to improve employee
                                                       wellness and implement a new diversity and inclusion strategy in 2018.
                                                       We aim to minimise the environmental impact of our operations, and between 2008 and 2017,
                                                       we reduced energy use by 34 per cent. In the same period, we reduced absolute water
                                                       consumption by 36 per cent and water use by property area by 45 per cent.
                                                       Our performance against the four Aspirations under this pillar is set out on the opposite page.

                                                                                FINANCIAL CRIME COMPLIANCE

                                                                                Working with NGOs to
                                                                                de-risk through education
                                                                                Our efforts to fight financial crime can have unintended
                                                                                consequences for clients that deliver critical humanitarian services
                                                                                to people in need. Financial crime controls can prevent payments
                                                                                to and from development and non-profit organisations, and
                                                                                non-governmental organisations (NGOs) providing humanitarian
                                                                                programmes in countries where bribery, corruption and money-
                                                                                laundering are prevalent.
                                                                                We are helping these clients to mitigate financial crime risk
                                                                                through education. In October, we hosted our first Financial
                                                                                Crime Risk Management workshop in Washington for
                                                                                US-headquartered clients. The workshop builds on our
                                                                                successful Correspondent Banking Academies, and was
                                                                                delivered in partnership with the World Bank Group, World Vision
                                                                                and the US NGO membership group InterAction.
                                                                                The event shared international best practices in financial crime
                                                                                compliance and showed organisations how they could strengthen
                                                                                their fraud, anti-money laundering and counter-terrorist financing
                                                                                controls. From 2018, we will also offer free financial crime
                                                                                compliance e-learning modules to our NGO clients.
Standard Chartered
 09          Sustainability Summary 2017

                                  Contributing to sustainable          BEING A RESPONSIBLE
Overview                          economic growth                      Being a responsible company
                                                                       COMPANY                       Investing in communities       Sustainability data

                                           Target
Aspiration                                 We will:                                   Target date                        Progress
                                           ¼   Increase gender representation:        ¼   Jan 2013 – Dec 2017
People                                         25% women at Board level
                                                                                                                         Achieved
                                                                                      ¼   Sept 2016 – Dec 2020
Our people are our greatest                                                                                              2017: 31% at Board level
                                           ¼   30% women in senior roles
asset, and our diversity drives                (bands 1-4)                                                               Ongoing
our business success
                                                                                                                         2017: 26% in senior roles

                                           ¼   Apply a flexible working                ¼   Sept 2016 – Dec 2017           Achieved
                                               policy globally
                                           ¼   Increase the minimum paid              ¼   Sept 2016 – Dec 2017           Achieved
                                               parental leave across all of our
                                               markets to 20 weeks for the
                                               primary care giver and two
                                               weeks for the spouse or
                                               civil partner
                                           ¼   New target for 2018: Roll-out          ¼   Jan 2018 – Dec 2018
                                               a comprehensive employee
                                               wellness programme across
                                               four key markets (UK, US,
                                               Singapore and Hong Kong)
                                           ¼   New target for 2018: Roll-out          ¼   Jan 2018 – Dec 2018
                                               a refreshed diversity and
                                               inclusion strategy Bank-wide
                                           ¼   Reduce annual energy use by            ¼   Jan 2008 – Dec 2019            Ongoing
Environment                                    35% to 230 kWh/m2/year in
Reducing our own impact on                                                                                               2008-2017: 28% reduction
                                               our tropical climate locations
the environment will protect                   (80% of portfolio)
our planet for the benefit of               ¼                                          ¼
                                               Reduce annual energy use                   Jan 2008 – Dec 2019            Ongoing
our communities
                                               by 31% to 275 kWh/m2/year in
                                                                                                                         2008-2017: 30% reduction
                                               our temperate climate locations
                                               (20% of portfolio)
                                           ¼   Reduce our annual water use            ¼   Jan 2008 – Dec 2019            Ongoing
                                               by 72% to 0.5kL/m2/year
                                                                                                                         2008-2017: 45% reduction

                                           ¼   Reduce annual office paper              ¼   Jan 2012 – Dec 2020            Ongoing
                                               use by 57% to 10kg/FTE/year
                                                                                                                         2012-2017: 6% reduction

                                           ¼                                          ¼
Conduct                                        Implement a conduct
                                               management framework that
                                                                                          Jan 2017 – Dec 2017            Achieved

Good conduct and high ethical                                                                                            99.4% of employees
                                               ensures that all staff are able
standards are essential in                                                                                               reconfirmed commitment
                                               to identify, control and govern
achieving fair outcomes for                                                                                              to the Code of Conduct
                                               conduct-related risk
our clients
                                           ¼   New target for 2018:                   ¼   Jan 2018 – Dec 2018
                                               Effectively embed the conduct
                                               management framework so
                                               that all staff are able to identify,
                                               mitigate and manage
                                               conduct risk
                                           ¼   All eligible bank staff to complete    ¼   Ongoing                        Ongoing
Financial crime                                relevant ABC, AML and
compliance                                     sanctions training with less
                                                                                                                         99.3% of employees
                                                                                                                         completed ABC training
Financial crime has serious                    than 2% overdue
social and economic                                                                                                      99.2% of employees
consequences, harming                                                                                                    completed AML training
individuals and communities                                                                                              99.6% of employees
                                                                                                                         completed sanctions training

                                           ¼   Deliver at least                       ¼   Jan 2017 – Dec 2017            Achieved
                                               10 correspondent
                                                                                                                         18 correspondent banking
                                               banking academies
                                                                                                                         academies delivered

                                           ¼   New target for 2018:                   ¼   Jan 2018 – Dec 2018
                                               Deliver at least
                                               10 correspondent
                                               banking academies
Standard Chartered
10         Sustainability Summary 2017

                                   Contributing to sustainable                                  INVESTING IN
Overview                           economic growth                Being a responsible company   COMMUNITIES                    Sustainability data

Investing
in communities
                                                         Objective

                                                         We seek to promote sustainable economic and social development
                                                         in our communities.

                       Here
                                                         Overview
                     for good                            Health and education are the foundation of social and economic development. We work
                                                         with local partners to deliver programmes that improve people’s health and educational
                                 Investing in            opportunities. In 2017, we invested $49.8 million in our communities and our employees
                                communities              contributed more than 66,000 volunteering days.
                                                         Seeing is Believing, our flagship global programme to treat avoidable blindness and visual
                                                         impairment, raised $5.6 million in 2017 through fundraising and matching by the Group.
                                                         Between 2003 and 2017, Seeing is Believing raised $98.4 million and reached 163.5 million
                                                         people through medical intervention, screening, training and education.
                                                         Goal, our programme to empower girls and young women through sports and life skills
                                                         training, reflects our belief that education is the foundation for economic opportunity. Goal
                                                         reached more than 95,000 girls in 2017, and more than 381,000 between 2006 and 2017.
                                                         Through our financial education programmes, we trained more than 117,000 young people
                                                         and just over 1,500 entrepreneurs, of which 90 per cent were women in 2017. We have
                                                         achieved our financial education target a year early with more than 5,500 micro and small
                                                         businesses educated between 2013 and 2017, of which 56 per cent are women-owned or led.
                                                         Our performance against the Aspiration under this pillar is set out on the opposite page.

                COMMUNIT Y ENGAGEMENT                                             Eleven-year-old Safira lives in Indonesia with her parents, and
                                                                                  dreams of becoming a doctor. This dream was threatened when
                Supporting child                                                  cataracts started to affect her ability to participate in school.
                                                                                  Access to treatment funded by Seeing is Believing (SiB) restored
                eye health projects                                               Safira’s eyesight, and she now takes part in her lessons, rides
                                                                                  her bike and plays with her friends.
                through Seeing                                                    Safira is one of thousands of children who has benefitted from
                                                                                  SiB’s focus on child eye health in 2017. An estimated 19 million
                is Believing                                                      children worldwide are visually impaired, and of these, 12 million
                                                                                  are simply suffering from refractive error and require a pair of
                                                                                  spectacles to correct their sight. SiB has committed 25 per cent
                                                                                  of its $100 million fundraising target to treat childhood blindness
                                                                                  and visual impairment.
                                                                                  In 2017, SiB supported child eye health projects in Kenya,
                                                                                  Uganda, Tanzania, Nigeria, China and Indonesia, and a project
                                                                                  to reduce blindness caused by retinopathy of prematurity in India,
                                                                                  in conjunction with the Queen Elizabeth Diamond Jubilee Trust.

                                                                                  Donations from the Bank’s annual One Hour campaign, where
                                                                                  employees donate one hour of their salary to SiB programmes,
                           Experts
                           Exp
                           Ex
                           E x pe
                             xp ert
                                errrtts bought
                                        bou
                                         oug
                                         ought
                                          ug ht together
                                                tog
                                                to
                                                tog
                                                 ogeettth
                                                    eth heerr
                                                                                  were also earmarked for child eye health projects in 2017.
                                                                                  This year, employees raised $347,000 as part of the campaign.

                           130
Standard Chartered
  11         Sustainability Summary 2017

                                  Contributing to sustainable                                     INVESTING IN
Overview                          economic growth                   Being a responsible company   Investing in communities
                                                                                                  COMMUNITIES                    Sustainability data

                                           Target
Aspiration                                 We will:                                Target date                        Progress in 2017
                                           ¼   Invest 0.75% of prior year          ¼   Jan 2006 – Dec 2020            Ongoing
Community                                      operating profit (PYOP) in
engagement                                     our communities
                                                                                                                      2017: $49.8 million community
                                                                                                                      expenditure, which represents
Health and education                                                                                                  12.18% of PYOP
are vital for thriving and
prosperous communities                     ¼   Raise $100m to tackle               ¼   Jan 2003 – Dec 2020            Ongoing
                                               avoidable blindness
                                                                                                                      2017: $5.6 million raised and
                                                                                                                      matched by the Group
                                                                                                                      2003-2017: $98.4 million raised
                                                                                                                      and matched by the Group

                                           ¼   Empower 600,000 girls               ¼   Jan 2006 – Dec 2020*           Ongoing
                                               through education and sport
                                                                                                                      2017: 95,837 girls
                                                                                                                      participated in Goal
                                                                                                                      2006-2017: 381,789 girls
                                                                                                                      participated in Goal

                                           ¼   Educate 5,000 micro and             ¼   Jan 2013 – Dec 2018            Achieved/Ongoing
                                               small businesses, with 20%
                                               women-owned or led                                                     2017: 1,560 micro and
                                                                                                                      small businesses –
                                                                                                                      90% women-owned or led
                                                                                                                      2013-2017: 5,557 micro
                                                                                                                      and small businesses –
                                                                                                                      56% women-owned or led

* Extended from 2018 to 2020.

                 COMMUNIT Y ENGAGEMENT                                             Thirteen-year-old Potlotkwa grew up in a squatters’ camp in
                                                                                   South Africa where she was often hungry, frustrated and bullied.
                 Building partnerships                                             Despite going to school, she lacked the knowledge, skills and
                                                                                   positive role models to create a more positive future for herself
                 to empower girls and                                              and her family.

                 young women                                                       After shyly watching from the sidelines, Potlokwa joined our Goal
                                                                                   girls’ empowerment programme, gaining valuable life skills that
                                                                                   have enabled her to blossom into a confident young woman.
                                                                                   She shared her experiences, and her dreams of becoming a
                                                                                   doctor in her local community, at our first Beyond Girls’ Education
                                                                                   Summit in South Africa in 2017.
                                                                                   The summit looked at ways to help girls and young women
                                                                                   move from education to employment. More than 130 experts
                                                                                   from the public, private and not-for-profit sectors joined Goal girls
                                                                                   like Potlokwa from Asia, Africa and the Middle East to create
                                                                                   new partnerships to increase the employability of girls and young
                                                                                   women. Delegates also experienced first-hand how play-based
                                                                                   activities can enable dialogue about rights, financial education
                                                                                   and conflict resolution by taking part in a Goal session.

                                                                                   More than 45 new commitments came out of the event.
                                                                                   One example is a partnership with global charity Lensational,
                                                                                   which is training Goal girls and young women in Kenya, Uganda
                                                                                   and the UK in professional photography to increase their
                                                                                   employability and income generation opportunities.
Standard Chartered
12           Sustainability Summary 2017

                                        Contributing to sustainable
 Overview                               economic growth                      Being a responsible company           Investing in communities              SUSTAINABILIT Y DATA

Sustainability data

Contributing to sustainable economic growth
Microfinance
                                                                                                                                           2017                  2016                     2015
Loans extended ($million)                                                                                                                591.4                 409.9                 271.6

Clean technology
                                                                                                                                           2017                  2016                 20151
Value of funds provided and facilitated ($million)                                                                                       1,228                 800.8                 968.0

Employees trained in environmental and social risk management (ESRM)
                                                                                                                                           2017                  2016                     2015
                       1
Employees trained                                                                                                                          568                    118                1,708

1. Employees targeted for training are those in client-facing roles and relevant support teams. A new policy framework, launched in 2014, required a significant level of training to be
   delivered in 2015 and thus a one-off increase in training attendance

ESRM clients and transactions
                                                                                                                                                                 2017                     2016
ESRM clients and transactions reviewed                                                                                                                           487                      328

Transactions reviewed by sector
                                                                                                                                                             2017 (%)              2016 (%)
Chemicals & Manufacturing                                                                                                                                        17.9                      28
Infrastructure & Transport                                                                                                                                       11.7                     16.5
Oil & Gas                                                                                                                                                         9.2                     12.5
Mining and Metals                                                                                                                                                11.9                      8.8
Fossil Fuel Power                                                                                                                                                14.8                     13.1
Forestry                                                                                                                                                          0.0                      0.6
Palm Oil                                                                                                                                                          1.2                      3.7
Agribusiness                                                                                                                                                      9.0                      4.6
Ship Breaking                                                                                                                                                     0.2                      0.9
Nuclear Energy                                                                                                                                                    1.0                      0.3
Renewables                                                                                                                                                        1.9                      1.8
Dams & Hydropower                                                                                                                                                 1.4                      1.2
Other                                                                                                                                                            19.3                      6.7
Tobacco                                                                                                                                                           0.4                      1.2
Standard Chartered
     13          Sustainability Summary 2017

                                          Contributing to sustainable
 Overview                                 economic growth                        Being a responsible company     Investing in communities              Sustainability data
                                                                                                                                                       SUSTAINABILIT     Y DATA

Equator Principles
                                                                                                                                                                         Project advisory
                                                        Project finance mandates                                      Project-related corporate loans                           mandates
                                                  Cat A1                Cat B2              Cat C3                 Cat A                Cat B                 Cat C
Total 2015                                             4                     9                   –                     –                    1                     –                    –
Total 2016                                             7                     6                   –                     –                    –                     –                    2
Total 2017                                             1                   11                    1                     1                    2                     –                    1

2017
Sector
     Mining                                            –                     1                   –                     –                    –                     –                    –
     Infrastructure                                    1                     3                   1                     –                    1                     –                    –
     Oil & Gas                                         –                     3                   –                     1                    –                     –                    1
     Renewables                                        –                     –                   –                     –                    –                     –                    –
     Telecoms                                          –                     –                   –                     –                    –                     –                    –
     Power                                             –                     2                   –                     –                    1                     –                    –
     Other                                             –                     2                   –                     –                    –                     –                    –
Region
     Greater China                                     –                     –                   1                     –                    1                     –                    –
     North East Asia                                   –                     –                   –                     –                    –                     –                    –
     South Asia                                        –                     2                   –                     –                    –                     –                    –
     ASEAN                                             –                     –                   –                     –                    –                     –                    –
     MENAP                                             –                     7                   –                     1                    –                     –                    1
     Africa                                            1                     2                   –                     –                    –                     –                    –
     Americas                                          –                     –                   –                     –                    1                     –                    –
     Europe                                            –                     –                   –                     –                    –                     –                    –
Designation4
     Designated                                        –                     –                   –                     –                    1                     –                    –
     Non-Designated                                    1                   11                    1                     1                    1                     –                    –
Independent Review
     Yes                                               1                   11                    1                     1                    2                     –                    –
     No                                                –                     –                   –                     –                    –                     –                    –

1. ’Cat A’ or Category A are projects with potential significant adverse environmental and social risks and/or impacts that are diverse, irreversible or unprecedented
2. ’Cat B’ or Category B are projects with potential limited adverse environmental and social risks and/or impacts that are few in number, generally site-specific, largely reversible and
   readily addressed through mitigation measures
3. ’Cat C’ or Category C are projects with minimal or no adverse environmental and social risks and/or impacts
4. ’Designation’ is split into designated and non-designated countries. Designated countries are deemed by the Equator Principles to have robust environmental and social governance,
   legislation systems and institutional capacity designed to protect their people and the natural environment. Non-designated countries are countries that are not found on the list of
   designated countries. The list of countries can be found at www.equator-principles.com

Investing in communities
Community expenditure
                                                                                                                                       2017                  20163                 2015
                                                                                                                                     $million               $million             $million
Cash contributions                                                                                                                      22.1                  21.3                 24.5
Employee time (non-cash item)                                                                                                            18.1                 17.3                 20.0
Gifts In Kind (non-cash item)1                                                                                                            0.1                     –                  0.1
Management costs                                                                                                                          4.5                   4.7                  5.5
Total (direct investment by the Group)                                                                                                  44.8                  43.3                  50.1

Leverage2                                                                                                                                 5.0                  9.6                 10.2
Total (incl. leverage)                                                                                                                  49.8                  52.9                 60.3
Percentage of prior year operating profit (PYOP)4                                                                                       12.18                      –                 1.42

1    Gifts In Kind comprises all non-monetary donations
2    Leverage data relates to the proceeds from staff and other fundraising activity
3.   Figures for 2016 are restated to include additional contributions
4.   PYOP for 2016 was not meaningful based on 2015 operating profit
Standard Chartered
14         Sustainability Summary 2017

                                  Contributing to sustainable
Overview                          economic growth               Being a responsible company   Investing in communities   SUSTAINABILIT Y DATA

Being a responsible company
People
Global1                                                                                                           2017        2016        % change
Full-time employees (FTE)                                                                                      85,931      86,580               -0.7
Headcount (year end)                                                                                           86,021      86,693               -0.8
  Employed workers                                                                                             82,838       82,381               0.6
  Fixed-term workers                                                                                             3,183       4,312          -26.2
  Non-employed workers                                                                                         15,043       14,834               1.4
Headcount (12-month average)                                                                                   86,794       84,916               2.2

Male
  FTE                                                                                                          46,634      46,468                0.4
  Headcount                                                                                                    46,658      46,502                0.3
Female
  FTE                                                                                                          39,297       40,112              -2.0
  Headcount                                                                                                    39,363       40,191              -2.1

Nationalities                                                                                                      125        130               -3.8

Position type                                                                                                     2017        2016        % change
Executive and non-executive director                                                                                13          13               0.0
Female executive and non-executive director                                                                          4           3              33.3

Senior management (Bands 1-2)                                                                                     255         239                6.7
Female senior management                                                                                            43         33               30.3

Middle management (Bands 3-4)                                                                                   3,635        3,655              -0.5
Female middle management                                                                                          956         959               -0.3

Employment type                                                                                                   2017        2016        % change
Business FTE                                                                                                   40,594       42,833              -5.2
Business headcount                                                                                             40,636       42,888              -5.3
Business female headcount                                                                                      20,219       21,434              -5.7

Support services FTE                                                                                           45,337       43,747               3.6
Support services headcount                                                                                     45,385      43,805                3.6
Female support services headcount                                                                              19,144       18,757               2.1

Regional                                                                                                          2017        2016        % change
Greater China & North Asia FTE                                                                                 20,428      20,935               -2.4
Greater China & North Asia headcount                                                                           20,451       20,957              -2.4
Greater China & North Asia female headcount                                                                    12,894       13,224              -2.5

ASEAN & Southeast Asia FTE                                                                                     47,794       47,378               0.9
ASEAN & Southeast Asia headcount                                                                               47,814       47,412               0.8
ASEAN & Southeast Asia female headcount                                                                        18,981       19,326              -1.8

Africa & Middle East FTE                                                                                       13,928       14,620              -4.7
Africa & Middle East headcount                                                                                 13,941       14,645              -4.8
Africa & Middle East female headcount                                                                           5,831        6,026              -3.2

Europe & Americas FTE                                                                                           3,782        3,647               3.7
Europe & Americas headcount                                                                                     3,815        3,679               3.7
Europe & Americas female headcount                                                                              1,657        1,615               2.6
Standard Chartered
 15          Sustainability Summary 2017

                                    Contributing to sustainable
Overview                            economic growth                   Being a responsible company      Investing in communities   Sustainability data
                                                                                                                                  SUSTAINABILIT     Y DATA

Age                                                                                                                        2017         2016          % change
< 30 years FTE                                                                                                          22,890        24,749                 -7.5
< 30 years headcount                                                                                                    22,898       24,763                  -7.5
< 30 years female headcount                                                                                             11,856       12,802                  -7.4

30-50 years FTE                                                                                                         57,639       56,743                   1.6
30-50 years headcount                                                                                                   57,696       56,816                   1.5
30-50 years female headcount                                                                                            25,128        25,129                 0.0

> 50 years FTE                                                                                                           5,402        5,087                  6.2
> 50 years headcount                                                                                                     5,427         5,114                  6.1
> 50 years female headcount                                                                                              2,379        2,260                  5.3

Talent management                                                                                                          2017         2016          % change
Global voluntary turnover rate %                                                                                           13.0         14.4                 -1.4
Global turnover rate %                                                                                                     17.3         19.1                 -1.8

  Male %                                                                                                                   16.9         19.8                 -2.8
  Female %                                                                                                                 17.6         18.5                 -0.9

  Greater China & North Asia %                                                                                             18.2         20.5                 -2.3
  ASEAN & South Asia %                                                                                                     17.7         19.8                 -2.1
  Africa & Middle East %                                                                                                   14.9         16.1                 -1.2
  Europe & Americas %                                                                                                      15.2         15.8                 -0.6

< 30 years %                                                                                                               24.2         26.6                 -2.4
30-50 years %                                                                                                              14.4         16.1                 -1.6
> 50 years %                                                                                                               16.7         17.9                 -1.2

Average tenure – male (years)                                                                                               6.2          5.9                 3.5
Average tenure – female (years)                                                                                             6.5          6.3                 3.4

Roles filled internally %                                                                                                   37.5         31.2                 6.3
  of which filled by females %                                                                                              44.5         44.7                 -0.2

Employees with completed performance appraisal2 %                                                                          99.9         99.4                 0.5
Absenteeism rate3 %                                                                                                        46.2         43.4                 2.8

Learning                                                                                                                   2017         2016          % change
Employees receiving training %                                                                                             95.7         95.0                 0.7
Employees receiving training (excluding mandatory learning) %                                                              89.2         83.9                 5.3
  Female %                                                                                                                 96.3         95.4                 0.9
  Senior management %                                                                                                      92.6         92.5                  0.1
  Middle management %                                                                                                      97.2         96.4                 0.8

Average number of training days per employee (including mandatory learning)                                                3.17         3.50                 -9.4
Average cost of training per employee                                                                                      640          677                  -5.5

1 For all metrics expressed as a percentage, percentage change means percentage point change
2 Employees with completed performance appraisal numbers are based on 30 September 2017 eligible population
3 Absenteeism rate excludes Korea
Standard Chartered
16          Sustainability Summary 2017

                                     Contributing to sustainable
 Overview                            economic growth                    Being a responsible company        Investing in communities            SUSTAINABILIT Y DATA

Environment
In 2017, our measured Scope 1 and Scope 2 emissions were assured by The Carbon Trust, our independent third-party assurance
provider for greenhouse gas (GHG) emissions, ensuring the accuracy and credibility of our reporting.
     Review the methodology used to measure and assess our environmental performance data at sc.com/environmentcriteria
     Download the independent assurance report for 2010 performance at sc.com/environmentalassurance

                                                                                                                  2017                        2016                         2015
                                                                                              Measured Scaled Up            Measured     Scaled Up       Measured    Scaled Up
Offices reporting                                                                                   188         –                189         –               190         –
Net internal area of occupied property (m2)                                                    814,886 1,194,363            840,510 1,237,043           846,480 1,261,320
Green lease clause inclusion1 (%)                                                                   76         –                 71         –                67         –
Occupied net internal area where data is collected (%)                                              85         –                 72         –                73         –
Full-time employees (FTE) covered by reporting                                                  64,648    86,021             58,699    86,693            58,528    84,076
Annual operating income from 1 October to 30 September ($m)                                          –    14,614                  –    12,515                 –    17,566
Greenhouse gas emissions – Absolute (tonnes CO2eq/year)
Scope 1 emissions (combustion of fuels)                                                          5,870         7,922          6,312        13,562          8,865       16,904
Scope 2 emissions (purchased electricity)                                                      113,908       180,014        136,570      186,553         132,030      184,912
Scope 1 & 2 emissions                                                                          119,777       187,936        142,882      200,115         140,895      201,816
Scope 3 emissions without distance uplift (air travel)                                          59,179        59,179         49,393        52,056         54,519       54,519
Scope 3 emissions with distance uplift (air travel)                                             64,505        64,505         53,839        56,741         59,426       59,426
Scope 1, 2 & 3 emissions                                                                       178,956       247,115        192,275       252,171        195,414      256,335
Scope 3 emissions (Global Data Centre)2                                                              –        23,904              –        22,653              –       19,339
Greenhouse gas emissions – Intensity
Scope 1 & 2 emissions/m2 (kg CO2eq/m2/year)                                                          147          157             170         162             166          160
Scope 1 & 2 emissions/FTE (tonnes CO2eq/FTE/year)                                                   1.85         2.18            2.43        2.31            2.41         2.40
Scope 3 emissions/FTE without distance uplift (tonnes CO2eq/FTE/year)                               0.69         0.69            0.57        0.60            0.64         0.65
Scope 3 emissions/FTE with distance uplift (tonnes CO2eq/FTE/year)                                  0.75         0.75            0.62        0.65            0.69         0.71
Scope 1, 2 & 3 emissions/m2 (kg CO2eq/m2/year)                                                      220           207            229         204              231         203
Scope 1, 2 & 3 emissions/FTE (tonnes CO2eq/FTE/year)                                                2.77         2.87            3.28        2.91            3.34         3.05
Scope 1 & 2 emissions/$m operating income (tonnes CO2eq/$m/year)                                       –        12.86               –       15.99               –        11.49
Scope 1, 2 & 3 emissions/$m operating income (tonnes CO2eq/$m/year)                                    –        16.91               –       20.15               –        14.59
Environmental resource efficiency
Energy
  Indirect non-renewable energy consumption3 (GWh/year)                                             168           277            185          245            201           284
  Indirect renewable energy consumption4 (GWh/year)                                                  21            19             23           20             14            13
  Direct non-renewable energy consumption5 (GWh/year)                                                24            32             26           47             36            68
  Direct renewable energy consumption6 (GWh/year)                                                     –             –              –            –              –             –
  On-site renewable energy consumption7 (MWh/year)                                                  330           330            247          247            276           276
  Energy consumption (GWh/year)                                                                     213           327            234          312            252           365
  Energy consumption/FTE (kWh/FTE/year)                                                           3,291         3,807          3,986        3,599          4,306         4,341
  Energy consumption/m2 (kWh/m2/year)                                                               261           274            278          252            298           289
Water
  Water consumption (ML/year)                                                                        649        1,149             917        1,181           793         1,037
  Water consumption/FTE (m3/FTE/year)                                                                 10           13              16           14             14           12
  Water consumption/m2 (kL/m2/year)                                                                 0.80         0.96            1.09         0.95           0.94         0.82
Paper8
  Print paper consumption (ktonnes/year)                                                            1.62         1.89               –             –              –            –
  Print paper consumption/FTE (kg/FTE/year)                                                        21.97            –               –             –              –            –
Waste9
  Waste (ktonnes/year)                                                                               4.8             –              5             –            5.2            –
  Waste/FTE (kg/FTE/year)                                                                             74             –             85             –             89            –
  Waste reused or recycled (%)                                                                        24             –             38             –             27            –
  Retired IT equipment reused or recycled (ktonnes/year)                                            0.19             –           0.15             –           0.19            –
1. Percentage of green lease clause inclusion in all new and renewed leases within the reporting year. Refer to the eco-efficiency criteria for more information
2. Scope 3 emissions calculated from total energy consumption from our outsourced global data centres
3. Indirect non-renewable energy refers to purchased electricity from non-renewable sources
4. Indirect renewable energy refers to purchased electricity from off-site renewable sources
5. Direct non-renewable energy refers to the gross calorific values of fuels consumed on-site
6. Direct renewable energy refers to the gross calorific values of renewable fuels consumed on-site
7. On-site renewable energy refers to renewable energy generated and consumed on-site
8. During 2017, we introduced new methodology to measure paper consumption. This resulted in both an increase in reporting and overall paper consumption. Data from 2015 and 2016
   is no longer considered representative and is, therefore, not shown
9. During 2017, more branches measured their waste generation and those reporting were found to have generated more waste per branch than our previous sample population.
   As a result, total waste generated across the portfolio increased. We are reviewing our scaling-up approach; scaled-up data from 2015 and 2016 is no longer representative,
   and is, therefore, not shown
Further information
Our online resources provide further
information to support this document:

Annual Report
For a full review of our performance
during 2017 visit sc.com/annualreport

Approach to sustainability
You can learn more about our approach to
sustainability at sc.com/en/sustainability

Position Statements
You can find out more about our environmental
and social standards and how we apply
these in our work with clients at
sc.com/positionstatements

Code of Conduct
You can download our Code of Conduct
at sc.com/codeofconduct

Tax reporting
You can find complete country by country
tax reporting at sc.com/cbcr

Included in
DJSI, FTSE4Good

Contact us
If you have any comments or questions about
the information in this report, contact us at
sustainability.feedback@sc.com
Sustainability
Aspirations 2018
Our Aspirations build on our three sustainability pillars with measurable targets to demonstrate how we are achieving sustainable outcomes
across our business. These also allow us to measure our contribution to the UN Sustainable Development Goals.
Aspiration                                               Target                                                         Timeline                       Aspiration                                              Target                                                            Timeline

Pillar 1: Contributing to sustainable                    We’ll work with our clients to:                                                               Pillar 2: Being a responsible company                   We will:
economic growth                                                                                                                                                                                                ¼                                                                 ¼
                                                         ¼                                                              ¼
                                                                                                                                                       People                                                      Increase gender representation: 30% women in senior               Sept 2016 – Dec 2020
Infrastructure                                               Provide advisory, financing, debt structuring services
                                                             and policy advice for $25 billion of infrastructure
                                                                                                                            Jan 2017 – Dec 2019
                                                                                                                            (infrastructure)           Our people are our greatest asset, and our diversity
                                                                                                                                                                                                                   roles (bands 1-4)
                                                                                                                                                                                                               ¼   Roll-out a comprehensive employee wellness                    ¼   Jan 2018 – Dec 2018
Everyone should have access to safe, reliable and            projects, including $4 billion toward clean technology     ¼   Jan 2016 – Dec 2020        drives our business success
                                                                                                                                                                                                                   programme across four key markets (UK, US,
affordable power and infrastructure which transforms                                                                        (clean technology)                                                                     Singapore and Hong Kong)
lives and strengthens economies
                                                                                                                                                                                                               ¼   Roll-out a refreshed diversity and inclusion strategy         ¼   Jan 2018 – Dec 2018
                                                                                                                                                                                                                   Bank-wide
                                                                                                                                                                                                               ¼   Reduce annual energy use by 35% to 230 kWh/m2/year            ¼   Jan 2008 – Dec 2019
                                                                                                                                                       Environment                                                 in our tropical climate locations (80% of portfolio)
                                                                                                                                                       Reducing our own impact on the environment will         ¼                                                                 ¼
Climate change                                           ¼   Introduce criteria to assess alignment to a                ¼   May 2016 – Dec 2017                                                                    Reduce annual energy use by 31% to 275 kWh/m2/year                Jan 2008 – Dec 2019
                                                                                                                                                       protect our planet for the benefit of our communities
                                                             1.5 degree climate scenario for energy sector                  (partially met – carried                                                               in our temperate climate locations (20% of portfolio)
Climate change is one of today’s greatest challenges         clients and transactions                                       forward)                                                                           ¼                                                                 ¼
                                                                                                                                                                                                                   Reduce our annual water use by 72% to 0.5kL/m2/year               Jan 2008 – Dec 2019
and addressing it is essential to promote sustainable    ¼   Expand climate assessment criteria to other                ¼   Jan 2018 – Dec 2018
economic growth                                                                                                                                                                                                ¼   Reduce annual office paper use by 57% to 10kg/                 ¼   Jan 2012 – Dec 2020
                                                             high-emitting sectors
                                                                                                                                                                                                                   FTE/year
                                                                                                                                                                                                               ¼                                                                 ¼
                                                                                                                                                       Conduct                                                     Effectively embed the conduct management framework
                                                                                                                                                                                                                   so that all staff are able to identify, mitigate and manage
                                                                                                                                                                                                                                                                                     Jan 2018 – Dec 2018

                                                                                                                                                       Good conduct and high ethical standards are essential       conduct risk
                                                         ¼                                                              ¼                              in achieving fair outcomes for our clients
Entrepreneurs                                                Provide $6 billion to Business Banking clients                 Jan 2017 – Dec 2019

Entrepreneurs are the heart of local economies,
                                                         ¼   Grow our lending to smaller business clients               ¼   Jan 2017 – Dec 2019
creating jobs and empowering people
                                                             in our Commercial Bank by 20% as measured
                                                             by assets
                                                                                                                                                                                                               ¼                                                                 ¼
                                                                                                                                                       Financial crime compliance                                  All eligible Bank staff to complete relevant ABC, AML
                                                                                                                                                                                                                   and sanctions training with less than 2% overdue
                                                                                                                                                                                                                                                                                     Ongoing

                                                                                                                                                       Financial crime has serious social and economic         ¼                                                                 ¼
                                                                                                                                                                                                                   Deliver at least 10 correspondent banking academies               Jan 2018 – Dec 2018
                                                         ¼   Continue to provide ‘last mile’ payments and               ¼   Jan 2017 – Dec 2019        consequences, harming individuals and communities
Digital                                                      collections to clients in our footprint though our
Everyone should have access to digital banking               Straight2Bank wallet
products enabling safe, efficient and inclusive banking

                                                                                                                                                       Pillar 3: Investing in communities

                                                                                                                                                                                                               ¼   Invest 0.75% of prior year operating profit (PYOP) in our      ¼   Jan 2006 – Dec 2020
Commerce                                                 ¼   Bank 8,000 of our clients’ international and domestic      ¼   Jan 2017 – Dec 2020        Community engagement                                        communities
                                                             networks of suppliers and buyers through banking the                                      Health and education are vital for thriving and
Trade creates jobs and contributes to economies by           ecosystem programmes                                                                                                                              ¼   Raise $100m to tackle avoidable blindness                     ¼   Jan 2003 – Dec 2020
                                                                                                                                                       prosperous communities
enabling people to connect across borders                                                                                                                                                                      ¼   Empower 600,000 girls through education and sport             ¼   Jan 2006 – Dec 2020
                                                                                                                                                                                                               ¼   Educate 5,000 micro and small businesses, with 20%            ¼   Jan 2013 – Dec 2018
                                                                                                                                                                                                                   women-owned or led

                                                         ¼   Provide $1 billion of financing to microfinance              ¼   Jan 2016 – Dec 2020
Impact and                                                   institutions to extend access to finance
sustainable finance
Innovative financial products and partnerships can help   ¼   Facilitate opportunities for our Private Bank clients to   ¼   Jan 2016 – Dec 2020
us solve global development challenges and improve           invest in impact investing funds in our markets
the lives of millions in our markets
                                                         ¼   Continue to promote blended finance capabilities            ¼   Jan 2016 – Dec 2020
You can also read