Global Journal of Engineering and Technology Advances - Global Journal of Engineering and ...
←
→
Page content transcription
If your browser does not render page correctly, please read the page content below

Global Journal of Engineering and Technology Advances, 2020, 03(02), 001–018 Global Journal of Engineering and Technology Advances Cross Ref DOI: 10.30574/gjeta Journal homepage: http://www.gjeta.com (R E S E A R C H A R T I C L E ) In-situ foundation characterization and design in Ese Odo Local Government Area of Ondo State, Southwestern Nigeria Falowo Olumuyiwa Olusola * and Ajiboye Oluwatobi Department of Civil Engineering Technology, Faculty of Engineering Technology, Rufus Giwa Polytechnic, Owo, Ondo State, Nigeria. Publication history: Received on 20 April 2020; revised on 01 May 2020; accepted on 04 May 2020 Article DOI: https://doi.org/10.30574/gjeta.2020.3.2.0026 Abstract This study aims at assessing and characterizing the subsoil types/profile to determine the engineering characteristics of the underlying soils and provide appropriate foundation design alternatives, in Ese Odo area of Ondo State, Nigeria using geophysical and geotechnical methods. The geophysical method involved six vertical electrical soundings (VES) and complemented by two cone penetrometer tests and eight trial pits/boring where representative soil samples were obtained and analyzed in the laboratory, in accordance with relevant geotechnical engineering standards. The VES shows a predominant HK and KHK curve types which account for 33.3 % each. The upper 5 m is characterized by moderate thickness (3.3 – 9.6 m) which could dissipate the influence of structural load effectively and high resistivity values (380 – 2439 ohm-m) to sustain the structural load. The average bearing capacity of 100 KN/m2 is recommended for design of bases/footings for shallow foundation at a depth not less than 2.8 m in the area with the total settlement less than 50 mm tolerable limit, for foundation width ranging from 0.5 to 3.0 m. The recommended range of allowable bearing capacity for strip foundation is 221 - 459 KN/m2, while square is 352 - 641 KN/m2. For driven pile at 5 m, 10 m, and 15 m, the adopted allowable capacity varies between 66 – 118 KN, 212 – 357 KN, and 440 – 717 KN respectively. The allowable bearing capacity for bored pile ranges from 35 – 71 KN, 88 – 170 KN, and 159 – 297 at depth levels of 5 m, 10 m, and 15 m respectively. Keywords: Cone penetration test, Bearing capacities, Foundation design, Pile capacity, Ese Odo, VES 1. Introduction In engineering, geotechnical information is important in foundation works and ensures that the effects of projects on the environment and natural resources are properly evaluated and mitigation measures are applied where necessary [1]. Foundation of any structure is very important because the safety and reliability of structure depends on it [2]. Load of structure are transmitted from the superstructure to the substructure by columns and walls. The selection of type of foundation for a given site depends on many factors. The most important factors are cost of the superstructure, subsurface condition, the functions of the structure and the load it must carry. Also the design load: dead, live, wind or earthquake forces, lateral pressures exerted by the foundation earths on the embedded structural elements; impact equivalents relating to moving and dynamic loads [3]. In this study, priority considerations in the design of structures is given to pre-construction investigation of the subsurface at Ese Odo Local Government of Ondo State, Southwestern Nigeria, in order to ascertain the competence of the subsurface material to host building structures. Such information is required for proper design and construction of foundation, for the assessment of ease of excavation. Therefore realizing the importance of geophysical and geotechnical investigation for foundation design, an in-situ test using geophysical and cone penetrometer test were conducted in Ese Odo area of Ondo State, Nigeria with the objectives of measuring the thickness of the overburden or the depths to the bedrock; and determine the nature of the superficial deposit. Geophysical methods are applied in civil engineering construction related projects ranging from pre- Corresponding author: Olumuyiwa Olusola Falowo Copyright © 2020 Author(s) retain the copyright of this article. This article is published under the terms of the Creative Commons Attribution Liscense 4.0.
Olumuyiwa and Oluwatobi / Global Journal of Engineering and Technology Advances, 2020, 03(02), 001–018 construction feasibility studies to post construction integrity assessment [4 - 11]. Geophysical methods are used for the delineation of subsurface sequence, identification of geological structures and determination of physical parameters of rock formations. These information enhance rapid characterization of subsurface formations, identification of competent subsurface layers, determination of thickness and depth required for the design of civil engineering foundation. Resistivity survey is common geophysical method for subsoil exploration [12]. In this method, artificially generated electric (I) current injected into the ground via two current electrodes while the resulting potential difference (V) is measured by another pair of electrodes. The soil resistance given by Parasnis [13]; R=V/I This needs to be standardized over a unit length. The equation of resistivity ρ (which measured in ohm-m) is; ρ = 2лdR where, d is spacing between the electrodes (in metre). On the other hand cone penetration test (CPT) and standard penetration test (SPT) are the most commonly employed in-situ tests to delineate soil stratigraphy and determine the geotechnical engineering properties of subsurface soils [14]. In spite of continuous efforts to standardize the SPT procedure and equipment, problems associated with its repeatability and reliability still exists. The cone penetration test has been recognized as one of the most widely used in-situ tests [15 - 16]. The cone penetration test consists of advancing a cylindrical rod with a conical tip into the soil and measuring the forces required to push this rod. The friction cone penetrometer measures two forces during penetration. These forces are: the total tip resistance (qc), which is the soil resistance to advance the cone tip and the sleeve friction (fs), which is the sleeve friction developed between the soil and the sleeve of the cone penetrometer. The friction ratio (Rf) is defined as the ratio between the sleeve friction and tip resistance and is expressed in percent. The resistance parameters are used to classify soil strata and to estimate strength and deformation characteristics of soils. The cone penetration test data has been used to predict the ultimate axial pile load carrying capacity. Cone penetrometer testing (CPT) is a fast, effective, and relatively inexpensive system for collecting important soils parameters during a geotechnical site investigation. When used in conjunction with conventional drilling and sampling methods, it provides a more complete description of the subsurface conditions, thereby reducing uncertainty in design and construction. CPT methods can be divided into two basic groups: geophysical logging and stratigraphic profiling specific test methods [17]. Therefore an integration of geophysical with geotechnical methods proffer solutions discrete information usually got from conventional engineering soil characterization methods that lack complete imaging of the subsurface. Geophysical data interpretation can image the subsurface to the depths of competent layer and evaluate the real distribution of geological earth material. Information such as soil type, load bearing capacity of materials, zone of weakness, resistance to penetration, compressibility, shrinkage limit, etc. are usually revealed. This study is aimed at delineating the geologic features using 1-D probing techniques and geotechnical method using cone penetrometer test (CPT) for shallow foundation design. 2. Description of Study Area The study area is situated in the southern part of Ondo State comprising towns like Igbotu, Igbekebo, Shabomi, Akotogbo etc. It is on the coastal plain between the western Nigeria highlands and the Atlantic Ocean. The study area lies within longitude 4027’ E to 50 10’ E and Latitude 6028’N to 60 45’ N (Fig. 1). The terrain of the study area is fairly plain. Deciduous continental marginal forest with dense vegetation including marshes, raffia, mangrove and related vegetation, characterize the study area. The study area falls within the transition zone and the sedimentary portion of southwestern Nigeria on the eastern margin of the Dahomey basin. It is a coastal sedimentary basin filled with cretaceous and younger sediments un- conformably overlying the block – faulted basement complex rocks [18]. The Dahomey basin extends from the Ghana – Ivory Coast boundary across Togo and Benin Republic to western Nigeria. It ends at the western margin of the Niger Delta Basin from which it is separated by the Okitipupa structural high and a major fault structure, the Benin Hinge line [19, 20 - 24]. The stratigraphy of the Dahomey basin has been discussed by several authors from surface and subsurface data as presented in Table 1. They also subdivided the basin sedimentary fill into three materials: Sand and sandstone at the base Alternating sands and shales and Upper shales 2
Olumuyiwa and Oluwatobi / Global Journal of Engineering and Technology Advances, 2020, 03(02), 001–018

 Figure 1 Location Map of The Study Area on the map of Ondo State and Nigeria

There are major and minor rivers in the area, the major rivers include rivers Oluwa and Siluko; others are Oloto, Salawa,
Erifa, Iju-Osun, Otu rivers. The streams and rivers flow into the Atlantic Ocean which terminates the Ilaje end which
shares border with the study area.

Table 1 Stratigraphic succession in the Dahomey Basin [22]

 Age Stratigraphic Unit
 Recent Alluvium
 Pleistocene to Oligocene Benin formation
 Eocene Ilaro formation/Oshoshun member
 Paleocene Imo group/Akinbo formation
 Ewekoro formation
 Maestrichain to neocomain Abeokuta group/
 Araromi formation
 Afowo formation
 Ise formation
 Lower Paleozoic to Precambrian Basement complex

3. Material and methods
The investigation entailed geologic mapping of the area to determine rock types; geophysical investigation to
differentiate subsurface layers using vertical electrical sounding (VES); as well as in-situ geotechnical investigation to
determine geotechnical properties of the earth materials (Fig. 2). The in-situ test involved CPT. The cone penetrometer
test (CPT) was carried out at 2 locations on the two established traverse lines by forcing a hardened steel cone with a
base area of 1000 mm2 at an apex angle of 60° continuously into the ground and measuring its resistance to penetration
[4, 15]. The Dutch cone 2.5 tonnes equipment is a manually operated unit furnished with a single cone that can measure
the cone resistance, qc only. The cone was advanced at regular intervals of 25 cm (0.25 m) and the corresponding
pressure required to advance it is transmitted to a gauge which in turn records this pressure value. This procedure was
repeated until the required depth is either reached or the total resistance to penetration of the tubes and cone reaches
the capacity of the machine. Successive cone resistance readings were plotted against depth to form a resistance profile

 3
Olumuyiwa and Oluwatobi / Global Journal of Engineering and Technology Advances, 2020, 03(02), 001–018

which indicates the strata sequence penetrated. Disturbed soil samples were collected at different depth levels in a trial
pits and used in carrying out laboratory/in-situ tests. Laboratory analyses included index properties, strength and
compressibility tests adopting procedures prescribed by the British Standards [25]. The moisture content (BS 1377:4),
liquid and plastic limits (BS 1377:2), triaxial test, and linear shrinkage tests were carried out on soil samples collected
from different depths.

The materials and instruments used for vertical electrical sounding includes the following; location, topographic and
geological maps of the study area, global positioning system (GPS), calibrated polyethylene twain, steel electrodes, reels
of cables, hammers and resistivity meter. Four reels were used; two for current cables and the other two for potential
cables. The wheels help to control the cables. They also provide points of connection between electrodes and the
resistivity meter. Compass clinometer was used to establish geographic bearing in the study area. Global positioning
system device (GPS) Garmin GPS-78-12-channels hand device was used to establish the coordinates and elevation of
vertical electrical sounding (VES) locations across the study area. Two pairs of galvanized steel electrodes were used
for the survey. A pair serves as current electrodes and another pair as the potential electrodes. Hammers were used for
driving electrodes firmly into the ground in order to ensure good electrical contact, while PASI 16GL earth resistivity
meter and its accessories were used in acquiring vertical electrical sounding data. The equipment has high sensitivity
and can measure as small as 600 mV. The instrument is managed by multiprocessor and it is auto ranging; which is the
ability to automatically adapt signal range to that of value to be measure. It also has the ability to stack data (continuous
averaging of values acquired). Its internal memory can store up to 1800 readings and it allows direct downloading of
reading into a computer via its data transfer port.

The schlumberger electrode configuration was adopted for the vertical electrical sounding (VES) techniques, which is a
measure of vertical variations in the ground resistivity. This is achieved by expanding the inter-electrode spacing about
a fixed center of array. A total of six (06) vertical electrical soundings were conducted across the survey area (Fig. 2).
Each sounding involved stepwise expansion of current electrode separation (AB/2) from minimum of 1 m to maximum
of 500 to 750 m depending on availability of space for spreading. The sounding data obtained were presented as
sounding curves, which are plots of apparent resistivity (ℓa) values against electrode separation (AB/2) on bi-log graph.
The interpretation of VES curves was done in two steps; the first step is manual curve matching [26].

 Figure 2 Data acquisition map showing VES and CPT Points

 4
Olumuyiwa and Oluwatobi / Global Journal of Engineering and Technology Advances, 2020, 03(02), 001–018

This involves segment-by-segment curve matching of the sounding curves with the theoretical curves with the
assistance of auxiliary curves. This exercise yields geoelectric parameters, which is layer thickness and their resistivity
values. The results were later enhanced by computer iteration. Computer software known as RESIST version 1.0 [27]
was used to refine the geoelectric parameters obtained from the manual curve matching exercise. The layer sequences
were interpreted from the variation of the values of the cone resistance with depth. The allowable bearing pressure of
the soil layers on each location was calculated using [28 - 29] equations direct method for estimating ultimate bearing
capacity (qult) from cone resistance for square and strip footings, as follows:

 = ( ) (1 + ) kg/cm2
 12.2

qc = cone resistance value

Df = Depth of footing

B = Width of foundation

Factor of safety at least 3 is recommended by [28] to obtain the allowable bearing pressure.

For cohensionless soils:

 Strip = 28 − 0.0052 (300 − )1.5

 Square = 48 − 0.0052 (300 − )1.5

For clay:

 Strip = 2 + 0.28

 Square = 5 + 0.34

All samples obtained in the field were carefully preserved and subjected to more detailed visual inspection and
descriptions at the laboratory. Thereafter, representative samples were selected from each stratum for laboratory
analysis in accordance with relevant geotechnical engineering standards [25]. The disturbed soil samples were
appropriately subjected to the following laboratory classification tests: natural moisture content; Atterberg limits
(liquid and plastic limits); grain size analysis; and unconsolidated undrained triaxial tests at different cell pressures.
Sieve analysis of cohesive soils were done by soaking oven-dried samples in water overnight and washing through sieve
No. 200 (75 microns opening) while remnants retained on sieve No. 200 were oven-dried and sieved mechanically.
Materials finer than sieve number 200 were analyzed using the hydrometer method based on Stoke’s law. Total
consolidation settlement (s) has been computed for foundation breadth (B) between 0.5 – 3.0 m, subjected to allowable
bearing capacity of 100 KN/m2. The induced vertical stress (Δσ) at the centre of the consolidating layer has been used
in computing settlement. The consolidation settlement has been computed from the expression below [30].

 = ∆ ′

 = coefficient of volume compressibility

 = thickness of compressible layer

∆ ′ = average increase in effective pressure

An mv value of 0.125 m2/KN, which corresponds to the adopted net allowable bearing capacity was used in the settlement
analysis and also corresponds to stiff clay in the range of (0.25 – 0.125 m2/KN). The settlement analysis of the granular soil is
determined using [31] equation;

 ∆
 = 1 2 3 ′ ∑

 where;

 5
Olumuyiwa and Oluwatobi / Global Journal of Engineering and Technology Advances, 2020, 03(02), 001–018

 C1 = depth factor

 C2 = secondary creep factor

 C3 = shape factor

 q’ = net bearing pressure

 Ie = strain influence factor

 ∆ = thickness of soil layer (at midpoint of soil layer)

 Es = equivalent modulus of elasticity

Empirical correction for depth of embedment, secondary creep, and footing shape:
 ′

 C1 = 1 – 0.5[ ]
 ′

 C2 = 1 + 0.2log ( ⁄0.1)

 C3 = 1.03 – 0.03 ⁄ ≥ 0.73

In order to use Schmertmann [29, 31] methods, it is necessary to estimate the stiffness of the soil in terms of equivalent
Young’s modulus at various depths. The Dutch cone penetration resistance of the soils at the site. In the case of normally
loaded cohensionless materials, not prestressed significantly to pressures above the present in in-situ overburden
pressure, the CPT bearing capacity qc has been correlated with Young’s modulus Es by [32 - 33]. The relationship
suggested by [31] is;

 Es = 2qc
 where qc = CPT bearing capacity

Using [28] equation, the allowable and ultimate bearing capacity was calculated using this equation:

 = 2.7 ( )
 2

 = ( / 2 )
 40

Subsequently a factor of safety of 3 was applied on the allowable bearing capacity to get the ultimate bearing capacity.
For this study [34] equation was used for modulus of elasticity determination. A modified version of the Terzaghi
bearing capacity equation is widely used for pile design. The third term, or the density term, in the Terzaghi bearing
capacity equation is negligible in piles and hence usually ignored [35 - 36]. The lateral earth pressure coefficient, K, is
introduced to compute the skin friction of piles.

 = ( ′ × × ) + ( + ′ × × )

 = End bearing term + Skin friction term

where, Pultimate = ultimate pile capacity

 ′ = effective stress at the tip of the pile

Nq = bearing factor coefficient

A = cross sectional area of the pile at the tip

K = lateral earth pressure coefficient

 6
Olumuyiwa and Oluwatobi / Global Journal of Engineering and Technology Advances, 2020, 03(02), 001–018

 ′ = effective stress at the perimeter of the pile

 = friction angle between pile and soil

 = perimeter area of the pile

 For round piles, = ( )

d - diameter

L = length of the pile

The API method [37] uses the following equation for end bearing capacity, which was adopted for this study, where

 = × ′ ×

Q = end bearing capacity of the pile

 ′ = effective stress at pile tip

 2
A is cross sectional area of the (circular) pile at the tip = × ; D is the pile diameter
 4

The maximum effective stress used in the computation is within the 240 kPa recommended [38 - 39]. The value of Nq
depends on the soil:

Nq = 8 to 12 for loose sand

Nq = 12 to 40 for medium dense sand

Nq = 40 for dense sand

Meyerhof [28] suggested the following equation for driven/bored piles:

 = × ′ ×

where

s = skin friction of the pile

 ′ = effective stress at the midpoint of the pile

 = perimeter surface area of the pile

For driven piles = 0.44 for Ø = 28°

 = 0.75 for Ø = 35°

 = 1.2 for Ø = 37°

For bored piles = 0.10 for Ø = 33°

 = 0.20 for Ø = 35°

 = 0.35 for Ø = 37°

 7
Olumuyiwa and Oluwatobi / Global Journal of Engineering and Technology Advances, 2020, 03(02), 001–018

4. Results and discussion

4.1. Vertical Electrical Sounding (VES)
The interpreted results were presented in the form of geoelectric section along the two traverses in Figures 3 and 4.
The VES results showed four to five geoelectric layers were delineated across the study area but are distinguished into
three geologic zones. Layer resistivity varies from 601 - 2439, 380 - 1388, and 52 – 255 ohm-m in the topsoil, surficial
aquifer unit, and intermediate aquifer unit geoelectric layers respectively. Four (04) different curve types were
delineated across the study area: HAK, KHK, HKQ, and HK. Curve types HK and KHK dominates the study area with
frequency of 2 each (33.3 %).

This geoelectric section along Traverse 1 (Ojuala) consist of sand dominated soil and reddish in colour due to presence
of clay mineral, with resistivity ranging from 612 - 1230 ohm-m with thickness of 3.3 – 6.9 m. The weathered layer
(which is the surficial aquifer) underlain the red tropical sand topsoil with resistivity varying between 588 to 1017
ohm-m, with thickness of 58.4 – 73.2 m. The intermediate aquifer underlies the surficial aquifer with resistivity in
between 52 and 98 ohm-m, and depth range of 81.5 – 83.4 m. Both the surficial and intermediate aquifer form the major
aquifer system in the area. Consequently, the upper 5 m has moderate/high resistivity and thickness values that can
sustain structural foundation load. The thickness is more than 5 m, which could help in evenly distribution of load to
the subsoil. The presence of groundwater in the soil pores has a very significant impact on the engineering behavior or
characteristics of the soil, and very important where deep excavation are to be carried out. The groundwater level along
this traverse measured from existing abandoned well and borehole, records values of 9.5 and 16.8 m. This depth is far
below the targeted foundation depth of 5 m for shallow foundation design. This implies that the groundwater level may
not or seriously affect the bases of the foundation footing in this area [3].

 Figure 3 Geoelectric section along profile 1 in Ojuala

The geoelectric section along Traverse 2 (Igbekebo) also showed three distinct subsurface layering, comprising the
topsoil, weathered layer (surficial aquifer) and intermediate aquifer unit. The topsoil is made tropical red sand/clayey
sand with resistivity varying from 601 - 2439 ohm-m and thickness of 4.2 – 9.4 m. The surficial sand aquifer unit is the
most prolific aquiferous zone, which is the depth of most boreholes in the area, the layer resistivity ranges from 380 -
1388 ohm-m and thickness of 72.4 – 68.4 m. The intermediate aquifer has resistivity ranging from 101 - 255 ohm-m.
The depth to this aquifer unit is in between 92.6 and 100.4 m. The existing borehole in the area along this profile
confirms groundwater level of 9.5 m, which is very similar to the one measured along profile 1 at VES 1. The

 8
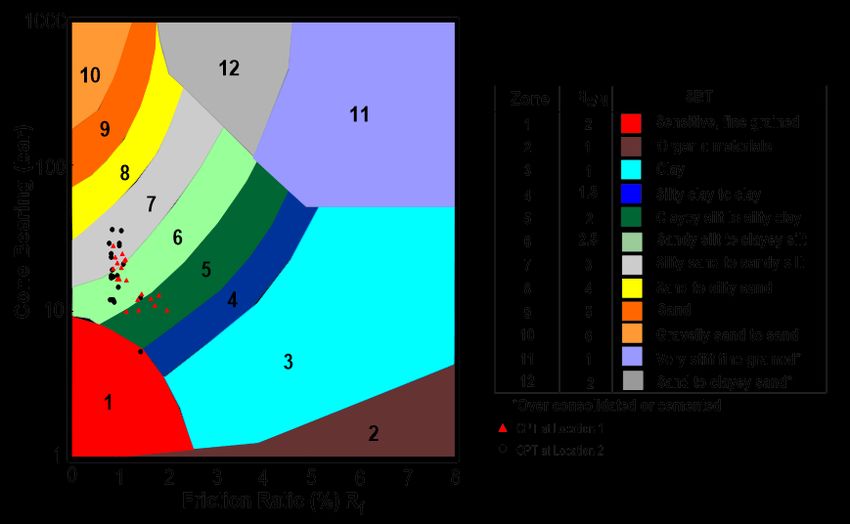
Olumuyiwa and Oluwatobi / Global Journal of Engineering and Technology Advances, 2020, 03(02), 001–018

groundwater level is an indicative of type of soil and its permeability. Groundwater level affects many important phases
in the designing and construction of foundation [40]. Consequently the water level along this traverse may not pose
serious threat to foundation footing if the foundation base is founded within the topsoil.

 Figure 4 Geoelectric section along profile 2 in Igbekebo

4.2. Geotechnical Test
The results of the CPT and laboratory analysis of samples collected during trial test/soil examination is presented in
Tables 2 and 3. The result shows increase in cone resistance and sleeve resistance with depth, ranging from 8 – 60
kg/cm2 and 12 – 80 kg/cm2 at CPT 1, and 10 - 50 kg/cm2 and 12 - 55 kg/cm2 at CPT 2 respectively. The friction ratio
ranges from 1.07 – 1.50 (CPT 1) and 1.07 – 2.00 (CPT 2). The Robertson [41] soil chart classification shows a
predominant zones 5 and 7 corresponding to clayey silt to silty clay and silty sand to sandy silt respectively (Fig. 5). The
geologic section revealed sensitive fine grained clay material at 0.2 m depth. The plots of cone resistance and sleeve
resistance against depth show high degree of heterogeneity in the upper 4 m, with alternation of sandy silt to clayey silt
and silty sand to sandy silt. Consequently this result corroborates VES 2 which delineates high topsoil resistivity values.
The geology (CPT 1) showed that, from 2.8 m depth the geology of the soil is a little bit consistent, and this would be the
suitable/appropriate depth for foundation structure, in order to reduce differential settlement induced by soil
inhomogeneity. At CPT 2, the geology is also alternating between sandy silt to clayey silt and silty sand to sandy silt.
The upper 1 m is characterized by clayey silt to silty clay. Subsequently, placement of foundation basement below 1 m
depth would be appropriate, with CPT value not less than 30 kg/cm2.

The analyzed soil samples at both locations (Tables 2 and 3) shows liquid limits of 29.3 – 41.6 % (within recommended
50 %), plastic limits of 22.1 – 24.7% (within recommended 30 %), plasticity index of 8.2 – 17.53 % (within
recommended 20 %), and shrinkage limits of 4.3 – 9.1 % (low/medium good soil quality). The natural moisture content
ranges from 4.6 – 18.8 % which is low/moderate. The % gravel varies between 0.1 – 1.5, % sand is in between 22 – 56.6
%, silt varies from 19.0 – 43.5 %, clay ranges from 11.7 – 40.2 %. Generally the soil is composed of predominant sand
and silt. The average clay content in the soil is less than 20 %. Consequently it is expected that such soil will undergo
immediate/elastic settlement than consolidation settlement, since most silty (except plastic silt) and granular soil
undergo total settlement even shortly after construction.

 9
Olumuyiwa and Oluwatobi / Global Journal of Engineering and Technology Advances, 2020, 03(02), 001–018

Table 2 Geotechnical/Engineering Properties of Soil in Ojuala (Location 1)

 Depth Cone Sleeve Friction L.L P.L P.I S.L M.C % % % % S.G
 (m) Resistance Resistance Ratio (%) (%) (%) (%) (%) Gravel Sand Silt Clay
 0.2 8 12 1.50
 0.4 15 18 1.20
 0.6 18 20 1.11 33.3 22.2 11.12 9.1 11.3 0.1 36.9 28.9 34.1 2.69
 0.8 18 20 1.11
 1.0 18 20 1.11
 1.2 20 30 1.50 36.6 22.1 14.50 7.9 11.8 0.2 44.6 43.5 11.7 2.64
 1.4 28 32 1.14
 1.6 30 40 1.33
 1.8 32 40 1.25
 2.0 30 35 1.17 41.6 24.1 17.53 7.9 11.8 1.5 45.3 27.3 25.9 2.66
 2.2 25 30 1.20
 2.4 30 35 1.17
 2.6 35 42 1.20
 2.8 42 45 1.07
 3.0 45 50 1.11 37.5 24.2 13.34 4.3 18.8 1.5 34.5 36.6 27.4 2.65
 3.2 50 55 1.10
 3.4 50 60 1.20
 3.6 50 60 1.20
 3.8 58 65 1.12
 4.0 60 80 1.33

 10
Olumuyiwa and Oluwatobi / Global Journal of Engineering and Technology Advances, 2020, 03(02), 001–018

Table 3 Geotechnical/Engineering Properties of Soil in Igbekebo (Location 2)

 Depth Cone Sleeve Friction L.L P.L P.I S.L M.C % % % % S.G
 (m) Resistance Resistance Ratio (%) (%) (%) (%) (%) Gravel Sand Silt Clay
 0.2 10 12 1.20
 0.4 10 15 1.50
 0.6 10 20 2.00 41.2 24.4 16.80 8.6 11.1 1.4 56.6 19.0 23.0 2.64
 0.8 12 22 1.83
 1.0 15 20 1.33
 1.2 18 25 1.39 36.3 19.3 17.00 7.9 6.20 1.2 41.9 19.5 37.4 2.66
 1.4 20 28 1.40
 1.6 18 30 1.67
 1.8 20 35 1.75
 2.0 28 38 1.36 37.6 24.7 12.95 7.1 4.8 0.1 53 18.8 28.1 2.66
 2.2 30 32 1.07
 2.4 30 35 1.17
 2.6 30 38 1.27
 2.8 32 35 1.09
 3.0 40 50 1.25 29.3 21.1 8.20 7.9 4.6 0.0 22 37.8 40.2 2.67
 3.2 35 40 1.14
 3.4 38 45 1.18
 3.6 42 55 1.31
 3.8 40 55 1.38
 4.0 50 55 1.10

 11
Olumuyiwa and Oluwatobi / Global Journal of Engineering and Technology Advances, 2020, 03(02), 001–018

 Figure 5 Robertson’s [41] Soil Classification Chart and Description of Different Zones for soil in the two localities

4.3. Bearing Capacity Determination
The ultimate and allowable bearing capacity estimated from the cone resistance using Meyerhof [28] equation as
presented in Table 4. The calculated bearing capacities could be used in determining the foundation type for structures
[40]. The allowable bearing of the soil varies between 20 to 147 KN/m 2 for CPT 1, and 74 – 368 KN/m2 for CPT 2.
Consequently an average allowable bearing capacity of 100 KN/m2 (ultimate bearing capacity of 300 KN/m2) would be
appropriate for design of shallow foundation in the area, at a depth not less than 2.8 m in location 1 and 3.6 m at location
2.

4.4. Settlement Analysis
The commonly accepted basis of design is that the total settlement of a footing should be restricted to about 25 mm [3,
42] as by so doing the differential settlement between adjacent footings is confined within limits that can be tolerated
by a structure. The settlement analysis for foundation width of 0.5 m at three depth levels of 1 m, 2 m and 3 m produces
relative high values (greater than 25 mm) settlement values. But foundation width of 1.5 – 3 m produces settlement less
than 25 mm (Table 5). Although according to Meyerhof [28] and Schmertamnn [29] total settlement limits of 60 mm
(clay) and 50 mm (granular soil) are still tolerable. Therefore foundation width of 0.5 m for different depth levels is still
within tolerable limit. The calculation of bearing capacities for strip and square foundation is shown in Table 6. For strip
foundation, the appropriate (recommended) ultimate bearing and allowable bearing capacity for depth levels of 1 to 3
m vary from 662 – 1376 KN/m2 and 221 - 459 KN/m2 respectively, while square footing varies in between 1056 – 1923
KN/m2 and 352 - 641 KN/m2.

 12
Olumuyiwa and Oluwatobi / Global Journal of Engineering and Technology Advances, 2020, 03(02), 001–018

 Qc/Sr (Kg/cm2)
 0 10 20 30 40 50 60 70 80 GEOLOGY
 0 Sensitive
 fine grained

 -0.5 Sandy silt
 to
 Clayey silt
 -1

 Silty sand
 Depth (m)

 -1.5 to
 Sandy silt

 -2 Sandy silt
 to
 Clayey silt
 -2.5
 Silty sand
 -3 to
 Sandy silt

 -3.5

 -4

 Cone resistance (Qc)
 Sleeve resistance (Sr)

 Qc/Sr (kg/cm2)
 0 10 20 30 40 50 60 GEOLOGY
 0
 Clayey
 -0.5 silt to
 Silty clay

 -1
 Sandy silt to
 Clayey silt
 -1.5
 Depth (m)

 Clayey silt
 to Silty clay
 -2
 Sandy silt to
 -2.5 Clayey silt

 Silty sand to
 Sandy silt
 -3
 Sandy silt to
 Clayey silt
 -3.5
 Silty sand to
 Sandy silt
 -4
 Cone resistance (Qc)
 Sleeve resistance (Sr)

Figure 6 Plots of Cone resistance and sleeve resistance against depth at location 1 and 2, corresponding to (a) Ojuala
 CPT 1 (b) Igbekebo CPT 2

 13
Olumuyiwa and Oluwatobi / Global Journal of Engineering and Technology Advances, 2020, 03(02), 001–018

Table 4 Bearing Capacities estimated from the Cone resistance values for both sites (locations)

 Depth CPT 1 CPT 2
 (m)

 (KN/m2) (KN/m2) (KN/m2) (KN/m2)
 0.2 20 59 25 74
 0.4 37 110 25 74
 0.6 44 132 25 74
 0.8 44 132 29 88
 1.0 44 132 37 110
 1.2 49 147 44 132
 1.4 69 206 49 147
 1.6 74 221 44 132
 1.8 78 235 49 147
 2.0 74 221 69 206
 2.2 61 184 74 221
 2.4 74 221 74 221
 2.6 86 257 74 221
 2.8 103 309 78 235
 3.0 110 331 98 294
 3.2 123 368 86 257
 3.4 123 368 93 279
 3.6 123 368 103 309
 3.8 142 426 98 294
 4.0 147 441 123 368

Table 5 Settlement variation at Different Depths and Foundation Widths

 Foundation width (m) Settlement (mm) at Depth Level (m)
 1m 2m 3m
 0.5 51.23 50.68 50.69
 1.0 29.19 30.06 31.10
 1.5 20.94 22.30 23.73
 2.0 15.29 16.80 18.34
 2.5 12.08 13.67 15.27
 3.0 9.96 11.60 13.25

 14
Olumuyiwa and Oluwatobi / Global Journal of Engineering and Technology Advances, 2020, 03(02), 001–018

Table 6 Bearing Capacities for Strip and Square Shallow Foundations

 Depth (m) Strip Square Strip Square

 (KN/m2) (KN/m2) (KN/m2) (KN/m2)
 1 662 1056 221 352
 2 992 1456 331 485
 3 1376 1923 459 641

An attempt was made to design for deep foundation at depth levels of 5 m, 10 m, and 15 m for circular piles of 400 mm,
500 mm, and 600 mm while taking into consideration the groundwater level. The type of piles designed for in the area
included driven/displacement piles and bored piles. The versatility and cost effectiveness are part of the governing
factors considered. The bearing capacity of pile depends on pile diameter, founding depth, vertical stress, area of the
pile, method of installation etc. The result shows that the larger the diameter of the pile, the better its bearing capacity.
For driven pile at 5 m, 10 m, and 15 m, the adopted allowable capacity based on calculation is in between 66 – 118 KN,
212 – 357 KN, and 440 – 717 KN respectively. The allowable bearing capacity for bored piles ranges from 35 – 71 KN,
88 – 170 KN, and 159 – 297 at depth levels of 5 m, 10 m, and 15 m respectively (Table 7). Although it is recommended
that pile load test be conducted before the design, construction and installation of pile [43] in the locality to ensure this
proposed design alternatives be effectively and correctly used in the study area.

Table 7 Axial Pile Capacity for proposed Driven and Bored Piles

 Driven Pile Bored Pile
 Depth End Ultimate Allowable Ultimate Allowable
 (m) Pile bearing Skin pile pile Skin pile pile
 diameter capacity Friction capacity capacity Friction capacity capacity
 (m) (KN) (KN) (KN) (KN) (KN) (KN) (KN)
 5 0.4 77 121 198 66 27 104 35
 0.5 120 151 271 90 34 155 52
 0.6 173 181 354 118 41 214 71
 10 0.4 154 484 637 212 110 264 88
 0.5 240 604 845 282 137 378 126
 0.6 346 725 1072 357 165 511 170
 15 0.4 231 1088 1319 440 247 478 159
 0.5 361 1360 1721 574 309 670 223
 0.6 519 1632 2151 717 371 890 297

5. Conclusion
The study integrated vertical electrical geophysical sounding and geotechnical investigation to characterize and assess
the soil material in Ese Odo area of Ondo State for foundation design. According to Robertson’s chart, the distribution
of the CPT data obtained encompasses two zones 5 and 7 corresponding to clayey silt to silty clay and silty sand to sandy
silt. The VES shows a predominant HK and KHK curve types which account for 33.3% each. These kind of curves imply
stability at shallow depth. The upper 5 m is characterized by moderate thickness and high resistivity values to sustain
the structure. The thickness (3.3 – 9.6 m) would dissipate the influence of structural load effectively. The average
bearing capacity of 100 KN/m2 could be adopted in the area for design of bases/footings for shallow foundation at a
depth not less than 2.8 m. The total settlement is less than 50 mm tolerable limit for foundation width ranging from 0.5
to 3.0 m. The appropriate (recommended) allowable bearing capacity for strip foundation is 221 - 459 KN/m2, while
square footing varies from 352 - 641 KN/m2. For driven pile at 5 m, 10 m, and 15 m, the adopted allowable capacity
varies between 66 – 118 KN, 212 – 357 KN, and 440 – 717 KN respectively. The allowable bearing capacity for bored
piles ranges from 35 – 71 KN, 88 – 170 KN, and 159 – 297 at depth levels of 5 m, 10 m, and 15 m respectively.

 15
Olumuyiwa and Oluwatobi / Global Journal of Engineering and Technology Advances, 2020, 03(02), 001–018

Compliance with ethical standards

Acknowledgments
Special appreciation to TETFund, Nigeria through Centre for Research and Development of Rufus Giwa Polytechnic,
Owo, Ondo State, Nigeria for providing the fund for this research work.

Disclosure of conflict of interest
The authors declare that they have no conflict of interest.

References
[1] Nwankwoala HO, Youdeowei PO and Ngah SA. (2009). Expanding Hydrogeotechnical considerations in
 environmental impact assessment studies: A case study of Ogorode Sapele, Delta State, Nigeria. Journal of Applied
 Sciences and environment management, 13(1), 67 - 71.
[2] Terzaghi K, Peck RB and Mesri G. (1996). Soil mechanics and foundation engineering. New York: John Wiley &
 Sons.
[3] Bowles JE. (1982). Foundation Analysis and Design, McGraw-Hill, Inc., New York, 816.
[4] Klimis NS, Papazachos CB and Effremidis CF. (1999). Determination of the Behaviour of a Sedimentary Rock
 Mass: Comparison of Measured Static and Dynamic Properties. Proceeding of International Conference on Rock
 Mechanics (Paris, France), 1-2.
[5] Sarvvaidis A, Tsokas G, Soupios P, Vargemezis G, Manakou M, Tsourlos P and Fikos I. (1999). Geophysical
 Prospecting in the Krousovitis dam (N Greece) by Seismic and Resistivity Geophysical Methods. J. Balkan
 Geophysics Society, 2, 1, 28-39.
[6] Luna R and Jadi H. (2000). Determination of Dynamic Soil Proper ties Using Geophysical Methods. Proc. 1 Int.
 Conf. on the Application of Geophysical and NDT Methodologies to Transportation Facilities and Infrastructure
 Geophysics, Federal Highway Administration, Saint Louis, 3, 1 -15.
[7] Venkateswara VR, Srinivasa R, Prakasa RB and Koteswara RP. (2004). Bedrock Investigation by Seismic
 Refraction Method: A Case Study. J. Ind. Geophysics Union, 8, 223-228.
[8] Othman AA. (2005). Constructed Geotechnical Characteristics of Foundation Beds by Seismic Measurements.
 Journal of Geophysics, England, l (2), 126-38.
[9] Soupios P, Papazachos CB, Vargemezis G and Fikos I. (2005). Application of Modern Seismic Methods for
 geotechnical Site Characterization. Proc. Int. Workshop in Geoenvironment and Geotechnics (Milos Island,
 Greece, 12-14 September), 163-70.
[10] Soupios P, Papazachos CB, Vargemezis G and Savvaidis A. (2006). In situ geophysical Investigtaion to Evaluate
 Dynamic Soil Properties at the Ilarionas, Northern Greece. Proc. 2 Int. Conf. Advances in Mineral Resources
 Management and Environmental Geotechnology (Hania, Crete, Greece, 25-27 September) (Heliotopos
 Conferences), 149-156.
[11] Soupios PM, Georgakopoulos P, Ppadopoulos N, Saltas V, Andreadakis A, Vallianatos F, Sarris A and Makris JP.
 (2007). Use of Engineering Geophysics to Investigate a Site for a Building Foundation. Journal of Geophysics
 Engineering, l(4), 1.
[12] Telford WM, Geldart LP and Sheriff RE. (1990). Applied Geophysics, 2nd ed. Cambridge University Press. Parasnis
 DS. (1982). Principles of Applied Geophysics. Published by Chapman and Hall, New York, 275.
[13] Tomlinson MJ. (1975). Foundation Analysis and Design, Pitman, London.
[14] Lunne T, Robertson PK and Powell JJM. (1997). Cone Penetration Testing in Geotechnical Practice, Blackie
 Academic and Professional, London.
[15] Robertson PK and Campanella RG. (1984). Guidelines for Use and Interpretation of the Electric Cone Penetration
 Test, Hogentogler & Company, Inc., Gaithersburg, MD, Second Edition, 175.
[16] Eslami A and Gholami M. (2002). Bearing capacity of shallow foundations from CPT data, proceeding of 3rd
 Iranian International Conference on Geotechnical Engineering and Soil Mechanics, 93-97.

 16
Olumuyiwa and Oluwatobi / Global Journal of Engineering and Technology Advances, 2020, 03(02), 001–018

[17] Enu EI. (1990). Nature and Occurrence of Tarsands in Nigeria: Ako, B.D., Enu, E.I. (Eds) Occurrence, Utilization
 and Economics of Tarsands. Nigeria Mining and Geosciences Society Publication on Tarsands Workshop. Olabisi
 Onabanjo University, Ago-Iwoye, 11-16.
[18] Murat RC. (1970). Stratigraphy and Paleogeography of the Cretaceous and Lower Tertiary in Southern Nigeria
 (African Geology, University of Ibadan Press, Ibadan, Nigeria).
[19] Jones HA and Hockey RD. (1964). The geology of part of Southwestern Nigeria. Geological Survey of Nigeria. Bull.
 31,87.
[20] Reyment RA. (1965). Aspect of Geology of Nigeria. Ibadan Univ. Press, 45.
[21] Omatsola ME and Adegoke OS. (1981). Tectonic evolution and Cretaceous stratigraphy of the Dahomey basin.
 Journal of Mining Geology, 18(1), 130-137
[22] Billman HG. (1992). Offshore Stratigraphy and Paleontology of the Dahomey Embayment, West African. NAPE
 Bulletin, 7 (2), 121 - 130.
[23] Petroleum Trust Fund (1997). Geological Map of Ondo State: National Rural Water Supply Project. The Petroleum
 (Special) Trust Fund (PTF).
[24] British Standard Institutions (1990). Methods of Test for soils for Civil Engineering Purposes. B.S 1377: Part 2, 8
 – 200.
[25] Keller GV and Frishchnecht FC. (1966). Electrical Methods in Geophysical Prospecting. Pergamon Press, New
 York, 96.
[26] Vander-Velpen BPA. (1988). RESIST Version 1.0. M.Sc. Research Project. ITC: Delft Netherlands.
[27] Meyerhof GG. (1976). Bearing Capacity and Settlement of Pile Foundations. The Eleventh Terzaghi Lecture.
 Journal of Geotechnical Engineering Division, ASCE, Vol. 102, No. GT3, 195-228.
[28] Schmertmann JH. (1978). Guidelines for Cone Penetration Test, Performance and Design. U.S. Department of
 Transportation, Report No. FHWA-TS-78-209, Washington, D.C., 145.
[29] Stroud MA and Butler FG. (1975). The standard penetration test and the engineering properties of Glacial
 materials. In: Proceedings of the Symposium of glacial materials, University of Birmingham.
[30] Schmertmann JH. (1970). Static Cone lo Compute Static Settlement over Sand, Journal of the Soil Mechanics and
 Foundations Division. ASCE, 96. No. SM3. Proc. Paper 7302, 101l-1043.
[31] Debeer EE. (1963). The scale effect in the transposition of the results of deep sounding tests on the ultimate
 bearing capacity of piles and caisson foundations. Geotechnique, 13(1), 39-75.
[32] Webb DL. (1969). Settlement of Structures on deep alluvial sand sediments in Durban, South Africa, British
 Geotechnical Society Conference on In-Situ Investigations in Soils and Rocks, Session III, paper 16, London,
 England, 13-15 May, 133-140.
[33] CFEM (1992). Canadian Foundation Engineering Manual. Third Ed, Canadian Geotechnical Society, BiTech.
 Publishers, Vancouver, 512.
[34] De-Ruiter J and Beringen FL. (1979). Pile Foundations for Large North Sea Structures. Marine Geotechnology,
 3(3), 267-314.
[35] Bustamante M and Gianeeselli L. (1982). Pile Bearing Capacity Predictions by Means of Static Penetrometer CPT.
 Proceedings of the 2nd European Symposium on Penetration Testing, ESOPT-II, Amsterdam, 2, 493-500.
[36] American Petroleum Institute (1984). Recommended practice for planning, designing and constructing fixed
 offshore platforms, 15th ed. API RP2A.
[37] Tumay MT and Fakhroo M. (1982). Friction Pile Capacity Prediction in Cohesive Soils Using Electric Quasi-Static
 Penetration Tests. Interim Research Report No. 1, Louisiana Department of Transportation and Development,
 Research and Development Section, Baton Rouge, LA, 275.
[38] Aoki N and de Alencar D. (1975). An Approximate Method to Estimate the Bearing Capacity of Piles, Proceedings,
 the 5th Pan-American Conference of Soil Mechanics and Foundation Engineering, Buenos Aires, 1, 367-376.
[39] Skempton AW. (1951). The Bearing Capacity of Clays, Proceedings Building Research Congress, 1951, Vol. 1, pp.
 180-189.

 17
Olumuyiwa and Oluwatobi / Global Journal of Engineering and Technology Advances, 2020, 03(02), 001–018

[40] Robertson PK. (1990). Soil classification using the cone penetration test. Canadian Geotechnical Journal, 27, 151-
 158.
[41] Burland JB and Burbidge MC. (1984). Settlement of foundations on sand and gravel, Proceedings of the Institution
 of Civil Engineers, Part 1, 1325-1381
[42] Meyerhof GG. (1965). Shallow Foundations,” Journal of the Soil Mechanics and Foundations Division, ASCE, Vol.
 91, No. SM2, Proc. Paper 4271, 25.

How to cite this article
Falowo OO and Ajiboye O. (2020). In-situ foundation characterization and design in Ese Odo Local Government Area of
Ondo State, Southwestern Nigeria. Global Journal of Engineering and Technology Advances, 3(2), 01-18.

 18
You can also read