Source location of volcanic earthquakes and subsurface characterization using fiber optic cable and distributed acoustic sensing system
←
→
Page content transcription
If your browser does not render page correctly, please read the page content below
www.nature.com/scientificreports
OPEN Source location of volcanic
earthquakes and subsurface
characterization using fiber‑optic
cable and distributed acoustic
sensing system
Takeshi Nishimura1*, Kentaro Emoto1, Hisashi Nakahara1, Satoshi Miura2,
Mare Yamamoto2, Shunsuke Sugimura2, Ayumu Ishikawa1 & Tsunehisa Kimura3
We present one of the first studies on source location determination for volcanic earthquakes and
characterization of volcanic subsurfaces using data from a distributed acoustic sensing (DAS) system.
Using the arrival time difference estimated from well-correlated waveforms and a dense spatial
distribution of seismic amplitudes recorded along the fiber-optic cable, we determine the hypocenters
of volcanic earthquakes recorded at Azuma volcano, Japan. The sources are located at a shallow depth
beneath active volcanic areas with a range of approximately 1 km. Spatial distribution of the site
amplification factors determined from coda waves of regional tectonic earthquakes are well correlated
with old lava flow distributions and volcano topography. Since DAS observation can be performed
remotely and buried fiber-optic cables are not damaged by volcanic ash or bombs during eruptions,
this new observation system is suitable for monitoring of volcanoes without risk of system damage
and for evaluating volcanic structures.
Volcanic earthquakes and tremors are generated by stress disturbances in a volcanic edifice caused by magma
migration and/or pressurization of the magma chamber, conduit, cracks, or dikes. Their source locations have
been used to clarify the magma system beneath active volcanoes. In addition, spatio-temporal changes of the
source locations have been used to predict the locations of new eruptions and to monitor volcanic a ctivity1,2.
However, volcanic earthquakes and tremors that are generated by volcanic fluids (e.g., magma or hot water) are
generally not well located because the onsets of P- and S-waves, which are used for standard hypocenter deter-
mination for tectonic earthquakes, are often unclear and/or seismic signals oscillate for a long t ime3–5.
In order to overcome such difficulties, small-aperture seismic arrays are used to measure tiny arrival time
differences of seismic w aves6,7. The seismometers in the array must be deployed close to each other, within a
hundred meters, in order to maintain high coherency of seismic waves. Based on the propagation direction
and apparent velocity of incident waves at more than two arrays, the hypocenter can be determined. However,
the accuracy may not be high because wave propagation is greatly affected by heterogeneous structure beneath
the arrays. Another way to overcome this difficulty is to use the spatial distribution of the seismic amplitude of
volcanic earthquakes and t remors8. This method uses permanent seismic network data around a target volcano,
and its simple analysis using the relation between amplitude attenuation and distance allows the method to be
applied to volcanic earthquakes and tremors observed at many volcanoes2,9. However, the accuracy of the esti-
mated source locations is affected by parameter assumptions. For instance, since volcanic subsurfaces consist of
pyroclasts, old lava flows, steep valleys eroded by rainfalls and so on, evaluation of the site amplification factor
and attenuation factor for seismic wave propagation affects the absolute location of the source9. Recently, seismic
interferometry techniques have been developed and applied to volcanic tremor data10–12. In these techniques,
cross-correlation functions (CCFs) for seismic waves recorded at several stations are stacked in order to retrieve
direct waves propagating from the source location, and the time differences for the peaks of CCFs are used to
1
Department of Geophysics, Graduate School of Science, Tohoku University, 6‑3 Aramaki‑aza Aoba, Aoba‑ku,
Sendai 980‑8578, Japan. 2Research Center for Prediction of Earthquakes and Volcanic Eruptions, Graduate School
of Science, Tohoku University, 6‑3 Aramaki‑aza Aoba, Aoba‑ku, Sendai 980‑8578, Japan. 3Schlumberger SRPC, 1
Rue Henri Becquerel, BP.202, 92140 Clamart Cedex, France. *email: takeshi.nishimura.d2@tohoku.ac.jp
Scientific Reports | (2021) 11:6319 | https://doi.org/10.1038/s41598-021-85621-8 1
Vol.:(0123456789)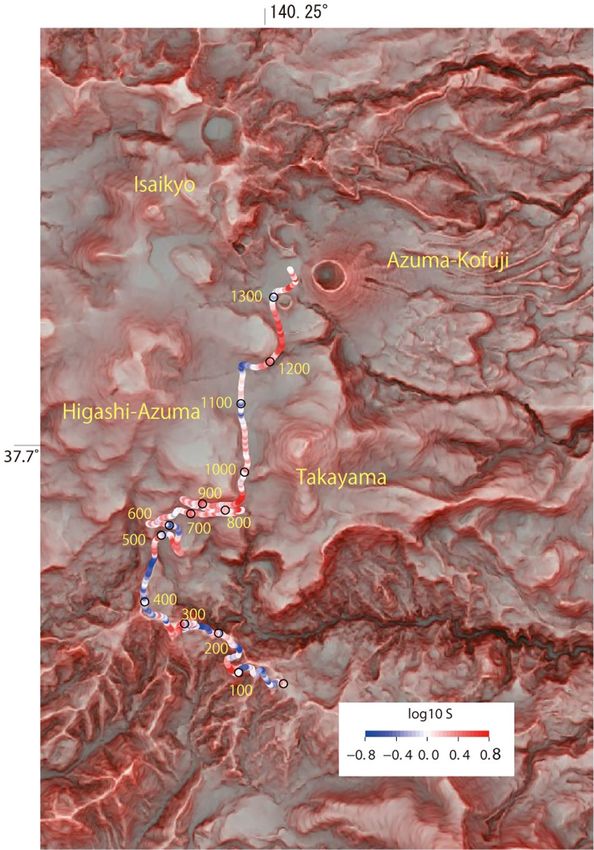
www.nature.com/scientificreports/
determine the source location. Such methods, however, require continuous data lasting for several to tens of
minutes in order to obtain stable cross-correlation functions for the source location.
Seismic observation using fiber-optic cable and a distributed acoustic sensing (DAS) system is now widely
deployed in various geological fields for structure imaging, source studies, and hazard a ssessments13. The system
can continuously record dynamic strain along the direction of the fiber-optic cable at an interval of 5–10 m for
a distance of up to 40–50 km. For example, observations using a DAS system succeeded in recording regional
earthquakes and teleseismic waves, and imaging active faults or seismic structures from the near-surface region
to the Moho b oundary14–19. Temporal seismic velocity changes in the fracture system have been investigated
by applying seismic interferometry methods using ambient noise recorded by fiber-optic cables in b oreholes20.
The large number of channels recorded by DAS improves the sensitivity for detecting earthquakes below the
noise level21.
The seismic observation network for active volcanoes generally consists of several to tens of seismometers
deployed on the volcano flank and/or around active craters. Recently, some very dense seismic networks have
been temporarily deployed at active volcanoes22, but temporal observations using a few tens to a hundred seis-
mometers require a large amount of effort for the deployment of seismometers and frequent maintenance of
the system. The present study focuses on the use of fiber-optic cable and a DAS system for monitoring volcanic
earthquakes and tremors. Since the source location for volcanic earthquakes and tremors is one of the most
important parameters for evaluating volcanic activity, we apply hypocenter determination methods that do
not need onsets of P- and/or S-waves to the volcano seismic signals recorded by the DAS system. We apply two
methods using (a) arrival time differences and (b) seismic amplitudes for volcanic low-frequency earthquakes,
which are accompanied by tilt and/or very-long-period signals, observed at Mt. Azuma, Japan, and discuss the
reliability and usefulness of the observations using DAS. We further estimate the site amplification factors of
the subsurface structure by analyzing coda waves of regional tectonic earthquakes. We discuss the results with
geological characteristics of the volcano, taking advantages of very high spatial resolution of fiber optic cable
and DAS system.
Field observations and data
Figure 1 shows the locations of Azuma volcano and the fiber-optic cable we used in the present study. Permanent
stations have been deployed by Tohoku University and the Japan Meteorological Agency (JMA), and short-period
or broadband seismometers are installed at each station. The fiber-optic cable was deployed along a mountain
road for a distance of 14 km. The cable was placed in corrugated hard polyethene pipes (FEP) embedded at a
depth of approximately 50 cm. We performed observations for approximately three weeks from July 4 to July
25, 2019, installing a DAS system (heterodyne Distributed Vibration Sensing system (hDVS), Schlumberger) at
Tsuchiyu station, at the southern end of the single-mode cable. We continuously recorded the dynamic strain
signals in the direction along the cable with a sampling frequency of 1000 Hz, a spatial interval of 10.2 m, and
a gauge length of 40.8 m. The data were resampled at 200 Hz in the following analyses. The DAS system uses
a high-pass filter in order to eliminate nonlinear effects mainly due to temperature changes, and has a lowest
frequency of 0.1 Hz (Methods, Observation using Fiber-optic cable and the DAS system).
Source location determination for volcanic earthquakes
Azuma volcano is an active volcano located at the volcanic front of northeast Japan, and its eastern part consists
of several andesitic edifices, such as Nishi-Azuma, Higashi-Azuma, Issaikyo, Takayama, and Azuma-Kofuj.
Phreatic eruptions occurred around Issaikyo in 1893–1895, 1950, and 197723. Fumarolic activity is still high
around Jododaira (altitude: 1500 m), and intermittent and continuous seismic activity and inflation or deflation
have been observed around J ododaira24. In Fig. 1, the hypocenters of volcanic earthquakes with relatively clear
onsets of P -and S-waves recorded at the permanent stations are shown (Methods, Routine hypocenter determina-
tion using permanent station data). The hypocenters are distributed above sea level beneath Jododaira. Seismic
activity is often associated with inflation-deflation activity detected by a borehole tilt meter, and is inferred to
be caused by shallow hydrothermal a ctivity25.
We examine six volcanic earthquakes that occurred during our observation period (Figure S1). The observed
waveforms continued for approximately 10 s with a dominant frequency of 4 Hz. A volcanic earthquake that
occurred at 12h35m (UT) on July 4, 2019, which was the largest volcanic earthquake during our observation
period, was located 0.5 km beneath the ground surface at Jododaira based on routine hypocenter determination
using the onsets of P- and S-waves. Its magnitude is estimated to be about − 0.1 from the maximum amplitude
of ground velocity26. The other five volcanic earthquakes are not located enough accurately because of obscure
P- and S-waves. Their magnitudes are estimated to be about − 1 if their hypocenters are located at the shallow
depth beneath Jododaira. Note that all the hypocenters shown in Fig. 1 are the events occurring before the DAS
observation except the volcanic earthquake on July 4.
Two methods are used for determining the source locations. One is the arrival time difference method, and the
other method is the amplitude source location (ASL) method. The former method can determine source locations
because the fiber-optic cable is deployed along a winding road with several curves that act as an L-shaped array,
which enables us to infer the slowness (propagation direction and incident angle) of incident seismic waves. Its
spatial resolution becomes worse for locations far from the cable. On the other hand, the spatial resolution of
the ASL method becomes worse in the east–west direction because the cable mainly runs in the north–south
direction (Methods, Source location errors). Hence, we determine the source location using both methods, and
identify the most likely result. We used the waveform data with a signal to noise ratio of larger than 4 in the
following analyses.
Scientific Reports | (2021) 11:6319 | https://doi.org/10.1038/s41598-021-85621-8 2
Vol:.(1234567890)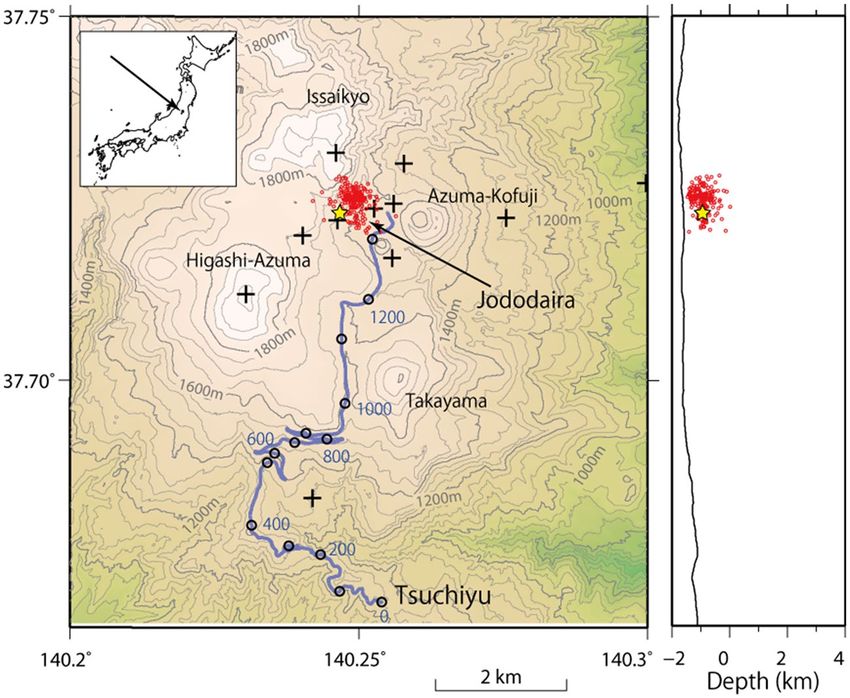
www.nature.com/scientificreports/
Figure 1. Locations of the fiber-optic cable and distributed acoustic sensing (DAS) system. The fiber-optic cable
is indicated by the purple line, and the open black circles denote the locations of the measurement points every
200 number. Hypocenters of volcanic earthquakes determined by routine analyses of permanent station data for
the period from January 1 to July 4, 2019 are indicated by red circles. Note that only the hypocenter of a volcanic
earthquake on July 4, which is analyzed in the present study, is located by the routine analyses during our
observation period. Plus symbols indicate permanent stations maintained by Tohoku University and the Japan
Meteorological Agency. Azuma volcano consists of andesitic edifices, such as Issaikyo, Azuma-Kofuji, Higashi-
Azuma, and Takayama. Volcanic activity during the Holocene period occurred around Jododaira. The DAS
system is located at Tsuchiyu station, at the south end of the fiber-optic cable. Blue fine lines represent rivers.
This figure was created by Generic Mapping Tools (GMT) v4.5.539.
Arrival time difference method. Volcanic earthquakes and tremor sometimes do not accompany any
significant phases, such as P- or S-waves, but closely spaced measurement points along the fiber-optic cable
allow measurements of very small arrival time differences for well-correlated waveforms between nearby meas-
urement points. The arrival time differences change according to the incident angle of seismic waves to the
measurement points along the cable. For example, the arrival time differences come to be small when the source
is deep or when the source is located to the direction perpendicular to the direction of fiber optic cable. We use
this principle to locate the sources of volcanic earthquakes.
We measure the arrival time differences for earthquakes recorded at two measurement points. Since the fiber-
optic cable is deployed over a long distance, there are many choices for the distance between the two measurement
points. In this analysis, distances of 30.6–71.4 m are used, for which highly correlated seismic waves are observed
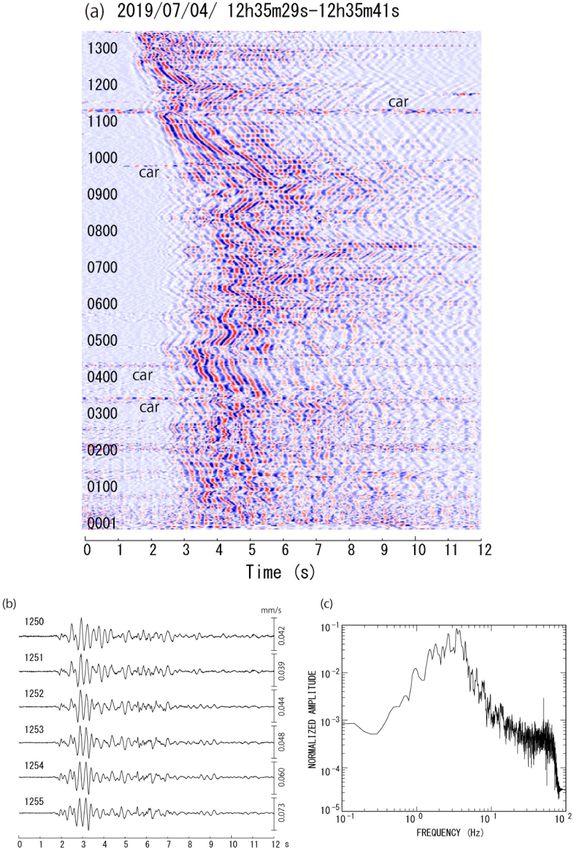
(Methods, Measurement of arrival time difference). The arrival time difference is calculated from the phase dif-
ference in the cross-spectra, applying a 12-s time window for the waveforms (Fig. 2). Since the cross-spectra are
mainly calculated from waves with large amplitudes, we assume that the arrival time differences are associated
with S-wave arrivals. The S-wave velocity structure used for routine hypocenter determination is assumed (Fig-
ure S2) and the station height is corrected for the calculation of theoretical travel times. We identify the best-fit
location where the residual between the observed and theoretical arrival time differences is a minimum using
a grid search method. The grid points are set every 0.02° in latitude and longitude and at depths of − 1.25, − 1,
− 0.75, − 0.5, − 0.25, 0, 1, 2, and 3 km below sea level.
The source locations of the six volcanic earthquakes are widely distributed at depths of less than 1 km beneath
the north-west region of Jododaira (Fig. 3a). Such horizontal extension of the source locations is caused by the
fiber optic cable deployed mostly in the north–south direction in the southern area of Jododaira, which makes the
small residuals run roughly in the north-west direction. Depth resolution may not be good as the small residuals
extend down to 3–4 km depths. Source locations and residual maps as well as the measurement points used for
the source locations are shown in Figure S3 for each of the six volcanic earthquakes.
Amplitude source location method. We measure the maximum amplitudes of seismic waves along the
fiber-optic cable in order to determine the source locations for the volcanic earthquakes. In the ASL method,
the seismic wave generated from a source is assumed to be attenuated by geometrical spreading and intrinsic
Scientific Reports | (2021) 11:6319 | https://doi.org/10.1038/s41598-021-85621-8 3
Vol.:(0123456789)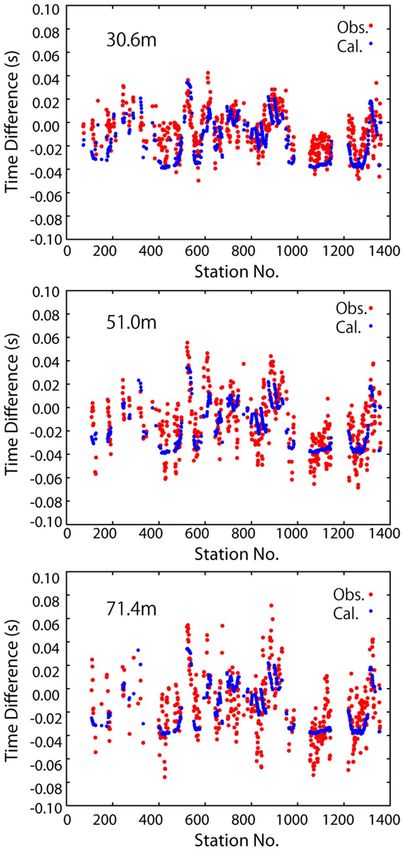
www.nature.com/scientificreports/

                                            Figure 2.  (a) Record section for the volcanic earthquake on July 4, 2019. (b) An example of a seismogram of
                                            the volcanic earthquake recorded at nearby measurement points. The amplitudes are converted by comparing
                                            the records of a short-period seismometer that was set closely at these measurement points. (c) Amplitude
                                            spectrum of the volcanic earthquake. Large amplitude signals that continue from the beginning to the end at
                                            several measurement points shown in (a) are noise generated by moving cars. The numbers shown at the left in
                                            (a) and (b) represent the measurement points.

          Scientific Reports |   (2021) 11:6319 |               https://doi.org/10.1038/s41598-021-85621-8                                                 4

Vol:.(1234567890)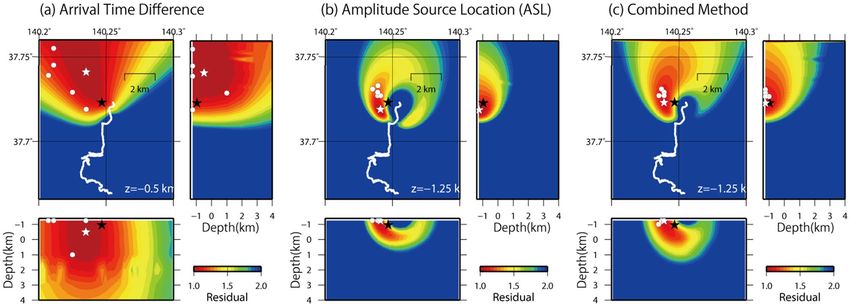
www.nature.com/scientificreports/
Figure 3. Source locations of the six volcanic earthquakes and spatial distribution of the residual between
the observed and theoretical values for a volcanic earthquake at 12h35m on July 4, 2019. (a) Arrival time
differences, (b) seismic amplitudes, and (c) combined method. White stars represent the estimated source
locations of the earthquake on July 4 and white circles do those for the other five earthquakes. Black stars
indicate the hypocenter obtained by routine hypocenter determination. White lines indicate the location of the
fiber-optic cable. The residuals in (a) and (b) are normalized by the minimum residual for each method. The
residual in (c) is S in Eq. (2). This figure was created by Generic Mapping Tools (GMT) v4.5.539.
attenuation8. This method also supposes isotropic radiation of the seismic waves from a source. The source
mechanisms are unknown for the volcanic earthquakes we analyzed, and even low-frequency volcanic earth-
quakes that are often expressed by a volumetric source such as a tensile c rack27 may not isotropically radiate
seismic waves. But, observed seismic waves may be approximated to be isotropically radiated from a source
location28 because recent analyses of heterogeneous structures at active volcanoes indicate a highly heterogene-
ous shallow subsurface showing scattering mean free paths of approximately 1 km29,30. Hence, we represent the
seismic amplitude A at a distance r from the source as
Ai A0 ωri
Ai = = exp − , (1)
Ci ri 2βQ
where Q is the quality factor for attenuation, ω is the angular frequency, β is the S-wave velocity, A0 is the seismic
amplitude at the source, Ci is the site amplification factor, and the subscript i indicates the measurement point.
Site amplification factors are determined from analyses of coda waves for regional tectonic earthquakes (Methods,
Estimation of site amplification factor).
We read the maximum amplitudes for the volcanic earthquake at all measurement points along the fiber-optic
cable and correct them using Ci to obtain Ai . It is necessary to refine the amplitude by taking into account the
difference between the fiber-cable direction and the seismic wave oscillation direction. However, the observed
waves are inferred to be strongly scattered and therefore incident from many directions, as discussed in Discus-
sion. Hence, such a correction is not applied in the following analyses. We assume an S-wave velocity β of 3 km/s
based on the velocity structure used in the routine hypocenter determination. We examine Q of 10–100 and the
results do not change so much. In the following analyses, we use a Q value of 20 that well explains the observa-
tion results. The residuals between Ai and the theoretical values are calculated for all grid points (Fig. 3b). The
grid point with the smallest residual is determined as the best-fit location.
The source locations are determined at a very shallow depth of − 1.25 km beneath Jododaira. The source loca-
tions extend in the north–south direction, but seems to be less scattered than those determined by the arrival
time difference method (Fig. 3b). Contrary to the residual distribution obtained using the arrival time difference
method, a small residual region extends both to the east and west sides of the fiber-optic cable. The source depth
appears to be well resolved as the residual becomes lager with depth, because the cable is deployed close to the
source location (Figure S3).
Combined method. In order to improve the spatial resolutions of the source location determined by the
two methods, which is determined by the configuration of the fiber-optic cable and the data quality, we combine
the two results based on the least squares method. We normalize the residuals separately using the minimum
residual for each method and calculate the total residual at each grid point:
N Na
1
t
(Ot,i − Ct,i )2
(Oa,i − Ca,i )2
S= + (2)
2 i
σt2 i
σa2
where O and C indicate the observed and theoretical values, respectively, σ 2 is the minimum residual (vari-
ance), N is the total number of data points, and the subscripts t and a indicate the arrival time difference and
Scientific Reports | (2021) 11:6319 | https://doi.org/10.1038/s41598-021-85621-8 5
Vol.:(0123456789)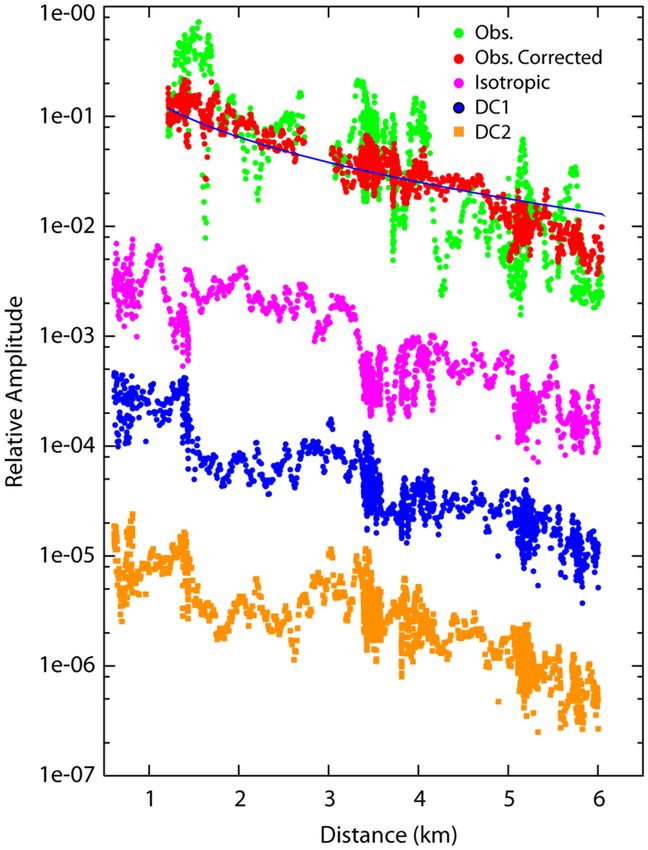
www.nature.com/scientificreports/

                                            Figure 4.  Comparison of the observed and theoretical arrival time differences for the best location for the July
                                            4 earthquake. The measurement point differences are 30.6 m (left), 51 m (middle), and 71.4 m (right). Large
                                            station numbers represent locations close to Jododaira.

                                            amplitude, respectively. Figure 3c shows the spatial distribution of the source locations of the six volcanic earth-
                                            quakes determined by the combined method. They are distributed at very shallow depth (− 1.25 km) beneath
                                            Jododarira. The horizontal extension is about 1 km and 0.5 km in the north–south and east–west directions,
                                            respectively. The extension is seen to be smaller than those independently determined from arrival time differ-
                                            ences and amplitudes.
                                                Figure 4 compares the observed and theoretical arrival time differences calculated for the best source location
                                            for the July 4 earthquake. The observed data are well reproduced by the theoretical data, although the observed
                                            data are scattered. Figure 5 compares the observed and theoretical seismic amplitudes for the July 4 earthquake.
                                            The observed amplitudes corrected by site amplification factors, which gradually decrease with distance from
                                            the epicenters for the best source location, are well explained by the theoretical amplitudes. Note that the site
                                            amplification correction greatly reduces the fluctuations in the seismic amplitudes, which enable us to reliably
                                            determine the source location.

          Scientific Reports |   (2021) 11:6319 |                https://doi.org/10.1038/s41598-021-85621-8                                                     6

Vol:.(1234567890)
www.nature.com/scientificreports/
Figure 5. Comparison of the observed and theoretical amplitudes predicted for the best location for the July 4
earthquake. Green and red circles indicate the observed amplitude of dynamic strains and site factor corrected
amplitudes, respectively. The black line indicates the theoretical prediction for the best location. Purple, blue,
and orange symbols indicate theoretical amplitudes calculated by numerical simulations using an isotropic
mechanism and two kinds of double-couple source mechanism. The theoretical amplitudes are shifted so as not
to overlap each other.
The hypocenters by the combined method are much affected by the ASL but less by the arrival time differ-
ence method for the six earthquakes we analyzed. This may suggest the usefulness of ASL, but the hypocenters
by the combined method are concentrated in a smaller region. As shown in Methods (Source location errors),
the spatial resolutions of the two methods depend on the source locations. Also, at other volcanoes, we need
to use a fiber optic cable with different configuration. Hence, in the present study, we discuss the hypocenters
determined by the combined method in the followings.
The source locations can be determined almost in real time using a standard PC with a Unix system by cal-
culating the arrival time differences for all grid points beforehand.
Subsurface structure obtained from analyses of regional tectonic earthquakes
The heterogeneity of the shallow structure of a volcano may also be clarified from the fiber-optic cable and DAS
observations, as has been reported for different volcanic fi elds16. Figure 6 shows the site amplification factors
estimated from coda wave analyses of regional tectonic earthquakes, which are used to correct the seismic
amplitudes of the six volcanic earthquakes in Amplitude source location method. Small and large site amplifica-
tion factors represent hard and soft subsurfaces, respectively. The site amplification factors are plotted on a red
relief map emphasizing the topographic characteristics31. The site amplification factors are large in the northern
parts of the cable for measurement point numbers (MPNs) larger than 500. This area is close to several active
volcanoes at Azuma-Kofuji, Higashi-Azuma, and Takayama, and is characterized by a gentle slope consisting of
pyroclasts and/or old lava flows. Closely looking at the map, we find large site amplification factors are located
around the fronts of old lava flows that are recognized as robes extending from Higashi-Azuma (see the regions
around MPNs 500–1100, MPNs 1180–1280). Large site amplification factors around MPN1330 are matched with
the locations where sediments are accumulated. On the other hand, the southern area for MPNs smaller than
approximately 500, which is far from these volcanoes, shows low site amplification factors. Since the region is
located close to a valley and river (Fig. 6), small site factors may be related to erosion of the subsurface deposits
by rainfall. Similar characteristics are also seen in the northern part, and a measurement point with an MPN of
around 1150 showing relatively small site factors is located close to a small valley between Azuma-Kofuji and
Takayama (see Fig. 1).
Scientific Reports | (2021) 11:6319 | https://doi.org/10.1038/s41598-021-85621-8 7
Vol.:(0123456789)www.nature.com/scientificreports/
Figure 6. Site amplification factors along the fiber-optic cable. Logarithmic amplitudes of the factors are
indicated by color contours. The black circles and corresponding numbers along the cable indicate the
measurement point numbers. Back ground is a red relief map31 emphasizing topography of the volcano provided
by the Geospatial Information Authority of Japan, which shows robes of old lava flows extending from the active
volcanoes and steep valleys in the southern part.
The volcano topography may influence the site amplification factors, because the shapes of the mountain and
valley introduce focusing and/or defocusing phenomena of seismic wave propagation. We conducted numerical
simulation of seismic wave propagation at the frequency band of 2–6 Hz, in which S-wave is vertically incident to
the volcano, and measured root mean square amplitudes of the coda waves along the cable (Methods, Numerical
simulation of seismic wave propagation). The results show that the simulated site amplification factors do not
reproduce the amplitudes and spatial variations of the observed site amplification factors (Figure S5). This implies
that the observed site amplification factors represent the characteristics of the subsurface structure of the volcano.
Discussion
The volcanic earthquake on July 4 was routinely determined from analyses of the onsets of P- and S-waves at
the permanent stations (Fig. 1), although the others are not because of unclear P- and S waves. The hypocenter
of July 4 is well matched with the location where the minimum residual is obtained by the combined method
(Fig. 3). The mismatch is approximately 500 m in horizontal direction and 250 m in depth. Such spatial resolution
may enable us to relate the source locations with volcanic activity at the ground surface (e.g., eruption locations,
main craters, and fumarolic area). The horizontal extension of the six earthquakes is about 1 km in horizontal
directions. This is almost comparable to that of the hypocenters determined from P- and S-wave onsets, suggest-
ing the usefulness of hypocenter determination using fiber optic cable and DAS. If the fiber optic cable was set
surrounding the hypocentral regions, the misfits between the source locations determined by our method and
those by the routine hypocenter determination come to be smaller as suggested from the simulation (Methods,
Source location errors; Figure S6). Also, the use of a 3D seismic velocity model may reduce the misfits. Although
the present study only examined six volcanic earthquakes because there was no volcanic tremor during the
observation period, the method can be used to determine the source locations of volcanic tremors that show
obscure P- and S-waves or continuous oscillations.
Fiber-optic cables can be buried so that we may continuously record the ground motion, even when pyroclasts
and volcanic ash fall on the flank of volcanoes during explosive eruptions, which often destroys conventional
permanent stations that use radio or Wi-Fi to transfer the signals to the data center. Also, malfunctions due
to thunder, which often occurs in mountain areas, are expected to be greatly reduced in comparison with an
Scientific Reports | (2021) 11:6319 | https://doi.org/10.1038/s41598-021-85621-8 8
Vol:.(1234567890)www.nature.com/scientificreports/
observation system using electric cables and moving-coil-type seismometers. These advantages, as well as the abil-
ity to determine the source locations and site amplification factors, indicate the usefulness of observations using
fiber-optic cable and the DAS system for monitoring volcanic seismicity and understanding volcano structures.
Particle orbits of the ground motion at 4 Hz, which are retrieved from three-component short-period or
broadband seismometers, show complicated spheroidal shapes at the permanent stations located at a distance of
greater than approximately 1 km from the hypocenter (Figure S4). This implies that seismic waves scattered by
the heterogeneous structure arrive at the seismic stations from many directions. Since the measurement points
along the fiber-optic cable are located at distances far greater than approximately 1 km, the observed dynamic
strain signals consist primarily of scattered waves that reduce the effects of the direction of the fiber-optic cable.
This enables us to apply the ASL method for the data recorded by DAS without correction for the direction of
the fiber-optic cable.
In Fig. 5, we show several cases of seismic wave amplitudes calculated from numerical simulations in which
the volcano topography is taken into account (Methods, Numerical simulation of seismic wave propagation).
Three types of source mechanism are assumed at the hypocenter of the volcanic earthquakes. All of the simulation
results show that the seismic amplitudes have local fluctuations, especially at epicentral distances of approxi-
mately 3.5–4 km and 5.2 km, and that they decay with distance. These local fluctuation characteristics are mainly
observed at measurement points in regions with steep flanks, suggesting the effects of topography and/or the
directions of fiber-optic cable. We also find that the theoretical seismic amplitudes at an epicentral distance of
less than approximately 3 km differ for the three source mechanisms. The permanent stations located very close
to the hypocenter (TU.JDD and V.AZHH in Figure S4) appear to show rectilinear particle orbits compared with
the other stations at longer hypocenter distances, which suggests weak effects of the scattered waves and/or domi-
nance of the near-field term. These results suggest the possibility of source mechanism estimation by analyzing
data from nearby measurement points. If the fiber-optic cable is deployed close to the source regions and/or
long-period waves are u sed32, it may be possible to apply the moment tensor inversion technique to determine
the source mechanism for volcanic earthquakes, as has been done for the permanent station data. Stacking the
waveforms along the fiber optic cable by taking into account the radiation pattern of source mechanism and the
direction of fiber optic cable may also enable us to determine the source location.
Finally, we describe several applicability of fiber-optic observation with the DAS system to the evaluation of
volcanic phenomena and other geological features. Calculating the relative amplitudes of coda waves of regional
earthquakes can be used to evaluate the subsurface structure along the fiber optic cable in a fine scale not only
at active volcanoes but also various geological settings such as active faults, sedimental layers and eroded rock
sites. Estimated site amplification factors can be also used to quantitatively evaluate strong ground motions
excited by large earthquakes. The method and analyses used in the present study may be applied to non-volcanic
earthquakes and tremors occurring at plate boundaries, most of which also show emergent onsets of P- and
S-waves33,34. Also, various kinds of geological phenomena such as debris flow after heavy rains and land slide are
spatio-temporally located as migrations of the seismic sources. Development of broadband seismic observations
using the DAS system, from a short period (1 s) to a very long period (10 s) as well as ground deformation can
be useful in order to understand volcanic earthquakes and tremor, and various kinds of geological phenomena.
Methods
Observation using fiber‑optic cable and the DAS system. We placed a heterodyne Distributed
Vibration Sensing system (hDVS) by S chlumberger35 at the southern end of the fiber-optic cable (single mode),
at Tsuchiyu station. The fiber-optic cable is maintained by the Ministry of Land, Infrastructure, Transport and
Tourism (MLIT) to transfer various kinds of data that are used to monitor factors such as the road condition,
meteorological information, and the activity of the crater. The fiber-optic cable is placed in corrugated hard poly-
ethene pipes (FEP) embedded at a depth of approximately 50 cm. We continuously recorded dynamic strain in
the direction along the cable with a sampling frequency of 1000 Hz, a spatial interval of 10.2 m, and a gage length
of 40.8 m. We selected these parameters to measure phase differences for the dominant waves of volcanic earth-
quakes and tremors with a frequency of a few hertz and a wavelength of a few hundred meters. We performed a
tap test to confirm the measurement point number at the location at which we artificially excited ground motion
by hitting the ground surface. A total of 1383 channels were saved on hard disks every 30 s in SEGY format. The
output of the hDVS system is the phase difference, which is proportional to the dynamic strain along the fiber.
The strain signals (e.g., in Fig. 2; Figure S1 and S9) are converted to ground velocity16,18 by comparing the strain
signal amplitude with the ground velocity measured by a short-period (0.5 s) seismometer that was installed at
the site close to MNPs 0445, 1027, and 1268.
Routine hypocenter determination using permanent station data. Volcanic earthquakes at
Azuma volcano show various waveforms with dominant frequencies of up to about 10 Hz, sometimes accompa-
nied by longer-period waves. Most of the waveforms show emergent onsets of P-waves and/or unclear S-waves,
but some are accompanied by clear P- and/or S-waves. We routinely determine the hypocenters of volcanic
earthquakes using P-wave and S-wave onsets. The hypocenters shown in Fig. 1 are those determined by using
at least seven P- and S-wave onsets at more than five permanent stations, and their hypocenter location errors
are about 150 m. The velocity structure shown in Figure S2 was used for hypocenter determination based on the
P- and S-wave arrival times.
Source location errors. The spatial distribution of seismic networks constrains the spatial resolution of
hypocenters. Ideally, surrounding the hypocenter improves the horizontal accuracy, and stations just above
the hypocenter constrain the depth. To observe active volcanoes, the fiber-optic cable should be placed above
Scientific Reports | (2021) 11:6319 | https://doi.org/10.1038/s41598-021-85621-8 9
Vol.:(0123456789)www.nature.com/scientificreports/
and surrounding the expected hypocenter location, but it may be necessary to use existing fiber-optic cables
deployed along roads, which are not ideal for seismic observation. Here, we discuss the spatial resolution for
hypocenter determination, using the configuration of the fiber-optic cable at Azuma volcano. This cable runs
primarily in the north–south direction and is winding in some places, especially in the southern part. We placed
nine pseudo hypocenters at a depth of − 1 km around the fiber-optic cable. When the hypocenter is located
close to the fiber-optic cable, the resolution becomes good for the arrival time difference method. On the other
hand, when the hypocenter is located far from the fiber-optic cable, the errors are large far from the cable (Fig-
ure S6). The resolution is not good in the east–west direction for the ASL method (Figure S7). The arrival time
differences can constrain the location roughly in the east–west direction and the amplitude in the north–south
direction. In other words, we may determine the source locations for volcanic earthquakes and tremors by the
combined use of these two methods, even when the fiber-optic cable does not surround their source locations.
Measurement of arrival time difference. Since the fiber-optic cable covers a long distance, we have
many choices for the interval distance of a pair of measurement points, for which the arrival time difference is
calculated. We set the maximum interval distance to be approximately one quarter the wavelength of the waves
to stably measure the arrival time differences from correlated waveforms. We analyzed the waveforms for a pair
of measurement points located within a distance of 90 m along the cable, which is approximately one fourth of
the wavelength at 4 Hz of the S-wave. In order to examine waveform correlations, we used waveforms with a
coherence of greater than 0.5. Since the dynamic strain signals at measurement points with different cable direc-
tions may show different polarity, we used only the pairs of measurement points for which the cable directions
were matched with each other within less than 30°.
We calculated nine arrival time differences for a pair of measurement points within 91.8 m along the cable.
Then, we determine which intervals were suitable, applying the following procedure. (1) We prepared data for
nine intervals from 10.2 to 91.8 m in steps of 10.2 m. (2) We obtained the best location and evaluated the vari-
ance reduction for each interval. (3) We removed data for intervals for which the variance reduction was less
than 10%. (4) The process was then repeated from step (2). The processes from (2) to (4) are terminated when
the variance reduction was greater than 10%. We analyzed the volcanic earthquake on July 4, and determined the
intervals of 30–70 m for the measurement of arrival time difference for all the volcanic earthquakes we analyzed.
Estimation of site amplification factor. Coda waves, which follow the direct S-waves, are uniformly
spatially distributed when the heterogeneous structure sufficiently scatters the seismic waves36. The site amplifi-
cation factors were estimated by measuring the relative amplitude of the coda wave at target sites with respect to
the reference station37. Since large earthquakes accompany coda waves long enough for the analyses, we consid-
ered 11 tectonic earthquakes with magnitudes of larger than or equal to 3 that occur within a distance of approxi-
mately 50–200 km and a depth of approximately 10–100 km. Figure S8 shows the epicentral maps and Figure S9
represents seismic records of these earthquakes at MNP800. We calculated the root mean square amplitudes at
the measurement points along the cable, and compared them to that at the reference point (MP1027 where a
seismometer was temporally placed). We generally used coda waves with a lapse time of larger than twice the
direct S-wave travel time36 in order to reduce the effects of the radiation pattern of S-waves. Since the tectonic
earthquakes we analyzed are located far from Azuma volcano, the effects of the radiation pattern were very
small. We estimated the relative amplitudes for lapse times of 0–50 s every 5 s and the averaged amplitude at each
measurement point is used as site amplification factors in our analyses.
We calculate the relative amplitudes for different lapse times (approximately 0–50 s) obtained from the arrival
times of S-waves at 2–6 Hz. The standard deviations of the relative amplitudes are quite small, which shows that
the site factors are reliably evaluated (Figure S10). The site amplification factor changes along the fiber-optic cable
with an order of approximately 1 on the logarithmic scale. This suggests that this correction is quite important
for hypocenter determination using the ASL method.
Numerical simulation of seismic wave propagation. We numerically calculated seismic waves from
a source in order to evaluate the effect of volcano topography on the seismic wave amplitude using the finite
difference method38. Dynamic strains of 2–6 Hz are calculated at the measurement points along the fiber optic
cable. We set the topography of Azuma volcano using a 5-m digital elevation model in a calculation region of
15 km × 15 km × 5 km. The grid size was set to 5 m. The depth of the receivers was set to 20 m from the surface
in order to avoid instability in the strain calculations.
For the simulation to examine the effect of topography in Subsurface structure obtained from analyses of
regional tectonic earthquakes, we used a velocity structure with a constant P-wave velocity of 5.1 km/s and S-wave
velocity of 3 km/s. S-wave is vertically incident from the bottom of calculation domain.
For calculating the amplitude distributions of seismic sources beneath Jododaira, we simplified the veloc-
ity structure (Figure S2) into four layers. Velocity boundaries were parallel to the topography, and their depths
were 1.0, 2.1, and 3.1 km from the free surface. Random velocity fluctuations were superimposed on the top
layer because some previous studies showed strong short-wavelength heterogeneity in shallow regions29,30. An
exponential autocorrelation function with a characteristic scale of 0.1 km and a root mean square fractional
fluctuation of 0.1 was used to represent the heterogeneity. The hypocenter was set at a depth of − 1 km beneath
Jododaira. Three types of source mechanism were assumed: (1) isotropic source, (2) DC1: a double-couple source
with a strike of 70°, a dip of 70°, and a rake of 0°, and (3) DC2: a double-couple source with a strike of 0°, a dip
of 90°, and a rake of 0°.
Scientific Reports | (2021) 11:6319 | https://doi.org/10.1038/s41598-021-85621-8 10
Vol:.(1234567890)www.nature.com/scientificreports/
Data availability
Due to the very large size of the fiber-optic data, the decimated digital data are available upon request.
Received: 18 July 2020; Accepted: 9 February 2021
References
1. Taisne, B., Brenguier, F., Shapiro, N. M. & Ferrazzini, V. Imaging the dynamics of magma propagation using radiated seismic
intensity. Geophys. Res. Lett. 38, L04304. https://doi.org/10.1029/2010GL046068 (2011).
2. Kurokawa, A., Takeo, M. & Kurita, K. Two types of volcanic tremor changed with eruption style during 1986 Izu-Oshima eruption.
J. Geophys. Res. 121, 2727–2736 (2012).
3. Chouet, B. A. Long-period volcano seismicity: Its source and use in eruption forecasting. Nature 380, 309–316 (1996).
4. Nishimura, T. & Iguchi, M. Volcanic Earthquakes and Tremor in Japan (Kyoto University Press, 2011).
5. Zobin, V. M. Introduction to Volcanic Seismology (Elsevier, Amsterdam, 2016).
6. Chouet, B. et al. Source and path effects in the wavefields of tremor and explosions at Stromboli Volcano, Italy. J. Geophys. Res.
102, 15129–15150 (1997).
7. Matsumoto, S. et al. Short-term spatial change in a volcanic tremor source during the 2011 Kirishima eruption. Earth Planet Space
65, 323–329 (2013).
8. Battaglia, J. & Aki, K. Location of seismic events and eruptive fissures on the Piton de la Fournaise volcano using seismic amplitudes.
J. Geophys. Res. https://doi.org/10.1029/2002JB002193 (2003).
9. Kumagai, H. et al. Broadband seismic monitoring of active volcanoes using deterministic and stochastic approaches. J. Geophys.
Res. 115, B08303. https://doi.org/10.1029/2009JB006889 (2010).
10. Ballmer, S., Wolfe, C. J., Okubo, P. G., Haney, M. M. & Thurber, C. H. Ambient seismic noise interferometry in Hawai’i reveals
long-range observability of volcanic tremor. Geophys. J. Int. 194, 512–523 (2013).
11. Droznin, D. V. et al. Detecting and locating volcanic tremors on the Klyuchevskoy group of volcanoes (Kamchatka) based on
correlations of continuous seismic records. Geophys. J. Int. 203, 1001–1010 (2015).
12. Permana, T., Nishimura, T., Nakahara, H., Fujita, E. & Ueda, H. Reliability evaluation of volcanic tremor source location determi-
nation using cross-correlation functions. Geophys. J. Int. 220, 1300–1315 (2020).
13. Zhan, Z. Distributed acoustic sensing turns fiber-optic cables into sensitive seismic antennas. Seismol. Res. Lett. 91, 1–15 (2019).
14. Ajo-Franklin, J. B. et al. Distributed acoustic sensing using dark fiber for near-surface characterization and broadband. Sci. Rep.
9, 1328. https://doi.org/10.1038/s41598-018-36675-8 (2019).
15. Dou, S. et al. Distributed acoustic sensing for seismic monitoring of the near surface: A traffic-noise interferometry case study.
Sci. Rep. 7, 11620. https://doi.org/10.1038/s41598-017-11986-4 (2017).
16. Jousset, P. et al. Dynamic strain determination using fibre-optic cables allows imaging of seismological and structural features.
Nat. Commun. 9, 2509. https://doi.org/10.1038/s41467-018-04860-y (2018).
17. Martin, E. R. et al. Seismic monitoring leveraging existing telecom infrastructure at the SDASA: Active, passive, and ambient-noise
analysis. Lead. Edge 36, 1025–1031 (2017).
18. Spica, Z. J., Perton, M., Martin, E. R., Beroza, G. C. & Biondi, B. Urban seismic site characterization by fiber-optic seismology. J.
Geophys. Res. 125, e2019JB018656. https://doi.org/10.1029/2019JB018656 (2020).
19. Yu, C., Zhan, Z., Lindsey, N. J., Ajo-Franklin, J. B. & Robertson, M. The potential of DAS in teleseismic studies: Insights from the
Goldstone experiment. Geophys. Res. Lett. 46, 1320–1328 (2019).
20. James, S. R. et al. Fracture detection and imaging through relative seismic velocity changes using distributed acoustic sensing and
ambient seismic noise. Lead. Edge https://doi.org/10.1190/tle36121009.1 (2017).
21. Li, Z. & Zhan, Z. Pushing the limit of earthquake detection with distributed acoustic sensing and template matching: A case study
at the Brady geothermal field. Geophys. J. Int. 215, 1583–1593 (2018).
22. Takano, T., Brenguier, F., Campillo, M., Peltier, A. & Nishimura, T. Noise-based passive ballistic wave seismic monitoring on an
active volcano. Geophys. J. Int. 220, 501–507 (2020).
23. Japan Meteorological Agency (JMA). National catalogue of the active volcanoes in Japan (4th edn). https://www.data.jma.go.jp/
svd/vois/data/tokyo/STOCK/souran_eng/menu.htm (2013).
24. Yoshida, Y. et al. Crustal deformation observed by GPS around Azuma Volcano. Q. J. Seismol. 76, 1–8 (2012) (in Japanese with
English abstract).
25. Japan Meteorological Agency (JMA). Activity of Azuma volcano in 2019. Bull. Volcan. Activ. (in Japanese). https://www.data.jma.
go.jp/svd/vois/data/tokyo/STOCK/monthly_v-act_doc/sendai/2019y/213_19y.pdf (2020).
26. Watanabe, A. Determination of earthquake magnitude at regional distance in and near Japan. Bull. Seismol. Soc. Jpn. 24, 189–200
(1971) (in Japanese with English abstract).
27. Nakano, M., Kumagai, H. & Chouet, B. A. Source mechanism of long-period events at Kusatsu-Shirane Volcano, Japan, inferred
from waveform inversion of the effective excitation functions. J. Volcanol. Geotherm. Res. 122, 149–164 (2004).
28. Kumagai, H., Saito, T., O’Brien, G. & Yamashina, T. Characterization of scattered seismic wavefields simulated in heterogeneous
media with topography. J. Geophys. Res. 116(1), B03308. https://doi.org/10.1029/2010JB007718 (2011).
29. Yamamoto, M. & Sato, H. Multiple scattering and mode conversion revealed by an active seismic experiment at Asama volcano,
Japan. J. Geophys. Res. 115, B07304. https://doi.org/10.1029/2009JB007109 (2010).
30. Hirose, T., Nakahara, H. & Nishimura, T. A passive estimation method of scattering and intrinsic absorption parameters from
envelopes of seismic ambient noise cross-correlation functions. Geophys. Res. Lett. 46, 3634–3642 (2019).
31. Chiba, T., Suzuki, Y. & Hiramatsu, T. Digital terrain representation methods and red relief image map, a new visualization approach.
J. Jpn. Cartogr. Assoc. 45–1, 27–36 (2007).
32. Jin, G. & Roy, B. Hydraulic-fracture geometry characterization using low-frequency DAS signal. Lead. Edge https://doi.org/10.
1190/tle36120975.1 (2017).
33. Maeda, T. & Obara, K. Spatiotemporal distribution of seismic energy radiation from low-frequency tremor in western Shikoku,
Japan. J. Geophys. Res. https://doi.org/10.1029/2008JB006043 (2009).
34. Obara, K. Nonvolcanic deep tremor associated with subduction in southwest Japan. Science 296, 1679–1681 (2002).
35. Hartog, A. H. et al. The use of multi-frequency acquisition to significantly improve the quality of fibre-optic distributed vibration
sensing. Geophys. Prosp. 66, 192–202 (2018).
36. Sato, H., Fehler, M. & Maeda, T. Seismic Wave Propagation and Scattering in the Heterogeneous Earth 2nd edn. (Springer, 2012).
37. Phillips, W. S. & Aki, K. Site amplification of coda waves from local earthquakes in central California. Bull. Seismol. Soc. Am. 76(3),
627–648 (1986).
38. Maeda, T., Takemura, S. & Furumura, T. OpenSWPC: An open-source integrated parallel simulation code for modeling seismic
wave propagation in 3D heterogeneous viscoelastic media. Earth Planets Space 69(1), 102. https://doi.org/10.1186/s40623-017-
0687-2 (2017).
Scientific Reports | (2021) 11:6319 | https://doi.org/10.1038/s41598-021-85621-8 11
Vol.:(0123456789)www.nature.com/scientificreports/
39. Wessel, P. & Smith, W. H. F. New, improved version of Generic Mapping Tools released. Eos Trans. Am. Geophys. Union 79, 579
(1998).
Acknowledgements
The DAS observations were supported by the Fukushima River and National Highway Office, Tohoku Regional
Bureau, Ministry of Land, Infrastructure, Transport and Tourism (MLIT). We used a red relief image map of
Azuma volcano provided by the Asia Air Survey, Myanmar Co., and MLIT. The digital elevation model used in
the numerical simulations was provided by the Geospatial Information Authority of Japan. The present study
was supported in part by ERI JURP 2020-S-04. The numerical simulations were conducted using a Fujitsu PRIM-
ERGY CX600M1/CX1640M1 (Oakforest-PACS) in the Information Technology Center, University of Tokyo. We
used seismic data of Japan Meteorological Agency. This study was partly supported by the Ministry of Education,
Culture, Sports, Science and Technology (MEXT) of Japan, under its Observation and Research Program for Pre-
diction of Earthquakes and Volcanic Eruptions. Some figures were made using Generic Mapping Tools (GMT).
Author contributions
T.N. guided the experiment, analyzed the seismic data, and wrote the first draft and final version of the manu-
script. K.E. conducted numerical simulations of seismic wave propagation. K.E. and H.N. planned and designed
the experiment and managed the data server. M.Y. and S.M. analyzed the volcanic earthquakes using permanent
stations of Tohoku University and the Japan Meteorological Agency. S.S. and A.I. supported the experiment and
data conversion. T.K. supported the operation of the DAS system and checked the data quality.
Competing interests
The authors declare no competing interests.
Additional information
Supplementary Information The online version contains supplementary material available at https://doi.org/
10.1038/s41598-021-85621-8.
Correspondence and requests for materials should be addressed to T.N.
Reprints and permissions information is available at www.nature.com/reprints.
Publisher’s note Springer Nature remains neutral with regard to jurisdictional claims in published maps and
institutional affiliations.
Open Access This article is licensed under a Creative Commons Attribution 4.0 International
License, which permits use, sharing, adaptation, distribution and reproduction in any medium or
format, as long as you give appropriate credit to the original author(s) and the source, provide a link to the
Creative Commons licence, and indicate if changes were made. The images or other third party material in this
article are included in the article’s Creative Commons licence, unless indicated otherwise in a credit line to the
material. If material is not included in the article’s Creative Commons licence and your intended use is not
permitted by statutory regulation or exceeds the permitted use, you will need to obtain permission directly from
the copyright holder. To view a copy of this licence, visit http://creativecommons.org/licenses/by/4.0/.
© The Author(s) 2021
Scientific Reports | (2021) 11:6319 | https://doi.org/10.1038/s41598-021-85621-8 12
Vol:.(1234567890)You can also read