ICSC CenterBuild Retail Update November 2017 Garrick H. Brown Vice President of Retail Research, the Americas
←
→
Page content transcription
If your browser does not render page correctly, please read the page content below

ICSC CenterBuild
Retail Update

November 2017

Garrick H. Brown
Vice President of Retail Research,
the Americas

Garrick.brown@cushwake.com

Agenda

Notes from the “Retail Apocalypse”
Myths and Realities in the Age of newCommerce

•   What is really happening, and why?

•   How this trend will play out in 2018 and beyond?

•   The good, the bad and the really, really ugly… (Who is growing,
    who is shrinking and who is dying?)
                                                                      Is it
                                                                      Really?
Major Retailer Bankruptcies
Through November 2017
                                                                                            Aerosoles
                                       Major Retailer Bankruptcies                        Alfred Angelo
                                                                                        BCBG Max Azria
40.0
                                                                                     Bob’s/Eastern Mountain
                                                                                         Central Grocers
35.0
                                                                                        Gander Mountain
                                                                                           Gordman’s
30.0
                                                                                            Gymboree
                                                                                            HHGregg
25.0
                                                                                              Limited
                                                                                     Marbles: The Brain Store
20.0                                                                                       MC Sports
                                                                                         Papaya Clothing
15.0                                                                                         Payless
                                                                                           Perfumania
10.0                                                                               RadioShack/General Wireless
                                                                                     Romano’s Macaroni Grill
 5.0                                                                                          Rue 21
                                                                                            Toys R Us
 0.0                                                                                      Traffic Shoes
         2007 2008 2009 2010 2011 2012 2013 2014 2015 2016 2017 2018                      True Religion
                                                                                              Vanity
                                       Major Chain Bankruptcies   Forecast Total
                                                                                          Vitamin World
                                                                                             Wet Seal
Source: Cushman & Wakefield Research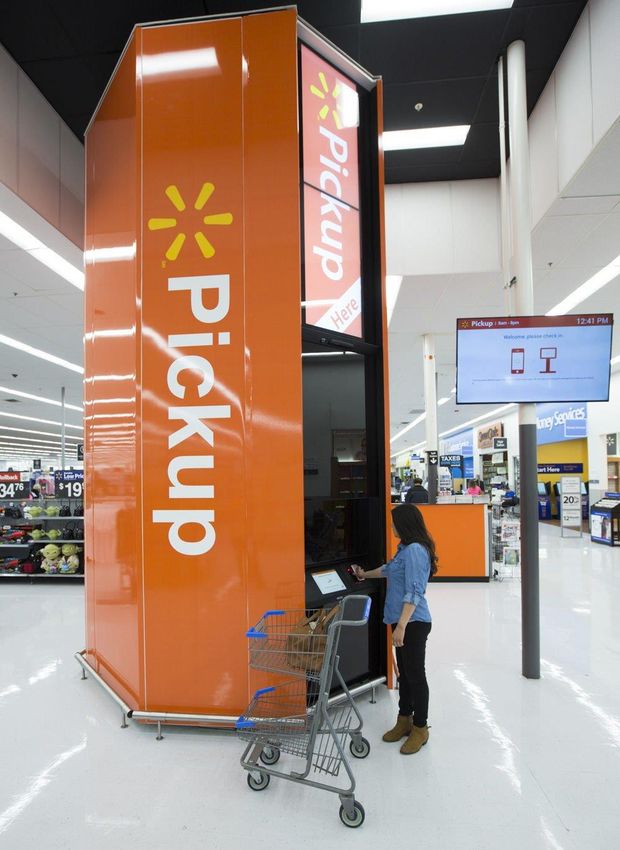
Major Chain Store Closures
Have surpassed great recession levels
                                                                                              What’s Really Happening (it’s not
                                             Major Chain Store Closures                       just about Amazon)?
14,000
                                                                                              Convergence of Four Factors:

12,000                                                                                        1.   Acceleration of newCommerce
                                                                                              2.   Over Retailed Marketplace
10,000                                                                                        3.   Race to the Bottom
                                                                                                   Discounting (Rise of Off-Price)
                                                                                              4.   Shifting Consumer Patterns
 8,000
                                                                                                   (Millennials Spending
                                                                                                   Differently than Past
 6,000                                                                                             Generations)

 4,000

 2,000

       0
            2007 2008 2009 2010 2011 2012 2013 2014 2015 2016 2017 2018 2019
                                       Major Chain Closures   Forecast Major Chain Closures

Source: Cushman & Wakefield Research
Announced Major Chain Closures
Announced retail closures for 2017 & beyond/typical CRE space usage

Retailer                     Type         # Stores      Urban    Cool    Mall &    Power &    Neighborhood Strip
                                          Avg Size      High     Streets Lifestyle Regional   & Community
                                                        Street
Abercrombie &                Apparel               60      X                X
Fitch                                       4 – 7K SF
Aeropostale                  Apparel              154      X                X
                                            2 – 4K SF
Aerosoles                    Shoes                 74      X       X        X         X
                                            2 – 4K SF
Alfred Angelo                Apparel               64      X                X         X
                                            2 – 4K SF
American                     Apparel              110      X       X        X
Apparel                                     2 – 4K SF
Applebee’s                   Restaurant     105 - 135                       X         X            X          X
                             Casual         2 – 5K SF
Ascena Retail                Apparel              400      X                X
Group                                       4 – 8K SF

 Source: Cushman & Wakefield Research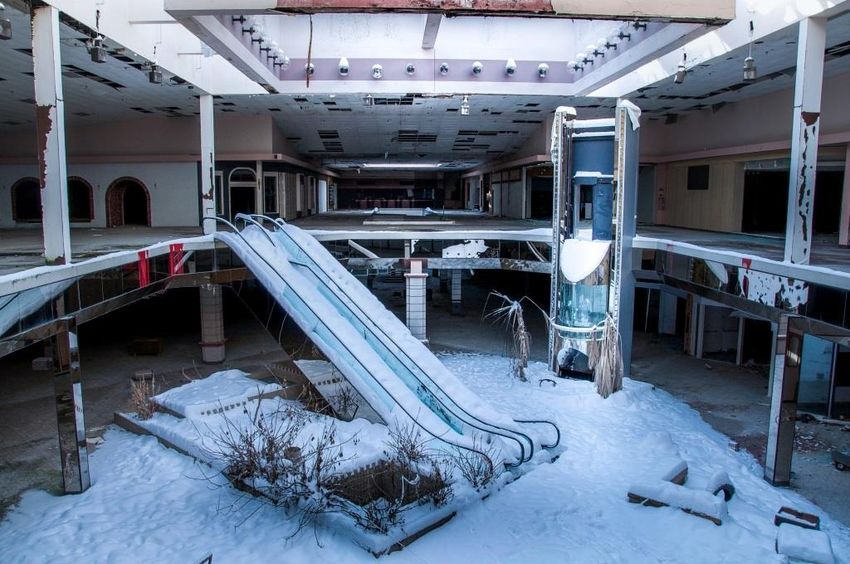
Announced Major Chain Closures
Announced retail closures for 2017 & beyond/typical CRE space usage

Retailer                    Type          # Stores         Urban         Cool    Mall &    Power &                  Neighborhood Strip
                                          Avg Size         High          Streets Lifestyle Regional                 & Community
                                                           Street
BCBG Max Azria              Apparel                120          X                            X
                                             1 – 4K SF
Bebe                        Apparel                180          X                            X
                                             2 – 5K SF
*Bed, Bath &                Home                   15           X             X              X                X
Beyond                                    20 – 40K SF
Benny’s                     Dollar                  31                                                        X          X          X
                            Stores           2 – 5K SF
Best Buy                    Consumer           20 – 40                                       X                X
                            Electronics   25 – 40K SF

                                          *Bed, Bath & Beyond is reportedly simultaneously opening 30 new stores.
Source: Cushman & Wakefield Research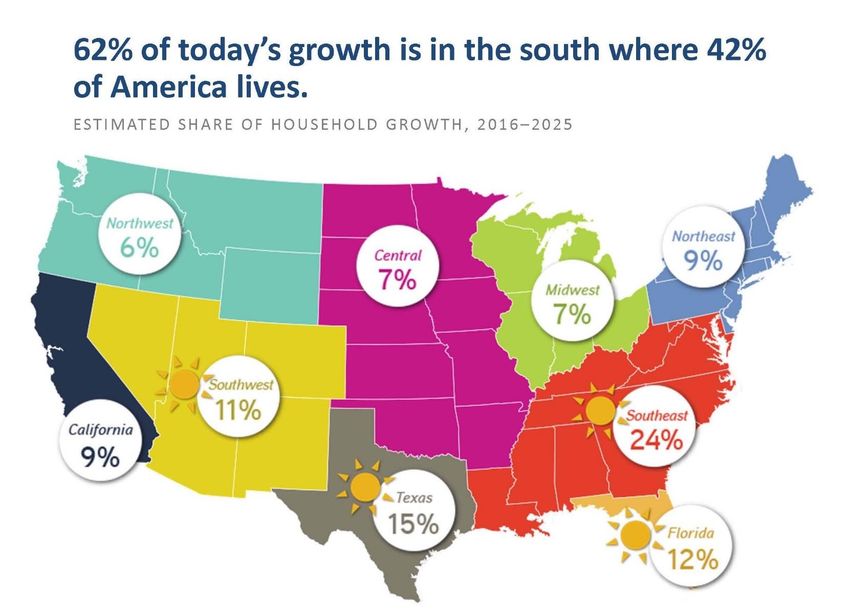
Announced Major Chain Closures
Announced retail closures for 2017 & beyond/typical CRE space usage

Retailer                     Type         # Stores       Urban    Cool    Mall &    Power &    Neighborhood Strip
                                          Avg Size       High     Streets Lifestyle Regional   & Community
                                                         Street
Bloomin Brands               Restaurant       43 – 60       X                X         X            X
                             Casual         3 – 6K SF
Bob’s/Eastern                Sporting              95                        X         X            X
Mountain                     Goods         6 – 24K SF
Book World                   Media                 45                                  X            X          X
                             Books         2 – 10K SF
Charlotte Rousse             Apparel            5 – 10      X                X
                                            2 – 5K SF
Chico’s                      Apparel               50       X                X
                                            3 – 5K SF
Children’s Place             Apparel              100       X                X
                                            2 – 5K SF
Country Curtains             Home                  20                        X         X            X          X
                                            3 – 4K SF
Crocs                        Shoes                160       X                X         X
                                            1 – 4K SF
 Source: Cushman & Wakefield Research
Announced Major Chain Closures
Announced retail closures for 2017 & beyond/typical CRE space usage

Retailer                     Type         # Stores          Urban         Cool    Mall &    Power &                         Neighborhood Strip
                                          Avg Size          High          Streets Lifestyle Regional                        & Community
                                                            Street
Cub Foods                    Grocery               10                                                           X                X
                                          25 – 70K SF
Dillard’s                    Department           2–5                                         X
                             Stores         100 – 200K
Famous                       Shoes                  30          X                             X                 X
Footwear                                     5 – 8K SF
Family Christian             Books                 240                                                          X                X          X
                                             2 – 4K SF
Finish Line                  Shoes                 150          X                             X
                                             3 – 5K SF
*Footlocker/Lady             Shoes                 100          X              X              X
Footlocker                                   2 – 4K SF
Fresh Market                 Grocery               13                                                           X                X
                             Organic      20 – 35K SF

                                          *Footlocker/Lady Footlocker is reportedly simultaneously opening 90 new stores.
 Source: Cushman & Wakefield Research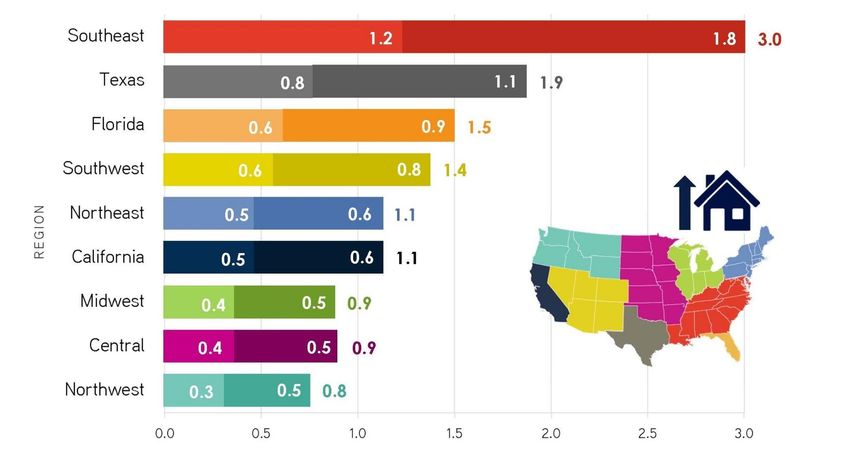
Announced Major Chain Closures
Announced retail closures for 2017 & beyond/typical CRE space usage

Retailer                   Type        # Stores         Urban         Cool    Mall &    Power &                      Neighborhood Strip
                                       Avg Size         High          Streets Lifestyle Regional                     & Community
                                                        Street
GameStop                   Video                190                                      X                X                   X      X
                           Games          1 – 3K SF
Gander                     Sporting             162                                      X                X
Mountain                   Goods        40 – 60K SF
*Gap/Banana                Apparel               200         X                           X                X
Republic                                     8 – 12K
GNC                        Misc..               100          X                           X                X                   X      X
                                          1 – 3K SF
Gordman’s                  Dept.          101 (50 to                                     X                X
                                       Stage Stores)
Guess                      Apparel               50          X                           X
                                          3 – 5K SF

                                       *While closing underperforming Gap and Banana Republic stores, the Gap is ramping up
                                       growth of their Old Navy and Athleta concepts.
Source: Cushman & Wakefield Research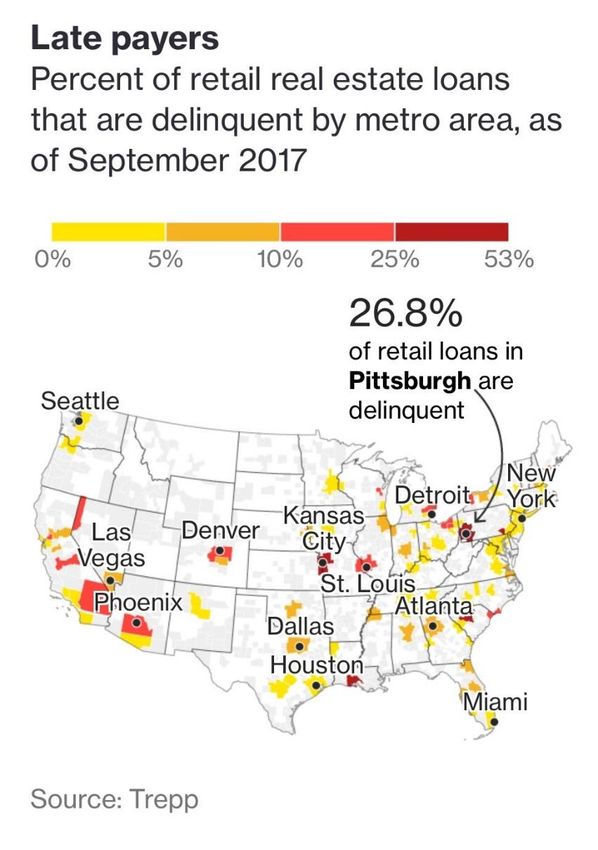
Announced Major Chain Closures
Announced retail closures for 2017 & beyond/typical CRE space usage

Retailer                    Type         # Stores         Urban          Cool    Mall &    Power &                    Neighborhood Strip
                                         Avg Size         High           Streets Lifestyle Regional                   & Community
                                                          Street
Gymboree                    Apparel               350          X                             X
                                            2 – 5K SF
Hancock Fabrics             Misc..                255                                        X                 X
                                          10 – 17K SF
HH Gregg                    Electronic            220                                        X                 X
                                          30 – 50K SF
*Hibbett Sports             Sporting           25 - 35                                       X                 X
                            Goods           5 – 6K SF
**IHOP                      Restaurant         20 - 25                                                         X           X          X
                            Casual          2 – 5K SF
J Crew                      Apparel                50          X                             X
                                            2 – 5K SF
JC Penney                   Department           140                                         X
                            Store         100 – 200K

                                          * Hibbett Sports is reportedly simultaneously opening 50 – 60 new stores.
 Source: Cushman & Wakefield Research     * IHOP is reportedly simultaneously opening 80 – 95 new stores.
Announced Major Chain Closures
Announced retail closures for 2017 & beyond/typical CRE space usage
Retailer Type # Stores Urban Cool Mall & Power & Neighborhood Strip
Avg Size High Streets Lifestyle Regional & Community
Street
Jos A Banks Apparel 85 X X X X
3 – 5K SF
Kings Variety Grocery 19 X X
40 – 80K SF
Kohl’s Department 18 X X
Store 70 – 90K SF
The Limited Apparel 250 X X X
1 – 5K SF
Lucy Apparel 44 X X
1 – 3K SF
Macy’s Department 100 X X
Store 180 – 200K
Marsh Grocery 18 X X
Supermarkets 50 – 125K
SF
Source: Cushman & Wakefield ResearchAnnounced Major Chain Closures
Announced retail closures for 2017 & beyond/typical CRE space usage
Retailer Type # Stores Urban Cool Mall & Power & Neighborhood Strip
Avg Size High Streets Lifestyle Regional & Community
Street
MC Sports Sporting 66 X X X
12 – 45K SF
Michael Kors Apparel 100 X X X
2 – 5K
Naturalizer Shoes 7 X X X
1 – 4K SF
Neiman Marcus Off Price 10 X X X
Last Call Apparel 15 – 30K SF
New York & Co Apparel 30 X X
2 – 5K SF
Office Depot Office 100 X X
20 – 40K SF
Source: Cushman & Wakefield ResearchAnnounced Major Chain Closures
Announced retail closures for 2017 & beyond/typical CRE space usage
Retailer Type # Stores Urban Cool Mall & Power & Neighborhood Strip
Avg Size High Streets Lifestyle Regional & Community
Street
Papaya Clothing Apparel 10 – 80? X X
2 – 4K SF
Payless Shoe Shoe 700 X X X X X
Source 2 – 4K SF
Perfumania Beauty 65 X
Fragrances 1 – 2K SF
Portrait Misc. 63 X X X
Innovations 1 – 2K SF
RadioShack Electronic 1,000 X X X X
1 – 4K SF
Ralph Lauren Apparel 23 X X
2 – 5K SF
Regis Beauty 25 X X X X X
Salons 1 – 4K SF
Source: Cushman & Wakefield ResearchAnnounced Major Chain Closures
Announced retail closures for 2017 & beyond/typical CRE space usage
Retailer Type # Stores Urban Cool Mall & Power & Neighborhood Strip
Avg Size High Streets Lifestyle Regional & Community
Street
Romano’s Restaurant 37 -93 X X
Macaroni Grill Casual 2 – 5K SF
Rue21 Apparel 400 X X X
2 – 5K SF
Save A Lot Grocery 13 X X
20 – 65K SF
Sears/Kmart Dept./ 430 X X X
Discount 80 – 160K
Stage Dept. 20 (+ adding X X
50
Gordman’s)
Staples Office 70 X X X
25 – 45K SF
Teavana Misc.. 379 X X X
1 – 3K SF
Source: Cushman & Wakefield ResearchAnnounced Major Chain Closures
Announced retail closures for 2017 & beyond/typical CRE space usage
Retailer Type # Stores Urban Cool Mall & Power & Neighborhood Strip
Avg Size High Streets Lifestyle Regional & Community
Street
Toys R Toys 200 – 400? X X X
Us/Babies R Us 10 – 40K SF
Traffic Shoes Shoes 12 X X
2 – 4K SF
True Religion Apparel 27 X X X
2 – 6K SF
Vanity Apparel 140 X X
2 – 4K SF
Vitamin World Health 51 X X
Vitamin 1 – 3K SF
Walgreen’s Drug Store 860 X X X
15 – 20K SF
Wet Seal Apparel 171 X X
2 – 4K SF
Source: Cushman & Wakefield ResearchTop Retail Chains in Contraction Mode
Announced bricks-and-mortar closure plans
Closures at Record Levels
Top 20 Major Chain Closures 2017
JC Penney Top Contraction Categories:
Finish Line
Aeropostale
Crocs Consumer Electronics
Gander Mountain
Wet Seal Apparel
bebe
Gamestop
Department Stores
Gap/Banana Republic Consumer Electronics
hhGregg
Family Christian Media (Books, Video, Music,
The Limited Etc.)
Hancock Fabrics
Gymboree Office Supplies
Ascena Retail (various banners) Sporting Goods
rue21
Sears/Kmart
Payless
Walgreens
RadioShack
0 200 400 600 800 1,000 1,200
Announced Major Chain Openings 2017
Source: Cushman & Wakefield ResearchTop Retail Chains in Growth Mode
Announced bricks-and-mortar expansion plans
Value, Value, Value
Top 20 Major Chain Openings 2017
Dollarama Top Expansion Categories:
Sephora
Wendy's
Walmart Dollar Stores
Athleta & Old Navy (the Gap)
Tractor Supply Discount Grocery
Sally Beauty
H&M (All Banners)
Off-Price Apparel
Ross Beauty/Cosmetics
Lidl
ULTA Super Stores (but often in
Five Below smaller sizes—Target)
Retro Fitness
TJX (all banners) Fitness/Health Clubs
AutoZone Fast Food
McDonald's
Starbucks Coffee
Aldi
Dollar Tree Fast Fashion
Dollar General Clicks to Bricks
0 200 400 600 800 1,000 1,200
Announced Major Chain Openings 2017
Source: Cushman & Wakefield ResearchAnnounced Major Chain Openings
Not everyone is shrinking…
Retailer Type # Stores Urban Cool Mall & Power & Neighborhood Strip
Avg Size High Streets Lifestyle Regional & Community
Street
99 Ranch Grocery 5 X X
25 – 50K SF
Academy Sports Sporting 6 X X
Goods 85 – 100K
SF
ALDI Grocery 400 (900 by X X
2022)
15 – 25K SF
Allen Edmonds Shoes 10 X x X
2 – 4K SF
Anthropologie Apparel 10 X X X
4 – 9K SF
Athleta/Old Navy Apparel 240 X X X
4 – 17K SF
AutoZone Automotive 200 X X X
3 – 7K SF
Source: Cushman & Wakefield ResearchAnnounced Major Chain Openings
Not everyone is shrinking…
Retailer Type # Stores Urban Cool Mall & Power & Neighborhood Strip
Avg Size High Streets Lifestyle Regional & Community
Street
Bargain Hunt Dollar 30 X X X
20 – 25K SF
Blink Fitness Health Club 50 X X X X X X
14 – 20k SF
Bed, Bath & Home 30 X X X X
Beyond 20 – 40K SF
Burlington Off-Price 30 X
Apparel 45 – 80K SF
Cabela’s Sporting 50 X
Goods 2 – 4K SF
Carter’s Apparel 5 X X X
Children’s 50 – 75K SF
Source: Cushman & Wakefield ResearchAnnounced Major Chain Openings
Not everyone is shrinking…
Retailer Type # Stores Urban Cool Mall & Power & Neighborhood Strip
Avg Size High Streets Lifestyle Regional & Community
Street
Cheesecake Restaurant 5 – 10 X X
Factory Casual 5 – 10K SF
Chuy’s Restaurant 10 – 15 X X X X X
Fast Casual
Citi Trends Apparel 10 – 20 X X X X
2 – 4K SF
Costco Discount 30 X X
125 – 150K
CVS Drug Store 50 – 70 X X X X X
14 – 18K SF
Dick’s Sporting Sporting 43 X X
Goods Goods 40 – 80K SF
Dogtopia Pet 20 X X X
Supplies 6 – 9K SF
Dollar General Dollar 1,000 X X X
5 – 10K SF
Source: Cushman & Wakefield ResearchAnnounced Major Chain Openings
Not everyone is shrinking…
Retailer Type # Stores Urban Cool Mall & Power & Neighborhood Strip
Avg Size High Streets Lifestyle Regional & Community
Street
Dollar Tree Dollar 650 X X X
7 – 10K SF
Dollarama Dollar 60 – 70 X X X
5 – 10K SF
DSW Shoes 20 X X X
20 – 30K SF
Fallas Discount Discount 20 – 25 X
Stores 13 – 17K SF
Five Below Dollar 100 X X X
5 – 10K SF
Footlocker/Lady Shoes 90 X X X
Footlocker 2 – 4K SF
Fred’s Drug Store 20 – 40 X X X
12 – 18K SF
Source: Cushman & Wakefield ResearchAnnounced Major Chain Openings
Not everyone is shrinking…
Retailer Type # Stores Urban Cool Mall & Power & Neighborhood Strip
Avg Size High Streets Lifestyle Regional & Community
Street
Free People Apparel 12 X X X
4 – 8K SF
H&M (All Apparel 100 X X X
Banners) 4 – 15K SF
Habit Burger Restaurant 30 – 40 X X X X X X
Fast Casual 2 – 4K
Hammer & Nails Beauty 50 X X X X X X
1 – 2K SF
Source: Cushman & Wakefield ResearchAnnounced Major Chain Openings
Not everyone is shrinking…
Retailer Type # Stores Urban Cool Mall & Power & Neighborhood Strip
Avg Size High Streets Lifestyle Regional & Community
Street
Hibbett Sports Sporting 50 - 60 X X
Goods 5 – 6K SF
Home Depot Home DIY 5 – 10 X
100 – 150K
Hobby Lobby Misc.. 60 X X X
40 – 90K SF
Huddle House Restaurant 35 X X
Casual 2 – 4K SF
IHOP Restaurant 80 - 95 X X X
Casual 2 – 5K SF
J. Jill Apparel 15 X X
2 – 5K SF
Source: Cushman & Wakefield ResearchAnnounced Major Chain Openings
Not everyone is shrinking…
Retailer Type # Stores Urban Cool Mall & Power & Neighborhood Strip
Avg Size High Streets Lifestyle Regional & Community
Street
Kirkland’s Home 40 X X
Furnishings 6 – 12K SF
Kroger Grocery 35 X X
40 – 80K SF
LA Fitness Health Club 30 – 40 X X
34 – 42K SF
Lidl Grocery 100 X X X
15 – 25K SF
Lululemon Apparel 40 – 50 X X X
2 – 4K SF
Macy’s Off-Price 30 – 40 X X
Backstage Apparel 25 – 40K SF
Marshall’s Off-Price 35 – 50 X X
Apparel 25 – 35K SF
Source: Cushman & Wakefield ResearchAnnounced Major Chain Openings
Not everyone is shrinking…
Retailer Type # Stores Urban Cool Mall & Power & Neighborhood Strip
Avg Size High Streets Lifestyle Regional & Community
Street
McDonald’s Restaurant 200 X X X X X X
Fast Food 2 – 5K SF
Natural Grocers Misc.. 20 X X
1 – 3K SF
Nordstrom Rack Off-Price 25 – 35 X X X
Apparel 25 – 35K SF
Orchard Supply Home DIY 8 – 16 X X
Hardware 25 – 28K SF
Off Broadway Shoes 4–8 X X
18 – 20K SF
Ollie’s Bargain Discount 30 – 35 X X
Market 25 – 35K SF
O’Reilly Automotive 210 X X X
Automotive 7 -12K SF
Source: Cushman & Wakefield ResearchAnnounced Major Chain Openings
Not everyone is shrinking…
Retailer Type # Stores Urban Cool Mall & Power & Neighborhood Strip
Avg Size High Streets Lifestyle Regional & Community
Street
Party City Misc.. 25 – 30 X X X
10 – 15K SF
PetSense Pets 30 X X X X
4 – 6K SF
Pollo Loco Restaurant 20 – 30 X X X X X X
Fast Casual 2 -5k SF
Publix Grocery 15 -20 X X
40 – 80K
Rack Room Shoes 20 – 30 X X
4 – 6K SF
Retro Fitness Health Club 125 X X X X X
12 – 15K SF
Ross Dress for Off-Price 100 X X X
Less Apparel 15 – 35K SF
Source: Cushman & Wakefield ResearchAnnounced Major Chain Openings
Not everyone is shrinking…
Retailer Type # Stores Urban Cool Mall & Power & Neighborhood Strip
Avg Size High Streets Lifestyle Regional & Community
Street
Sally Beauty Beauty 100 X X X X X
Systems Salons 1 – 4K SF
Sephora Beauty 70 X X X
Cosmetics 3 – 7K SF
Shoe Carnival Shoes 20 X X
5 – 10K SF
Soft Home 17 X X
Surroundings 4 – 6K SF
Sportsman’s Sporting 8 -12 X
Warehouse Goods 15 – 65K SF
Sprouts Farmer’s Grocery 30 X X
Markets 25 – 35K SF
Source: Cushman & Wakefield ResearchAnnounced Major Chain Openings
Not everyone is shrinking…
Retailer Type # Stores Urban Cool Mall & Power & Neighborhood Strip
Avg Size High Streets Lifestyle Regional & Community
Street
Sprint Cellular 40 X X X X X X
Store 1 – 3K SF
Starbucks Restaurant 400 X X X X X X
Coffee 2 – 4K SF
Target Super Store 32 X X X X X
30 – 50K SF
Texas Restaurant 25 – 30 X X X X X
Roadhouse Casual 3 – 6K SF
Tim Horton’s Restaurant 105 X X X X X X
Coffee 1 – 3K SF
TJ Maxx Off-Price 40 – 50 X X X
Apparel 25 – 35K SF
TJX HomeGoods Home 80 X X X
30 – 50K SF
Source: Cushman & Wakefield ResearchAnnounced Major Chain Openings
Not everyone is shrinking…
Retailer Type # Stores Urban Cool Mall & Power & Neighborhood Strip
Avg Size High Streets Lifestyle Regional & Community
Street
TJX AS OF YET Home 5 X X X
UNNAMED NEW 30 – 40K SF
CONCEPT
Tractor Supply Misc.. 100 X X X
15 – 20K SF
ULTA Beauty 100 X X X X
Cosmetics 10 – 30K SF
Urban Outfitters Apparel 4 X X X
4 – 10K SF
Walmart Super Store 89 X X X
40 – 125K
Wendy’s Restaurant 75 X X X X X X
Fast Food 2 – 4K SF
Source: Cushman & Wakefield ResearchThe News Isn’t All Bleak
Some categories and/or concepts are simply on fire!
Food Halls in the U.S.
300
250
200
150
Projected
Existing
100
50
0
2010 2011 2012 2013 2014 2015 2016 2017 2018 2019
Source: Cushman & Wakefield ResearchCool Streets
Millennial-driven up-and-coming alternative urban neighborhoods still hot
The Evolution of Cool Streets
Edgy Cool Bodegas, Bars &
Funky Local… Cheap
Rents
EDGY UP AND
COOL COMING Up and Coming Boutiques, More
Restaurants Arrive…
Rents Climbing
Prime Hipness Funky Local Priced
Out, Cool National
Concepts Arriving…
GONE
MAINSTREAM Rents Climbing
Still Cool, But Going Whole Foods Arrives
Mainstream Rents Climbing
STILL
PRIME
Gone Mainstream Creatives Moving On,
COOL, Replaced by More
HIPNESS
BUT…
Affluent Crowd.
Pottery Barn!
Source: Cushman & Wakefield ResearchCool Street Contenders Privately-held hipster brands can take chances the big chains can’t—and they’re connecting with Millennials! Source: Cushman & Wakefield Research
Global Hipster Style
Independents are gaining ground globally

 •French                               English              Japanese                    Tretorn
 Poys & Pirls                          Dune London          Sasquatchfabrics            CMMN SWDN
 Pigalle                               Palace Skateboards   Bed J.W. Ford               Polar Skate Co
 AMI                                   Lazy Oak             Freak’s Store
                                       Grind London         Magic Stick Entertainment   German
 Club 75
                                       a number of names*   Wacko Maria                 ACRONYM
 Maison Kitsune
                                       Satta                GUILTY PARTIES              PB 0110
 Monsieur Lacenaire
                                       Nasir Mazhar                                     Simon Freund
 KENZO
                                       A Cold Wall          Scandinavian                Boulezar
 Helas
                                       Maharishi            Acne Studios                Hien Le
 Carven
                                       Cassette Playa       Eytys                       Mykita
 Etudes Studio
                                       Goods by Goodhood    L’Homme Rouge               Frisur
 Andrea Crews
                                       Roundel London       Wood Wood                   A Kind of Guise
 Cote & Ciel
                                       Garbstore            Armoire d’Homme             Kostas Murkidis
 Vetements
                                       Nigel Cabourn        Rascals                     Beastin
 Magenta
                                       Cottweiler           Norse Projects              Ucon Acrobatics
Source: Cushman & Wakefield Research
                                                                                        Wemoto
Rise of the Indies Many of the hottest new brands are former pure play eCommerce Source: Cushman & Wakefield Research
Clicks to Bricks
Brand embassies, returns savings driving more pure play growth in physical space

                50

                40

                30

                20

                10

                  0

                                       Existing Stores YE 2016   Estimated New Stores 2017
Source: Cushman & Wakefield Research
Entertain Us!
Millennials spend more on experience than “stuff”
Golf/Sports/Arcade Entertainment Themes Athletics Space
BarCades/Mixed (Dave & Aquatic Parks
Buster’s, Punch Bowl Social, etc.) Trampoline Rooms
TopGolf Indoor Rock Climbing
Miniature Golf Indoor Skydiving
Glow Golf Velodromes (Indoor Cycling Tracks)
Ping Pong (Susan Sarandon)
Bowling Alleys (Lucky Strike, etc.) Culture/Performing Arts Space
Duck Pin Bowling Art Galleries
Indoor Go Cart Tracks Museum Space
Indoor Shooting Galleries (Real Live Theater Space
Guns Optional) Dinner Theaters
Cirque Space
Nouveau Theaters Stand Up Comedy Clubs
IMAX Live Music Venues
Restaurant/Theaters
Bar/Theaters Float Rooms/Sensory Deprivation
Children Themed Theaters
Source: Cushman & Wakefield Research
Hipster/Art House TheatersCraft Brewing Explosion
Trend is still not mature nationally
STATES WITH 100+ BREWERIES
Microbreweries Brewpubs Planned
MASSACHUSETTS 75 29 39
MINNESOTA 74 35 42
Craft Breweries in the United States
INDIANA 54 69 25 6,000
WISCONSIN 73 62 27 5,000
MICHIGAN 87 51 33 4,000
VIRGINIA 117 44 63 3,000
OHIO 100 73 47 2,000
ILLINOIS 99 74 44 1,000
NORTH CAROLINA 133 56 55 0
TEXAS 134 58 105 2006 2007 2008 2009 2010 2011 2012 2013 2014 2015 2016
FLORIDA 141 51 76 Brewpubs Microbreweries Regional Breweries
PENNSYLVANIA 84 116 62
OREGON 133 93 26
NEW YORK 170 91 80
WASHINGTON 227 88 52
COLORADO 199 121 67
CALIFORNIA 388 204 156
Source: Cushman & Wakefield ResearchWhat About the “Retail Apocalypse?” Source: Cushman & Wakefield Research
US eCommerce Total Share of Retail
Stronger growth ahead due to ePharma & eGroceries
                                                                                            What’s Really Happening
                                                                                            (it’s not just about
                          13.0%
                                                                                    12.0%   Amazon)?
% of Total Retail Sales

                          12.0%

                          11.0%                                                             Convergence of Four
                                                                            9.1%            Factors:
                          10.0%

                          9.0%
                                                                            Q3 17
                                                                                            1. Acceleration of
                          8.0%                                                                 newCommerce
                          7.0%                                                              2. Over Retailed
                                                                                               Marketplace
                          6.0%
                                                                                            3. Race to the Bottom
                          5.0%    4.2%                                                         Discounting (Rise of Off-
                          4.0%                                                                 Price)
                                                                                            4. Shifting Consumer
                          3.0%
                                                                                               Patterns (Millennials
                                                                                               Spending Differently
                                                                                               than Past Generations)

               Source: Cushman & Wakefield Research and Moody’s Analytics
From eCommerce to newCommerce
How online keeps evolving…
1995 - 2000 2001 - 2009 2010 - Present 2015 - Present 2017 - ?
The Early Days Pure Play The Age of Omnichannel newCommerce
Years Amazon Age Age
Desktop
Desktop Desktop Desktop Desktop
Initial Launch of Mobile Mobile Mobile Mobile
eCommerce Tablets Tablets Tablets
Post Tech Wreck Ramp ?
Rise (and Fall) Up of New Pure Play Amazon Distribution Amazon Dominance
of Early Players Internet eCommerce Strategy: Speed to Continues Seamless Integration
Consumer over Tax of Omnichannel (now
Distribution Strategy: Retailers Still Building a GIVEN for Retail
Tax Advantages Amazon Dominance eCommerce Survival)
over Speed Infrastructure
Retailers Rush to Build eGroceries
eCommerce Emergence of Bricks
Infrastructure to Clicks Movement ePharma
Source: Cushman & Wakefield ResearchFrom eCommerce to newCommerce
eCommerce GAFO numbers demonstrate bricks-and-mortar challenges
$330,000 40.0%
Retail Sales: GAFO, ($Mil.) eCommerce Share
$320,000 35.0%
$310,000 30.0%
$300,000 25.0%
$290,000 20.0%
$280,000 15.0%
$270,000 10.0%
$260,000 5.0%
2011
Q2-11
Q3-11
Q4-11
2012
Q2-12
Q3-12
Q4-12
2013
Q2-13
Q3-13
Q4-13
2014
Q2-14
Q3-14
Q4-14
2015
Q2-15
Q3-15
Q4-15
2016
Q2-16
Q3-16
Q4-16
2017
Q2-17
Source: US Commerce Department, Cushman & Wakefield ResearchJeff Bezos Vs. the World
Guess who is winning so far?
As robust as eCommerce
growth continues to be…
55% Total Retail Sales
Amazon continues to
45% eCommerce Sales
outperform even those
numbers…
Amazon Sales
35%
Amazon accounted for 43%
25%
of all USA eCommerce sales
in 2016…
15%
Amazon sales surged 33.7%
in Q3 2017.
5%
Q3 2009
Q3 2010
Q3 2011
Q3 2012
Q3 2013
Q3 2014
Q3 2015
Q3 2016
Q3 2017
-5%
-15%
Source: US Commerce Department, Company Reports/SEC Filings/ Cushman & Wakefield ResearchAmazon/Whole Foods
Amazon didn’t buy a grocery chain; they bought 462 eGrocery fulfillment centers
eGroceries has only just
Online Grocery Market Share 2016
begun in the USA
USA
Amazon’s $13.7B purchase
Netherlands of Whole Foods means
Spain disruption for grocers, not
so much for landlords
Czech Republic
China Traditional grocers need to
ramp up eGrocery efforts…
Taiwan
France Likely scenario for 2018:
Blue Apron, HelloFresh or
United Kingdom other “Meal Kit” operator is
Japan
acquired by traditional
grocery chain to accelerate
South Korea eGrocery rollouts…
0.0% 2.0% 4.0% 6.0% 8.0% 10.0% 12.0% 14.0% 16.0% 18.0%
Online Grocery Market Share 2016
Source: Kantar Worldpanel, Statista, Cushman & Wakefield ResearchLook for Strong Growth from Amazon/Whole Foods
But still just in denser urban and suburban locales
2016: 52.1% of all USA
eGrocery sales came from
just eight states…
Or, more specifically, dense
urban markets within those
eight states…
OH PA NY
IL 3.3% 3.9% 13.8%
4.3% NJ
Final Mile still rules
CA 3.9%
12.3%
TX
5.3%
FL
5.3%
Source: IBISWORLD, Cushman & Wakefield ResearchAmazon/Whole Foods Has Some Catching Up to Do
Combined grocery market share in 2016 was roughly 3%
Look for aggressive growth
from Amazon/Whole Foods
likely to begin 2H 2018.
We anticipate that as many
as 500 new stores in
different formats may be
opened in the next five
years…
Source: Kantar Worldpanel, Statista, Cushman & Wakefield ResearchWhat’s Next for Amazon? Furniture and Pharma both on the horizon… FURNITURE & PHARMA Source: Cushman & Wakefield Research
Walmart Innovations…
Looking to catch up; leveraging competitive advantages to compete w/Amazon

                                                                Build the most compelling complement to the physical store network

                                                                • Q2 2017 online revenues reported up 60%       • Scan and Go

                                                                • 67 million SKUs online; up 30% from Q1 2017   • Curb-side services

                                                                • Online grocery in 900 locations               • Uber and other pilot partners

                                                                • Easy re-order                                 • Store associate private delivery

                                                                • Click and collect discounts                   • Jet influences in reshaping
                                                                                                                  strategy
                                                                • In-store technology – The 100 Towers
                                                                                                                • Latch-key delivery

Source: Company filings, Retail Info Systems, Chain Store Age
And What’s Going on Here?
Is Walmart going upscale?
+
+
+
+ ?
Source: Cushman & Wakefield Research2018: the Year of M&A Mania? Undervalued concepts ripe for acquisition… Will we see the emergence of a retail duopoly? Source: Cushman & Wakefield Research
The “Apocalypse” Story Isn’t Going Away Any Time Soon
Next year likely to see peak closures
                                                                                                Challenges Next Year:
                                                  Major Chain Store Closures
14,000                                                                                          Bankruptcies Likely Not to
                                                                                                Reach 2017 Levels, but Still
12,000                                                                                          Elevated…

10,000                                                                                          Can Sears Survive Another
                                                                                                Year?
  8,000
                                                                                                Increased Department Store
  6,000                                                                                         Closures

  4,000                                                                                         Second Wave of Strategic
                                                                                                Closures to Follow
  2,000                                                                                         Department Store
                                                                                                Consolidation as Tenants
        0
                                                                                                Exercise Co-Tenancy
                                                                                                Clauses
              2007 2008 2009 2010 2011 2012 2013 2014 2015 2016 2017 2018 2019
                                         Major Chain Closures   Forecast Major Chain Closures   M&A Consolidations

 Source: Cushman & Wakefield Research and Moody’s Analytics
Danger Zone
Bankruptcies will persist in 2018 and beyond
Credit downgraded, late
Potential Vulnerabilities Ahead payments, have sought
Apparel & Department Stores restructuring or hired financial
advisers or have issued “going
6,000
warning” concerns.
4,878
5,000
4,000 2018 Bankruptcy Watch
Sears
3,000 2,710
Neiman Marcus
2,000 1,667
1,430 J. Crew
1,020 Vince
1,000 554 575 564 650
335 364 368 300
86 262 187 David’s Bridal
0
Nine West
Claire’s
Lands’ End
Charming Charlie
Potential Vulnerabilities Ahead Bon-Ton
99 Cents Only
Source: Cushman & Wakefield Research and Moody’s Analytics Charlotte RusseNot A Good Combination…
USA has most retail space per capita and lowest sales PSF
The Father of the American Mall
Sales per Square Foot per Capita
30 $3,500
“I am often called the father of
the shopping mall. I would like
$3,000
25 to take this opportunity to
disclaim paternity once and for
$2,500
20
all. I refuse to pay alimony to
those bastard developments.
$2,000 They destroyed our cities…”
15
$1,500
Viktor Gruen
10
$1,000
5
$500
0 $0
USA Canada Australia UK France China Germany
Square Footage per Capita Sales per Square Foot per Capita
Source: Turner Construction Cost Index, Cushman & Wakefield ResearchOver-Retailed, But Not All Retail is Suffering
Neighborhood/Community and Strip Centers doing fine…
Shopping Center Total GLA Vacancy Vacancy Share of Malls and Power Centers
Type (MSF) Rate Rate Retail have been most impacted
Q3 2016 Q3 2017 Market by current wave of
closures…
Power Centers 754.5 4.8% 5.0% 7.1%
But Malls only account for
8.4% of all USA retail and
Shopping Centers 3,537.2 8.0% 7.8% 33.1%
(Neighborhood, Power Centers account for
Community, Strip) 7.1% of all USA retail.
Malls (Lifestyle, 899.2 5.4% 6.2% 8.4%
Regional Mall, Super Shopping Centers
Regional Mall) (neighborhood, community
and strip centers) have
Specialty Centers 85.7 5.0% 4.9% >1.0%
(Outlet, Airport, etc.) actually seen vacancy
declines.
Freestanding Retail 5,400.4 3.0% 3.2% 50.5%
We estimate that the
marketplace is over-retailed
by roughly 1.5 Billion
TOTAL RETAIL USA 10,676.0 4.8% 5.3% 100.0%
Square Feet.
Source: Costar Group, Cushman & Wakefield ResearchFeeling Good in the Neighborhood
Neighborhood/Community/Strip vacancy continues to slowly fall
What’s Really Happening
(it’s not just about
70.0 12%
Amazon)?
60.0
10% Convergence of Four
50.0 Factors:
40.0 8%
Million Square Feet
1. Acceleration of
30.0
Forecast newCommerce
6% 2. Over Retailed
20.0 Marketplace
3. Race to the Bottom
10.0 4% Discounting (Rise of Off-
Price)
0.0
4. Shifting Consumer
2007
2008
2009
2010
2011
2012
2013
2014
2015
2016
2017 Q3
2017 Q4 (F)
2018 (F)
2019 (F)
2020 (F)
2%
(10.0) Patterns (Millennials
Spending Differently
(20.0) 0% than Past Generations)
Net Apsorption (MSF) New Construction (MSF) Overall Vacancy
Source: Costar Group, Cushman & Wakefield ResearchPower Centers More of a Question Mark
Will traditional power center tenants re-tenant troubled malls?
What’s Really Happening
(it’s not just about
45.0 9%
Amazon)?
40.0 8%
35.0 Convergence of Four
7% Factors:
30.0
Million Square Feet
6%
25.0 1. Acceleration of
20.0 5% newCommerce
2. Over Retailed
15.0 4%
Forecast Marketplace
10.0 3. Race to the Bottom
3%
5.0 Discounting (Rise of Off-
2% Price)
0.0
4. Shifting Consumer
2007
2008
2009
2010
2011
2012
2013
2014
2015
2016
2017 Q3
2017 Q4 (F)
2018 (F)
2019 (F)
2020 (F)
(5.0) 1%
Patterns (Millennials
(10.0) 0% Spending Differently
than Past Generations)
Net Apsorption (MSF) New Construction (MSF) Overall Vacancy
Source: Costar Group, Cushman & Wakefield ResearchDollar-Dazed
Race to the bottom has some winners
What’s Really Happening
Dollar General will open
(it’s not just about
1,000 new stores in 2017. Amazon)?
This will be the fifth Convergence of Four
consecutive year that Dollar Factors:
General has opened at least
750 new stores. 1. Acceleration of
newCommerce
2. Over Retailed
Over the last five years, dollar
Marketplace
store chains have grown by 3. Race to the Bottom
over 7,000 units in the USA. Discounting (Rise of Off-
Price)
That equates to a new dollar 4. Shifting Consumer
store opening once every four Patterns (Millennials
hours in the USA for five Spending Differently
straight years. than Past Generations)
Source: Cushman & Wakefield ResearchIt’s Never Been Better for Off-Price
Department stores are just as challenged by off-price as online…
Projected Amazon Market Share Projected Clothing And Accessory
of Clothing And Accessories Revenues In 2021
16% $ 62B
BILLION $
8.2%
%
6.6% $26B
$23B
2016 2017 2021 AMAZON TJ MAXX MACY’S
Source: Cowen & Company, Cushman & Wakefield ResearchBut What Does it Mean for Malls?
Bifurcation in performance continues to widen…
Closures Impacting the
Weakest Properties, Not All
Properties
If the goal is to reduce your
physical footprint, while
looking to boost your online
sales… This inherently means
that your remaining physical
locations are more important
than ever before…
Source: Cushman & Wakefield Research,Not All Malls are in Trouble
It’s all about class…
Class A and above malls
Approximate Number of Malls by Class accounted for more than
200 70% of all mall retail sales in
150 2016.
100
There are roughly 670 Class
50
B and C malls in the US, but
0 they only accounted for 28%
A++ A+ A A- B+ B+ B- C+ C C- D of all mall sales last year.
A++ A+ A A- B+ B+ B- C+ C C- D
Class D malls accounted for
Approximate Share of Total Mall Value by Class less than 0.2% of all mall
25.0 sales last year…
20.0
15.0
10.0
5.0
0.0
A++ A+ A A- B+ B+ B- C+ C C- D
A++ A+ A A- B+ B+ B- C+ C C- D
Source: Cushman & Wakefield Research, Fung Global, Green Street Advisors, BloombergNot All Malls are in Trouble
It’s all about class…
Death Spirals Will
Accelerate in 2018 &
Sales PSF
Strengthening Beyond…
$1,200 Position
Number of US Malls 2007:
$1,000 1,350
Average Sales PSF 2016: $480 PSF
$800 If Below… Watch Out! Number of US Malls 2017:
Weakening 1,150
Position
$600
Number of US Malls 2027:
850
$400
$200
$0
A+++ A+ A A- B+ B B- C+ C C- D
Sales PSF
Source: Cushman & Wakefield Research, Fung Global, Green Street Advisors, BloombergAgenda
Do the Old Development Rules Still Apply?
Is it Still as Easy as Following the Rooftops?
• Where are the new rooftops? Urban Vs. Suburban?
• Demographic Shifts to Watch…
• The hourglass economy—Don’t get stuck in the middle…
• Upscale, discount or experiential—what it means by shopping
center type?The Urban Growth Trend is Real
Urban share of household growth
Demographic Shifts to Watch
Urban Areas More Than
Doubled Their Usual Growth
Rates from 2010 – 2015.
Source: John Burns Real Estate Consulting, Cushman & Wakefield ResearchThough Suburban Still Captured Most the Growth
Suburban share of household growth
Demographic Shifts to Watch
Despite urban surge, we are
still a nation of suburbs…
Rural populations, however,
continue to dwindle.
Population Distribution 2015
Urban 15%
Suburban 64%
Rural 21%
2010 – 2015 Growth Capture
Urban 21%
Suburban 71%
Rural 8%
Source: John Burns Real Estate Consulting, Cushman & Wakefield ResearchMillennials and Empty Nesters Fueled Urban Growth
Urban population growth by age
Demographic Shifts to Watch
Young and Old Fueled Urban
Growth
It wasn’t just Millennials!
Source: John Burns Real Estate Consulting, Cushman & Wakefield ResearchMillennials and Empty Nesters Fueled Urban Growth
Urban population growth by age
Demographic Shifts to Watch
But Urban Growth Rate of
21% Expected to Fall to 15%
Over Next Decade
Reasons:
Costs
Millennials Raising Families
Boomer Population Declines
Generation Z Likely to be
Urban Aspirational but Pricing
Likely to be Issue
Source: John Burns Real Estate Consulting, Cushman & Wakefield ResearchSo Where Are the Rooftops Now?
Here is where the old development rules still apply, with caveats..
Southeast Leads the Way
Florida and Texas continue to
lead the nation in population
growth…
Ground-up development,
particularly of
neighborhood/community
centers, following patterns of
growth…
Source: John Burns Real Estate Consulting, Cushman & Wakefield ResearchPopulation Continues to Grow…
Household formation and home ownership growth
12.5 Million More Households
Household Formation by Home Ownership Growth by
Year Born Year Born Between 2015 and 2025…
2000s 2000s
1990s 1990s
1980s
13.3 million losses from older
1970s 1980s generations offset by 25.8
1960s 1970s million gains in households
1950s
1940s
1960s (Millennials, Generation Z,
1930s 1950s etc.)
0 5 10 15 20 25 1940s
1930s
2025 Households (Millions) This should translate into 5.3
2015 Households (Millions) -5 0 5 10 million more homeowners by
2025…
Source: John Burns Real Estate Consulting, Cushman & Wakefield ResearchWhere are the Rooftops Going to Be?
Projected household growth by region (millions) 2016 - 2025
Demographic Shifts to Watch
Most of the growth will be in
the South
5.3 million more homeowners
7.2 million more renters
Wildcard:
Impact of driverless cars…
Source: John Burns Real Estate Consulting, Cushman & Wakefield ResearchBut Can You Build It? In a High-Risk Environment, What Still Pencils? • What’s happening with costs? • The construction labor crisis… • The coming wave of defaults… Crisis = opportunity, or does it?
Costs Going Up, Up, Up!
Can it even pencil?

    Turner Construction                                                  Turner Construction
        Cost Index                                                           Cost Index
                                Index                                               Index
                                               %                                             %
 Q3 17                          1044           5.6                      Q3 17       1044    1.26

 2016                            989           4.7                      Q2 17       1031    1.18

 2015                            943           4.5                      Q1 17       1019    1.29

 2014                            902           4.4                      Q4 16       1006    1.11

 2013                            864           4.1

 2012                            830           2.1

 2011                            812           1.6

 2010                            799          -4.0

 2009                            832          -8.4

 2008                            908           6.3

 Source: Turner Construction Cost Index, Cushman & Wakefield Research
Construction Labor Market Status
Labor shortage a major problem…
Jobs Back, but Not Here
Construction Share of
Recovery Status
Nonfarm Employment
Male participation in workforce
Net Construction Net Construction
Job Losses Job Gains
(2005): 73.3%
10-Year Average 2017Q2 %
(GFC Peak to (GFC Trough to
Trough) 17Q2)
Male participation in workforce
Midwest 4.2% 4.0% -392.9 228.4 -11.4% (2017): 69.2%
Mitigating factors:
Northeast 3.9% 4.0% -209.1 194.3 -1.4%
Immigration policy
South 5.5% 5.2% -756.6 466.0 -10.8%
Opioid crisis
West 5.5% 5.3% -837.4 506.8 -16.2%
U.S. 4.9% 4.7% -2,265.0 1,429.0 -10.8%
Source: Bureau of Labor Statistics (updated Sept 2017), Cushman & Wakefield Research
Note: Jobs figures are in thousandsWorsened by Hurricanes…
The perfect labor storm…
Worsened by Hurricanes
Estimated Cost ($ Billions) adjusted for inflation
Harvey destroyed 30,000
Ivan (Sept 2004) homes in Houston—roughly
same as existing residential
pipeline…doubling demand.
Ike (Sept 2008)
10,000 to 20,000 workers
Andrew (Aug 1992
could be needed in Houston
alone…
Sandy (Oct 2012)
After Katrina, construction
Katrina (Aug 2005) worker wages increased 12%
in Mississippi… that was
Harvey (Sept 2017) before labor shortage…
0 20 40 60 80 100 120 140 160 180 200
This time around?
Estimated Cost ($ Billions) adjusted for inflation
Source: National Oceanic and Atmospheric Administration, Chicago Tribune, Cushman & Wakefield ResearchWorsened by Hurricanes…
The perfect labor storm…
Local Wages Already Up 40%+
Last Year Hourly Mean Wage;
Texas: $14.62/hr.
Florida: $14.00/hr.
Recent employment ads for
construction help in;
Houston: $21/hr. /($14.62)
Florida Keys: $20/hr./$14.00)
Source: Bureau of Labor Statistics, Cushman & Wakefield ResearchUSA New Construction by Product Type
Historical and Forecast
Development Outlook
Commercial Development in Major Markets
300
While retail development is
down, office construction
250 remains robust and industrial
is setting records…
200
150
100
50
0
2010 2011 2012 2013 2014 2015 2016 2017 2018 (F) 2019 (F) 2020 (F) 2021 (F)
Office (MSF) Industrial (MSF) Retail (MSF)
Source: Turner Construction Cost Index, Cushman & Wakefield ResearchLand & Development Costs are Up, But…
Dead/dying malls will be had for pennies on the dollar
Retail Delinquencies to Soar
According to Trepp
Retail Delinquency Rate as of
September 2017: 5.7%
We think that number will hit
10% over the next few years.
Source: Trepp, Cushman & Wakefield ResearchCan Dead Malls be Repositioned for eCommerce?
The exception, not the rule
FedEx/Mesquite Mall
Mesquite Mall was one of the
Dallas area’s first enclosed
malls, built in 1959.
The mall lost ground to
competitors through the 1980s
and 1990s and was closed in
2001.
It was demolished in 2006.
FedEx just built a 334,000
square foot distribution center
on the site.
Source: Cushman & Wakefield ResearchSo Where Does This Leave Us?
The story of retail development over the next decade will largely be a tale of mixed-use redevelopment
Challenges Opportunities Solutions
Dead/Dying Malls—Mostly Suburban Population Growth to Redevelop Dead Suburban Malls
Suburban Increase as Mixed-Use Lifestyle Centers
w/Substantial Housing, Office,
Medical and/or Hospitality
Department Store/Apparel Explosion of Food Retail, Shift Centers Towards
Consolidation Entertainment Retail, Experiential Entertainment Focus or Discount
Concepts, Off-Price Apparel & Focus
Discounter Demand
Rising Power Center Vacancies Mixed-Use Works Here Too Mixed-Use Works Here Too
Source: Cushman & Wakefield ResearchThe New Lifestyle Mixed-Use Food/Drink Heavy, Entertainment/Experientially Focused Open Air Centers The Wharf Avalon Legacy West The Bloc Washington, DC Alpharetta, GA Waco, TX Los Angeles (Downtown), CA Hoffman/Madison Marquette PGIM KDC/Columbia Ratkovich Brickell City Centre City Point FIGat7th Phipps Plaza Miami (Downtown), FL Brooklyn, NY Los Angeles (Downtown), CA Atlanta (Buckhead), GA Swire Properties Extell, et al Brookfield Simon
There is No Room for Mediocrity in Retail Anymore
Follow Viktor Gruen’s Original Vision

                                                                              The Father of the American Mall

 • You must give people a reason to come to your store or your                  “As art patrons, merchants
   shopping center in the age of newCommerce.                                   can be to our time what the
                                                                                church and nobility were to the
                                                                                Middle Ages.”
 • If your shopping center is the center of your community, it will thrive.

 • If it isn’t, then build a community around it.                               Viktor Gruen
Get on My Mailing List!
Garrick.Brown@Cushwake.com
©2017 Cushman & Wakefield.
The material in this presentation has been prepared solely for information purposes, and is
strictly confidential. Any disclosure, use, copying or circulation of this presentation (or the
information contained within it) is strictly prohibited, unless you have obtained Cushman &
Wakefield’s prior written consent. The views expressed in this presentation are the views of
the author and do not necessarily reflect the views of Cushman & Wakefield. Neither this
presentation nor any part of it shall form the basis of, or be relied upon in connection with any
offer, or act as an inducement to enter into any contract or commitment whatsoever. NO
REPRESENTATION OR WARRANTY IS GIVEN, EXPRESS OR IMPLIED, AS TO THE
ACCURACY OF THE INFORMATION CONTAINED WITHIN THIS PRESENTATION, AND
CUSHMAN & WAKEFIELD IS UNDER NO OBLIGATION TO SUBSEQUENTLY CORRECT
IT IN THE EVENT OF ERRORS.You can also read