2020 YOUniversity Deal Challenge - Maison Jacquelyn 14 August 2020
←
→
Page content transcription
If your browser does not render page correctly, please read the page content below

14 August 2020
2020 YOUniversity Deal Challenge
Maison Jacquelyn

Kennedy Xiyang Jin | Grace Guanxiu Lin | James Jingzhe Chen
The Hong Kong Polytechnic University

Team Profile
     Kennedy Xiyang Jin               Grace Guanxiu Lin               James Jingzhe Chen

 Major in BBA (Hons) Accounting   Major in BBA (Hons) Accounting   Major in BBA (Hons) Accounting
           and Finance                      and Finance                      and Finance
  Expected to graduate in 2021     Expected to graduate in 2021     Expected to graduate in 2021
     “Work Hard Play Hard”         “Unreachable is not ten years   “If you do not believe in yourself
                                        later but yesterday”            no one will do it for you”

                                                                                                        2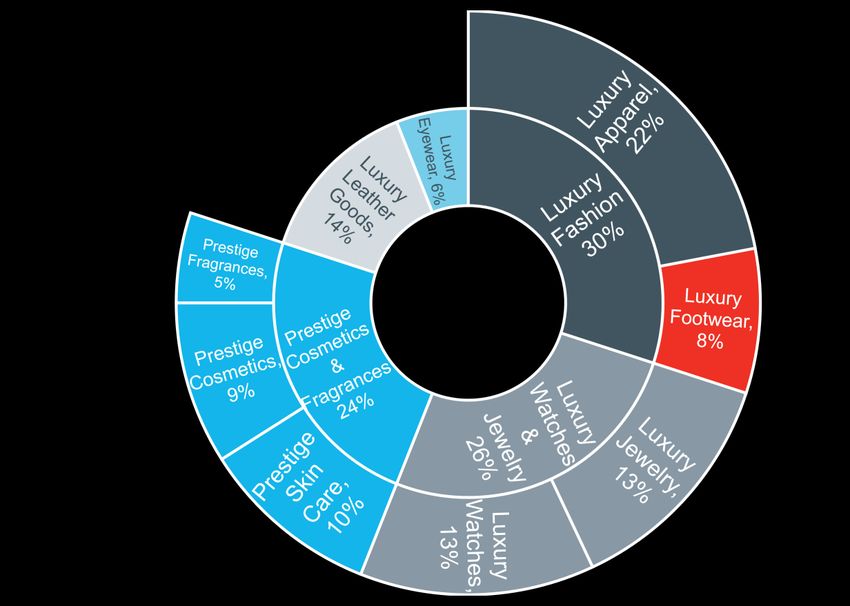
Table of Contents

 Section   Title                                                              Page

 1.        Executive Summary                                                   4

 2.        Deliverable 1: Industry Analysis                                    7

 3.        Deliverable 2: Online Luxury Retailer Acquisition Recommendation    17

 4.        Deliverable 3: Valuation                                            24

 5.        Strategic Buyer Acquisition                                         33

 6.        Private Equity Buyer Acquisition                                    40

 7.        Final Recommendation on Potential Sale                              46

 8.        Appendix                                                            48

                                                                                     3
1.
     Executive Summary

                         4
Executive Summary

                                      •   Debtholders look for exit options due to weak revenue performance of
                                          Maison Jacquelyn (“MJ”)
                                      •   MJ launched new line of shoes at a lower price to boost sales in more
        Situation Overview                mainstream department stores
                                      •   Standalone, MJ is valued at € 326 mm based on cash flows, trading
                                          multiples, and precedent transactions

                                      •   Strategic buyer: Tapestry would be the potential buyer to MJ due to the
                                          alignment in corporate strategies and the distribution resources
                                      •   Tapestry can pay € 491 mm
        Acquisition Analysis
                                      •   Private equity buyer: The Carlyle Group can help MJ to quickly scale into
                                          the online luxury retail market and strengthen MJ’s businesses
                                      •   The Carlyle Group can pay € 506 mm
                                      •   The Carlyle Group is the final recommended potential buyer

 Online Luxury Retailer Acquisition   •   LUISAVIAROMA is recommended as the potential acquisition target
         Recommendation                   for MJ to quickly scale into online luxury sales

                                                                                                                    5
Maison Jacquelyn (MJ) Overview
Operations Overview Financials
(Units: € thousands) 2016A 2017A 2018A
Revenue 170,488 168,326 170,073
Growth -5.4% -1.3% 1.0%
MJ brand is known for being high quality and commands a
Gross Profit 97,290 96,906 98,428
premium price in the women’s luxury shoes sales.
Margin 57.1% 57.6% 57.9%
Headquarter Paris, France
EBITDA 19,787 21,065 23,175
Distribution Retail store (domestic and Margin 11.6% 12.5% 13.6%
international), department store, online
channel EBIT 15,425 16,750 18,822
License MJ does not license its brand to third Margin 9.0% 10.0% 11.1%
parties
Workforce 600 employees and an experienced
senior management team
62.
Deliverable 1: Industry Analysis
7The World of Luxury - Personal Luxury Goods Industry
In the world of luxury, there are several components, including personal luxury goods, at-home-luxury experience (e.g.
artworks), luxury toys, out-of-home luxury experience (e.g. hotel).
Personal Luxury Goods Industry
• The company, MJ, under the personal luxury goods industry, which posts healthy growth in recent years. The CAGR from
1996 to 2018 is 6%
• The industry experienced robust growth from the year of 2010 to 2015 stimulated by Chinese market growth, with 6%
CAGR. After a pause in 2016, the market returned to a “new normal” of moderate growth
Global Personal Luxury Goods Market Sales (€ billions)
“Sortie du temple” Democratization Crisis Chinese Shopping Frenzy New Normal
Source: Bain & Company
8Personal Luxury Goods Industry Overview
Personal Luxury Goods Industry Segments
The personal luxury goods industry can be divided into 5 segments and 7 sub-segments.
Luxury Leather Luxury Watches & Luxury Fashion Luxury Eyewear Prestige Cosmetics
Goods Jewelry & Fragrances
Global Personal Luxury Goods Market Sales (€ billions)
Luxury Watches Luxury Apparel Prestige Cosmetics
Luxury Jewelry Luxury Footwear Prestige Skin Care
Prestige Fragrances
Maison Jacquelyn
Source: Statista
9Personal Luxury Goods Companies Breakdown
The companies break down by business model, and the conglomerate model outperformed in the industry.
Conglomerate Multi-brand Company Mono-brand Company
• Having a portfolio of brands • Having a portfolio of few brands • Operating single brand under the
which operate in multiple which operate in single or few company
segments segments
(No. of brands: 15) (No. of brands: 3)
(No. of brands: 19) (No. of brands: 4)
(No. of brands: 75) (No. of brands: 3)
(No. of brands: 18) (No. of brands: 8)
10Pyramid of Personal Luxury Goods Brands
Price Points in USD Number of Pyramid of Personal Luxury Goods Brands
points of sale
• Among the personal luxury goods brands, the brands
can be sub-categorized into luxury, premium luxury
Very and affordable luxury brands based on their price
Few points and number of points of sale
• The brand, MJ, is classified as premium luxury
brand
Luxury
Hermes
Dior Chanel
Prada LV
1,500 >
Tory Burch
Premium Categorizing into Luxury and Premium Companies
Luxury Michael Kors Lancel
Mulberry Longchamp • In the comparable companies analysis, instead of
choosing comparable companies by business model,
600 > accessing the type of brands under the company is
Coach Michael by Michael Kors applied
Affordable • If the company owns brands are mostly luxury brands,
Luxury Kate Spade Furla
the company is categorized to “Luxury Companies”; if
Longchamp Le Pliage the brands under company are mostly premium and
affordable luxury brands, the company is categorized to
“Premium Companies”
Many • MJ, as a company, is categorized as “premium
companies”
Source: HSBC
11Personal Luxury Goods Industry Trends
Luxury Consumers are Shopping Online Experiential Luxury
• Online luxury shopping takes up 10% of all luxury sales • The growing demand for experiential luxury will
in 2018, it continued to accelerate in 2018, growing 22% affect the personal luxury goods industry because it
to nearly €27 billion represents a fundamental shift in consumer behavior
• Region Performance: Americas represents 44% of from only owning physical goods to emotional fulfillment
online sales, followed by Asia as a new growth engine • This trend is driven majorly by the growing dominance of
for luxury online, slightly ahead of Europe millennials in the market
• Segment Performance: Leather goods and footwear • Luxury brands provide the experiences while customers
remained the top sales, beauty and “hard luxury” shop the products, the experiences are majorly around
(jewelry and watches) categories were both on the rise the product. As for now, the experience economy has
• Distribution channels: The biggest online channels been increasingly considered as a whole and
were online retailers, brand.com and retailers’ website independent business
• Some key areas of experiential luxury:
Share of Global Personal Luxury Goods Market, by o Food
Distribution Channel and Format o Wellness
o Hospitality
Source: Bain & Company, Statista, BCG estimates
12Personal Luxury Goods Industry Trends
The Influence of Younger Consumers Grows Industry Consolidation in Progress
• Generation Y and Z (people aged up to 39 years old) • The opportunity for consolidation in the luxury industry has
accounted for 47% of luxury consumers in 2018 and made the sector a compelling play over the years. The
33% of luxury purchases conglomerate model has outperformed in luxury,
• Considering the younger consumers’ contribution to the where managing luxury brands in a portfolio of
overall growth and sales, brands are adapting to the brands becomes common
preferences of younger consumers • The multi-brand company looks for building its own
• In the year 2025, Generation Y and Z will conglomerate in the industry, the mono-brand company
approximately account for 55% of sales may have the possibility that being acquired by other
companies
Share of Global Personal Luxury Goods, by Generation
Source: Bain & Company, Deutsche Bank
13Porter’s Five Forces Analysis
Porter’s Five Forces Analysis aims at accessing the attractiveness of the industry. In conclusion, the attractiveness of the
personal luxury goods industry is moderate.
Threat of New Entrants: MODERATE Bargaining Power of Customer: MODERATE
• Barriers to entry are moderate • The buyer group is relatively less price-sensitive
o The capital requirements are moderate, because people who have the intention to buy luxury
depending on the scale of business goods may already have the power of buying
o The product differentiation is moderate, even • Buyer switching costs to substitute products are
different brands may have their styles, they still low: the substitute would be something that delivers the
have similar product line and products same value to the luxury goods buyer, for example,
• Expected retaliation from incumbents is low luxurious experience
• Personal luxury goods brand relies on its product • The buyer group is not concentrated in large
and exposure to consumers quantities
• The threat of buyer integrating backward is low
Bargaining Power of Suppliers: LOW Threat of Substitute Products: LOW
• Industry firms’ dependency upon suppliers is low: • Price-performance ratio offered by substitutes: similar
the suppliers are categorized as raw materials, to personal luxury goods
manufacture, finished products, and services. The • Buyer switching cost to substitutes is moderate
choices of suppliers are abundant
• The threat of suppliers integrating forward is low
• There are numerous competitors in the industry
Intensity of Rivalry: • The industry growth is moderate
INTENSE • High fixed cost is needed to run the business
14Luxury Footwear Segment Overview
Recent Performance Market Share
• Commonly, the luxury footwear includes a brand with • Luxury Footwear represents 8% of the whole market
multiple product lines. A luxury brand with only single sales. In the segments categorization, Luxury Footwear
shoe line, such as MJ, is not a common existence is under the segment of Luxury Fashion, where it
• The luxury footwear is the fastest-growing product accounts for the biggest share in the Personal Luxury
category in personal luxury goods market, regarding Goods Industry
the YoY performance
Revenue Share, by
Global Personal Luxury Goods Market, by Product Segment, 2018
Segment, 2018 (€ billions)
YOY growth, 2017-18
Source: Bain & Company, Statista
15SWOT Analysis of MJ
Strengths Weaknesses
• Unique brand identity: MJ as luxury shoes are known • Lacking global presence: MJ’s international stores only
to be worn by celebrities and high-profile executives take part of 10% of the total number of stores, which
• Well-established relationships with department indicate the imbalance market distribution
stores: department stores are an important revenue • Limited distribution channel: MJ’s own website does
stream for MJ not allow for online purchases
• Limited product line: MJ only offers a full line of shoes
and specialize in heels
Opportunities Threats
• Increasing purchasing power of younger generation: • Growing demand of experiential luxury: The shifts in
Generation X and Y are expected to reach about 55% of consumers’ behavior toward more emotional fulfillment
total sales products may switch away the demand of physical luxury
• Developing emerging markets: Many developing • Intense competition: The continuously increasing
countries are now having growing demands in luxury number of competitors may occupy MJ’s market shares,
industry. Especially China, where Chinese consumers while Conglomerate has demonstrated better
will account for 46% of the personal luxury goods market performance in the industry than mono-brand company
by 2025
Source: Bain & Company
163.
Deliverable 2: Online Luxury
Retailer Acquisition
Recommendation
17Online Luxury Retailer Overview
Online Luxury Retailer Share by Platform Type Preferred Online Luxury Retailer Sales Channel
• On the online luxury selling markets, three types of
platform are generally evenly divided:
o E-tailers (multi-brand retailer) : Wholesale
agreements • Multi-brand platform is the most preferred channel of
o Retailer.com: Retail structured online (e.g: all ages. MJ’s luxury product line targets more on the
marketplaces) purchasing power of Gen. X, while the recent
o Brand.com: Direct operated retail under own brand commoditized product line emphasize the focuses on
• Online multi-brand retailer (e-tailers) accounts for the Millennials. To quickly scale into the online retail market,
biggest share of online luxury sales the most preferred type should be selected
Source: Bain & Company, BCG Altagamma
18Online Luxury Retailer Acquisition Target: Criteria of Selection
Criteria of Selecting Online Luxury Retailer
Criteria Explanation
Solid Supply Chain Management The supply chain management directly links to the inventory management,
customer satisfaction upon delivery and receipt of goods, etc.
Type of Online Retailer Channel The type of online retailer channel include:
• Mono-brand retailer: “brand.com”, single brand directly operated under its
own brand
• Multi-brand retailer: “e-tailers”, act as wholesale accounts to the brands,
buying merchandise from them and reselling it to the end consumers
• Marketplace: “retailer.com”, act as intermediaries between the seller (boutique
or brand) and the end consumers
Integration and Adaptability The online retailer should fit MJ’s organizational structure, strategically aid the
brand to quickly scale into the online retail market
Centralized Master Data Maintenance The platform should provide multiple types of data, for enabling the acquired
brand to reflect on its sales performance, forecasting future production,
implementing business strategy, etc.
Commission Fee Structure For acquiring an online retailer platform, besides considering quick entry to the
online luxury sales, the effectiveness of company’s revenue model should also be
considered
Organization Structure The current organization structure may affect the acquisition procedure, for
example, whether the online retailer has a parent company
Source: Goldman Sachs
19Potential Acquisition Targets
Potential Acquisition Targets Overview
Parent
N/A Apax Partners (Private Equity) N/A Richemont
Organization
Founded 2007 1987 2000 2000
Based City London, UK London, UK Florence, Italy Milan, Italy
Number of
Brands Over 700 Over 400 Over 600 Over 800
Offered
Area Served Worldwide Worldwide Worldwide Worldwide
CEO José Neves Ulric Jerome Andrea Panconesi Federico Marchetti
Public
Yes, NYSE: FTCH N/A N/A N/A
Listed?
Revenue of
927 446 121 779 (Y2017)
Y2018 (€ mm)
Multi-brand Retailer/Provide
Type of
Marketplace Multi-brand Retailer Multi-brand Retailer services to mono-brand
Platform
website (e.g. Moncler.com)
Source: Capital IQ, Wikipedia
20Acquisition Target Recommendation
Company Overview Company Features
• Platform Type: LUISAVIAROMA is regarded as a multi-
brand retailer based on its coverage, distribution channel
and no. of partnership
• Well-established supply chain and partnership
Headquarter Florence, Italy management: established distribution network, provided
online shopping experiences to over 200 countries with
Type 100% private owned more than 600 brands
Workforce 200+ employees from 15 countries • Corporate philosophy: LUISAVIAROMA aims at the
high-end luxury market and would like extend more high-
Active User 53 million (2017) end designer product
Major Selling U.S.A, Germany, UK, Italy, China, • Organizational structure: LUISAVIAROMA is operating on
Area France a standalone basis, without controlling by any parent
company, currently the company is not public listed
Financial Performance
• LUISAVIAROMA faced declining EBITDA margin and net
Income margin starting from 2014, which is largely attributed
to the drop in the net operating income and sales revenue
• ROA%, ROE%, and ROC% also keep declining from 2014
due to the drop in the net income
• The inventory level of LUISAVIAROMA is below its
comparable companies
• The company recorded negative net income last year,
however, the platform has its market recognition in the
industry. The company may also look for an external party to
bring new power, to further develop its company
Source: Capital IQ
21Synergies Overview for Acquiring LUISAVIAROMA
Larger Consumer Exposure Potential to Gain Market Share via Mobile App
• LUISAVIAROMA’s broad partnership coverage indicates IOS App Downloads for E-commerce Platforms From
its ability to the addressable market, MJ can gain access March 2018 to Mar 2019
to valuable data intelligence to drive higher incremental
profit contribution
• A higher consumer traffic contributes to MJ’s consumer
analytic ability to provide more tailored marketing efforts
• These may finally induce the transformation of MJ’s
operation model from traditional to digital
Optimize Resources Allocation
• MJ’s current sales are largely contributed by traditional
brick & mortar shops (>= 95% of revenue), which put high
burden on costs due to leasing
• Acquiring online retailer and improved data analytics
across retail will help MJ reconsider the resource
allocation among the existing stores • LUISAVIAROMA has its own mobile application and the
• MJ might finally reduce the store densities in certain multi-brand platforms have the highest download among
regions which online selling appear better performance other types of platforms
• Mobile application, as a form of online retail, MJ may gain
market share through this channel by further developing
the application and the market
Source: Sensor Tower
22Potential of Keeping Low Price Product Line
Booming Demand in Luxury Market Align the Strategy to Acquire Online Luxury Retailer
Gross Income (Units: US trillions) • MJ’s plan on acquiring online retailer demonstrates its
strategy of expanding the distribution channels by striking
deals using online platform for easier and faster purchase
Millennials Generation Z • The digitalization strategy symbiotic with the deep
discount product line, aiming to attract a higher consumer
traffic and turnover rate
• Consider the high traffic under digital strategy, a wider
range of product line should be offered to cater the
diversity
Offering Deep Discounts in the Long Term?
• MJ should keep its deep discount product line as it
enlarges the consumer exposure by grasping a higher
percentage of Generation Z and millennials, which might
boost its sales within a decade
• Applying deep discount product line grasps the market • Low price product line aligns with the digital strategy,
share of Millennials and Generation Z who is still with which is essential to MJ's future transformation
limited purchasing ability • MJ is currently a mono-brand company, extending the
• By 2025, Millennials and Generation Z are expected to product line is not very likely to result in the brand dilution
earn at least 2x of their current gross income with proper advertising strategies
Source: Euromonitor
234.
Deliverable 3: Valuation
24Football Field Valuation Summary
Enterprise Value Ranges with Implied EBITDA Multiples
CC - Comparable Companies Analysis PT - Precedent Transactions Analysis DCF - Discounted Cash Flow Analysis
Current Price
Average
25Comparable Companies Analysis
Unit used in Comparable Companies Analysis: € millions, except multiples, share price
General Information LTM Financial EV/Sales EV/EBITDA EV/EBIT
LTM
Current EBITDA
Equity Enterprise
Company Name Ticker Share Sales EBITDA LTM 2018A LTM 2018A LTM 2018A Margin
Value Value
Price
Luxury Companies
Richemont SA CFR 68.5 17004.4 40445.0 14529.7 2583.4 2.8x 3.7x 15.7x 17.1x 20.5x 21.6x 17.8%
Prada SpA 1913.HK 3.3 3008.7 11269.7 3296.1 535.7 3.4x 3.5x 21.0x 20.4x 34.5x 33.5x 9.9%
TOD's SpA BIT TOD 40.8 1028.6 1860.3 927.5 72.8 2.0x 2.0x 25.6x 16.5x 54.6x 24.8x 7.9%
Moncler MONC 42.2 1005.7 10815.5 1496.8 488.9 7.2x 7.6x 9.3x 9.8x 22.1x 23.2x 32.7%
Salavatore FerragamoSFER 19.1 737.2 3777.5 1369.3 302.3 2.8x 2.8x 12.5x 18.1x 24.3x 24.8x 22.1%
Kering KER 549.1 9276.2 74820.5 14871.7 4917.9 5.0x 5.5x 15.2x 16.8x 16.9x 19.0x 33.1%
Premium Companies
Genesco Inc GCO 45.7 525.2 1304.6 1977.8 118.0 0.7x 0.7x 11.1x 10.8x 15.6x 17.6x 6.0%
Tapestry Inc TPR 24.1 2778.2 9443.8 5403.4 1016.6 1.7x 1.8x 9.3x 8.4x 12.2x 10.6x 18.8%
PVH Corp PVH 91.3 5386.6 10795.3 8813.0 1124.5 1.2x 1.3x 9.6x 11.3x 12.9x 16.3x 12.8%
Capri Holding Limited CPRI 34.3 2164.5 9160.1 5013.0 933.3 1.8x 2.2x 9.8x 9.3x 12.8x 11.5x 18.6%
Ralph Lauren RL 100.5 2622.2 8612.9 5729.9 893.9 1.5x 1.5x 9.6x 10.1x 13.2x 14.4x 61.9%
Mean 4139.8 16573.2 5766.2 1180.7 2.7x 3.0x 13.5x 13.5x 21.8x 19.9x 22.0%
Median 2622.2 9443.8 5013.0 893.9 2.0x 2.2x 11.1x 11.3x 16.9x 19.0x 18.6%
Premium Companies
Mean 2695.4 7863.3 5387.4 817.3 1.4x 1.5x 9.9x 10.0x 13.4x 14.1x 23.6%
Median 2622.2 9160.1 5403.4 933.3 1.5x 1.5x 9.6x 10.1x 12.9x 14.4x 18.6%
Source: Capital IQ, Yahoo Finance
26Comparable Companies Analysis
EBITDA Multiple vs. Historical 1-Year Sale Growth LTM Revenue Multiple vs. EBITDA Margin
Luxury Company Luxury Company
Premium Company Premium Company
• Historical sales growth rate (1-year) has weak correlation • EBITDA margin has positive correlation with EV/Sales,
with EV/EBITDA namely, higher EBITDA margin is likely to result in higher
• In this regard, we leverage the multiple range on mean revenue multiple
and median value of the premium brand as the • MJ’s EBITDA margin on 2018A is 13.63%, with the
comparable continuously declining performance from 2013 to
• Premium Brand’s EBITDA Multiple: 2018, so the applied range is narrowed correspondingly
o Mean: 9.9x • Premium Brand’s Sales Multiple:
o Median: 9.6x o Mean: 1.4x
o Applied Range: 9.6x - 10.1x o Median: 1.5x
o Applied Range: 1.3x - 1.6x
Source: Capital IQ
27Comparable Companies Analysis
Implied Valuation Rage (Unit: € thousands) Companies Selection
As of • Luxury Companies:
Range Implied EV
31/12/2018
EBITDA € 23,175.0 9.6x - 10.1x € 222,480.0 - € 234,067.5
Revenue € 170,073.0 1.3x - 1.6x € 221,094.9 - € 272,116.8
Discussion
• The public comparable companies have been divided into
two types, Luxury Companies and Premium Companies.
Premium companies offer more affordable luxury brands
to customers • Premium Companies:
• Companies selected cover at least one of the following
segment in the personal luxury good industry: appeals,
footwear, accessories, leather goods, eyewear to provide
a reference to MJ’s business coverage
• Companies focus on footwear will be given higher priority
due to the better goodness of fit
• Only public-listed companies are selected due to the data
availability and reliability concerns
• The EV/EBITDA multiples and sales multiples being used
are the mean and median of premium brands, which are
more comparable to MJ
Note: Appendix 4.1 Comparable Companies Selection Overview
28Precedent Transactions Analysis
Unit used in Precedent Transactions Analysis: € millions, except multiples
EV/LTM EV/LTM
Date Target Acquirer/Investor Payment Type Value
EBITDA Sales
28/Oct/19 Tiffany & Co. LVMH Cash 16266.6 18.6x 4.1x
03/Dec/18 Luxottica Group S.p.A. EssilorLuxottica Cash 25170.3 13.6x 2.8x
12/May/17 OVS S.p.A. Carlyle Group L.P. Cash 1794.7 10.5x 1.2x
25/Jul/17 Jimmy Choo Group Plc Capri Holding Limited Cash 1236.9 15.1x 2.6x
08/May/17 Kate Spade & Company Tapestry Inc Cash, Equity 2118.7 10.3x 1.7x
25/Apr/17 Christian Dior SE Semyrhamis SA Cash Option, Equity 70064.5 6.9x 1.6x
10/Feb/15 Hugo Boss AG PFC S.r.L., Zignago Holding Cash 6926.3 12.1x 2.7x
07/Aug/14 Lululemon Athletica Inc. Advent International Corp. Cash 4850.3 11.9x 3.2x
12/Jul/11 Salvatore Ferragamo Ferragamo Finanziaria Cash 1619.2 10.7x 1.8x
06/Jun/11 Moncler Eurazeo SE Cash 928.9 9.1x 2.2x
Mean 13097.6 11.9x 2.4x
Median 3484.5 11.3x 2.4x
High 70064.5 18.6x 4.1x
Low 928.9 6.9x 1.2x
Source: Capital IQ
29Precedent Transactions Analysis
Multiples
Implied Valuation Rage (Unit: € thousands) Discussion
As of • Precedent transactions on similar industry provides
Range Implied EV reference on implied enterprise value, which reflects
31/12/2018
potential synergies integrated in the transaction
EBITDA € 23,175.0 10.5x - 12.0x € 243,337.5 - € 278,400.0 • The most relevant transaction is that Jimmy Choo
acquired by Capri. Jimmy Choo is a brand focusing on
Sales € 170,073.0 1.6x - 2.4x € 272,116.8 - € 408,175.2 women luxury footwear, and Capri was a mono-brand
company at that time
30Discounted Cash Flow Analysis
Income Statement (Unit: € thousands, except margin, discount period and factor)
Income Statement 2019E 2020E 2021E 2022E
Domestic Stores 105,898.42 110,134.36 114,539.73 120,266.72
International Stores 10,242.84 10,447.70 10,761.13 11,191.57
Department Stores 52,401.08 53,711.10 55,590.99 57,536.68
Online 6,825.28 7,644.31 8,561.63 9,589.03
Total Revenue 175,367.62 181,937.47 189,453.48 198,583.99
Cost of Goods Sold 73,303.66 75,140.17 77,675.93 80,029.35
Gross Profit 102,063.95 106,797.29 111,777.55 118,554.64
Margin 0.58 0.59 0.59 0.60
SG&A 76,811.02 77,141.49 77,865.38 79,632.18
EBITDA 25,252.94 29,655.81 33,912.17 38,922.46
Depreciation 4,384.19 4,548.44 4,736.34 4,964.60
EBIT 20,868.75 25,107.37 29,175.84 33,957.86
Taxes 6,469.31 7,783.28 9,044.51 10,526.94
EBIAT 14,399.43 17,324.09 20,131.33 23,430.93
Plus: Depreciation 4,384.19 4,548.44 4,736.34 4,964.60
Less: Capex (4,208.82) (4,366.50) (4,546.88) (4,766.02)
Less: Inc. in NWC - - - -
Unleveraged Free Cash Flow 14,574.80 17,506.02 20,320.78 23,629.51
Discount Period 0.5 1.5 2.5 3.5
Discount Factor @ 9.17% WACC 0.96 0.88 0.80 0.74
PV of FCF 13949.26 15347.32 16318.57 17381.73
Note: Appendix 4.2 Base Scenario Assumptions; 4.3 WACC Calculation; 4.4 NWC Assumptions
31Discounted Cash Flow Analysis
Enterprise Value – EBITDA Multiple Method Enterprise Value
Terminal Value (Unit: € thousands) Exit Multiple
Terminal Year EBITDA (2022E) 38,922.46
9.1x 9.6x 10.1x
Exit Multiple (implied from the median of
EV/EBITDA of the publicly trading 9.6x 8.67% 317,586.91 328,750.96 345,497.03
WACC
comparable companies) 9.17% 312,357.84 323,318.76 339,760.14
Terminal Value 373,655.64
Discount Factor 0.70 9.67% 307,243.55 318,005.95 334,149.54
Present Value of Terminal Value 263,062.11
Enterprise Value (Unit: € thousands) Implied Enterprise Value: € 307,243.55 - 345,497.03
Present Value of Free Cash Flow 62996.88
Enterprise Value 326,058.99
Implied Perpetuity Growth Rate
Terminal Year Free Cash Flow (2022E) 23,629.51 Exit Multiple
9.1x 9.6x 10.1x
WACC 9.17%
8.67% 1.60% 1.95% 2.26%
WACC
Terminal Value 373,655.64
9.17% 2.06% 2.41% 2.72%
Implied Perpetuity Growth Rate 2.41% 9.67% 2.51% 2.86% 3.18%
325.
Strategic Buyer Acquisition
33Strategic Buyers Universe
MJ’s most likely buyer will come from the three types of companies listed below (conglomerate, multi-brand company, and
mono-brand company).
Conglomerate Multi-brand Company Mono-brand Company
• Conglomerate has • The company looks • The company wants to
experiences on acquiring forward to strengthening improve the growth and its
relatively small-scale businesses and business not only on a
company and manage diversification of categories standalone basis, but also
them in a portfolio of • The company may already from potential acquisition
Strategic brands stepped into acquiring • Diversification of
Rationale • Ability to bring strong brands for building its mini- categories is one of the
strategic plan for further conglomerate key aims on acquisition
growth of the acquired • The acquired target would • The company would help
target benefit from the company’s the acquired data to
• Potential to aid the ambition on growth and release its growth
company expand globally receive all-rounded help opportunity
• 2019 - LVMH acquired • 2017 - Tapestry acquired • 2017 - Capri acquired
Recent M&A Tiffany & Co Kate Spade Jimmy Choo
Activity • 2019 - Richemont acquired • 2015 - Tod’s SpA acquired • 2015 - Tapestry acquired
Buccellati Roger Vivier Stuart Weitzman
• Richemont • Tapestry • Moncler
Potential Buyers • Kering • Capri • Salvatore Ferragamo
• Tod’s S.p.A S.p.A.
34Potential Strategic Buyers
Potential Strategic Buyers Overview
Conglomerate, owning Gucci, Multi-brand Company, owning Mono-brand Company
Type of Company Balenciaga, Bottega Veneta, Coach, Kate Spade, and
Alexander McQueen, etc. Stuart Weitzman
Distribution Brand has its own distribution The company has its own Moncler.com, powered by
Network network distribution network YNAP(net-a-porter)
Current Ratio: 0.9x Current Ratio: 1.8x Current Ratio: 1.8x
Liquidity Status Cash and Cash Equivalents: Cash and Cash Equivalents: Cash and Cash Equivalents:
€ 2,450.9 mm € 580.1 mm € 490.5 mm
Enterprise Value EV: € 76,433.3 mm EV: € 11407.7 mm EV: € 10,487.5 mm
and Multiple EBITDA Multiple: 16.2x EBITDA Multiple: 6.4x EBITDA Multiple: 21.2x
• For MJ, Tapestry has good liquidity status and its own distribution network. The company
acquired women luxury footwear Stuart Weitzman at past, they have the experiences on
Recommendation managing footwear brand
• For Tapestry, by acquiring MJ, the company moves toward building a conglomerate,
achieve diversification of categories, strengthening businesses and increase critical mass
35Strategic Buyer Acquisition Recommendation
Company Overview Tapestry’s Net Sales of Each Product Category
(Units: US$ millions) 2018 % 2017 %
Coach 4221.5 72% 4114.7 92%
Women’s Handbags 2298.2 39 2308.0 52
Men’s 844.6 14 808.0 18
Women’s Accessories 747.1 13 721.0 16
Other Products 331.6 6 277.7 6
Headquarter New York, United States
Kate Spade 1284.7 22% - -
Founded 2017 (history started on 1941)
Women’s Handbags 703.4 12 - -
Type Public Company, S&P500 components Other Products 311.6 5 - -
Workforce 17,000+ employees Women’s Accessories 269.7 5 - -
Stuart Weitzman 373.8 6% 373.6 8%
Brands Coach, Kate Spade, Stuart Weitzman
Total Net Sales 5880.0 100% 4488.3 100%
Recommendation Summary
• Acquiring MJ accelerates the diversification of Tapestry’s brand portfolio, with the special reinforcement in the market
position of luxury footwear segment. This contributes to Tapestry’s harness of the multi-brand benefits by the possible
manufacturing planning cycle reform and the product innovation
• MJ’s existing customer basis will provide extensive consumer data to Tapestry, which generates extra incentives for
Tapestry’s current investment on AI tools and data analytics
• Tapestry’s readily established distribution centers can directly incorporate with MJ’s distribution points. The deep-going
cooperation with prestigious department stores broadens MJ’s number of selling points while maintaining its high-end profile,
this provides synergies by building the economics of scale with maximize cost efficiency
Source: Tapestry’s 10-K, Aug-15-2019
36Strategic Buyer Synergies Overview
Strong Direct and Department Stores Network Developed Distribution Network
Number of Direct Stores under Tapestry, 2013 - 2019 • Tapestry owns distributions centres worldwide,
including the major selling areas such as United States,
Canada, Spain, Italy and China
• The company also has regional distribution centres
powered by 3rd parties in some less major area to support
directly operated local markets
• Tapestry has developed automated warehouse
management system and electronic data interchange
system through years of practice to facilitate the
distribution process
• MJ may leverage on these readily-established smart
distribution network with limited costs after acquisition
• Tapestry continuously increases the number of the sales
Emphasis on Digital Transformation
points in recent years. Until 2019, Tapestry has more than
1,500 direct stores and 4,000 distributors/wholesale • With the goal to expand to Greater China area, Tapestry
locations worldwide strongly emphasizes on digital transformation by heavily
• Coach has developed extensive partnership with investing on the digital analytics portals and real-time
prestigious department stores including Macy’s, consumer analysis.
Dillard’s, Hudson’s Bay, Nordstrom, etc. • The acquisition of MJ provides mutual-benefits to both
• The department store resources could be shared after parties. Tapestry may obtain substantial consumer data for
acquisition. MJ can widen its consumer exposure given a more comprehensive analysis, while MJ can reach
the improvement in the selling scales and audience group marketing synergies using the AI tools
Source: Statista, Tapestry’s 10-K, Aug-15-2019
37Max Purchase Price by Tapestry
Scenario 1: Strategic Buyer, Assumptions (Unit: € thousands)
2019E 2020E 2021E 2022E
Domestic Stores Growth (% change) 8% 8% 6% 5%
Domestic Stores Closing Revenue Lost (3,250.00) (3,250.00) (3,250.00) (3,250.00)
International Stores Growth (% change) 4% 4% 6% 6%
Department Stores Growth (% change) 6.00% 7.00% 8.00% 8.00%
Online Growth (% change) 12% 12% 14% 14%
Cost of Goods Sold (% of revenue) 42.00% 40.00% 38.00% 36.00%
SG&A (% of revenue) 43.80% 42.40% 41.10% 40.10%
Cost Savings 7,500.00 9,000.00 9,000.00 9,000.00
Depreciation (% of sales) 1.50% 1.50% 1.50% 1.50%
Tax Rate (% of Earning Before Tax) 31% 31% 31% 31%
Capex (% of revenue) 2.40% 2.40% 2.40% 2.40%
Explanation
Item Reasoning Item Reasoning
Stores Growth It is expected that strategic buyer would focus Depreciation Lower rate due to distribution
on existing stores growth and achieve 10,000k center incorporated by buyer
revenue synergies; department stores sales
strengthening
Domestic Stores Revenue loss 3,250k per annual, savings SG&A Cost savings synergy 5,000k
Closing 4,000 per annum, one-time expense 1,500k per annum
Cost of Goods Sold Gross margin improves to industry average Tax Rate, Capex Remain same level as
management plan forecasts
Note: Appendix 5.1: Industry Average Gross Margin
38Max Purchase Price by Tapestry
Income Statement (Unit: € thousands, except margin, discount period and factor)
Income Statement 2019E 2020E 2021E 2022E
Domestic Stores 107,789.12 113,162.25 116,701.98 119,287.08
International Stores 10,443.68 10,861.43 11,513.11 12,203.90
Department Stores 54,190.38 57,983.71 62,622.40 67,632.20
Online 6,825.28 7,644.31 8,714.52 9,934.55
Total Revenue 179,248.46 189,651.70 199,552.02 209,057.73
Cost of Goods Sold 75,284.35 75,860.68 75,829.77 75,260.78
Gross Profit 103,964.11 113,791.02 123,722.25 133,796.95
Margin 0.58 0.60 0.62 0.64
SG&A 71,010.83 71,412.32 73,015.88 74,832.15
EBITDA 32,953.28 42,378.70 50,706.37 58,964.80
Depreciation 2,688.73 2,844.78 2,993.28 3,135.87
EBIT 30,264.55 39,533.92 47,713.09 55,828.93
Taxes 9,382.01 12,255.52 14,791.06 17,306.97
EBIAT 20,882.54 27,278.41 32,922.03 38,521.96
Plus: Depreciation 2,688.73 2,844.78 2,993.28 3,135.87
Less: Capex (4,301.96) (4,551.64) (4,789.25) (5,017.39)
Less: Inc. in NWC - - - -
Unleveraged Free Cash Flow 19,269.31 25,571.54 31,126.06 36,640.44
Discount Period 0.5 1.5 2.5 3.5
Discount Factor @ 9.17% WACC 0.96 0.88 0.80 0.74
PV of FCF 18442.27 22418.26 24995.74 26952.50
Max Purchase Price: € 491,329.40
396.
Private Equity Buyer Acquisition
40Potential Private Equity Buyers
Potential Buyers Overview
L Catterton focuses on British private equity firm American multinational
investments in leading specializing in investments in private equity, the firm is
Company consumer brands across all the consumer sector. The organized into 4 business
Overview segments of the consumer company passionate about segments, including
industry, based in Greenwich investing in brands about corporate private equity, real
which people are passionate assets, etc.
Acquired TWC in 2011, Acquired a majority Acquired a 48% stake in
Historical engineered the merge with shareholding of Jimmy Choo Moncler S.p.A. in 2008 and
Investment in IWG in 2012, built ILG, a in 2004, and the company exit in 2013. Moncler S.p.A.
Personal Luxury multi-category group of was sold in 2007 to successfully went IPO in
Goods Industry fashion luxury TowerBrook Capital Partners 2011
for £225 million (2.25x)
2017 - Ganni: luxury 2015 - Busemi: luxury 2017 - Golden Goose: now
womenswear brand footwear and accessories working on potential exit deal
Current Holdings 2014 - Giuseppe Zanotti: brand 2017 – Supreme
Italian luxury footwear 2012 - John Varatos
Catterton, LVMH, and Grope Great experiences in apparel In Moncler’s acquisition, not
Other
Arnault partnered to create & accessories brands only capital, provided support
Considerations L Catterton investments on company operations
Source: Wikipedia, L Catterton, Lion Capital, The Carlyle Group
41Private Equity Buyer Acquisition Recommendation
Company Overview Financials
• The full year 2019 Distributable Earnings of $647 million,
or $1.70 per common share; and for year of 2017 and
2018, being $670 and $674 million, where the company’s
overall performance remains stable under the challenging
environment
Headquarter Washington, D.C., United States • Total Assets Under Management: $224 billion, up 4%
year-over-year
Founded 1987
Type Public Company
Workforce 900,000+ employees
Coverage Corporate Private Equity, Real Assets,
Global Credit, Investment Solutions
Recommendation Summary
• The corporate private equity business of The Carlyle Group (CG) has been well developed in the past years. It has great
coverage worldwide, including Europe. Acquiring MJ could diversify its investment portfolio in personal luxury goods
industry and applying their past experiences on MJ to receive high returns
• MJ’s unique positioning in the market and the established brand recognition make the brand being attractive in the capital
market, it would be a good timing for CG to acquire MJ as MJ are now on the stage of growth
• The online retailer acquisition become highly possible if MJ acquired by CG. CG has healthy balance sheet and from their
past investments in luxury industry, they are willing to help and provide finance for the acquired company
Source: The Carlyle Group
42Private Equity Buyer Synergies Overview
International Geographical Expansion Support Entry in New Markets
• MJ is focusing on domestic market with slow and • Entry to new markets include 2 aspects: being the global
ineffective international expansion presence and market digitalization
• From the case of CG and Moncler, CG creates • As for entering digital market, CG may provide the
geographical team for Moncler. MJ may receive strong following support:
support and experiential guideline from CG to o Acquire online luxury retailer platform
develop international market, including construction (potentially being LUISAVIAROMA): strong
of distribution network, local stores opening, human balance sheet and willingness to invest of CG
capital management etc. o Enhance the supply chain by redesigning the
o Moncler case: before acquisition, Japan is the production plant and warehouse rationalization
second market after Italy and distribution fully o Set up specific teams and recruit team
outsourced to local partner and 100% wholesale; managers to quickly scale into the new market
after acquisition, distribution agreement was
converted into joint venture controlled by Moncler,
restructuring the distribution network by cutting Introducing Public Company Practices
70% of the wholesale customers without losing
sales and opened 17 new direct managed stores by • The brand recognition of MJ is one of the key values for
the end of 2013 the company, after acquiring by CG, it is expected that the
revenue would increase significantly, as well as global
presence, the cost management will also be improved
Strengthening the Organization • CG played a key role as a investor for Moncler’s
successful IPO by improving its accounting reporting and
• Effective management team is crucial to MJ budgeting process
• CG is able to redesign the organization and assign • MJ is likely to receive comprehensive guide on how to
new area managers for MJ based on their past adopt management practices of public company
investment performance
Source: The Carlyle Group
43Max Purchase Price by The Carlyle Group
Scenario 2: Private Equity Buyer, Assumptions (Unit: € thousands)
2019E 2020E 2021E 2022E
Domestic Stores Growth (% change) 4% 4% 5% 5%
Domestic Stores Closing Revenue Lost (3,250.00) (3,250.00) (3,250.00) (3,250.00)
International Stores Growth (% change) 2% 2% 3% 4%
Department Stores Growth (% change) 2.50% 2.50% 3.50% 3.50%
Online Growth (% change) 100% 100% 120% 125%
Cost of Goods Sold (% of revenue) 41.80% 41.30% 41.00% 40.30%
SG&A (% of revenue) 43.80% 42.40% 41.10% 40.10%
Cost Savings 2,500.00 4,000.00 4,000.00 4,000.00
Depreciation (% of sales) 2.50% 2.50% 2.50% 2.50%
Tax Rate (% of Earning Before Tax) 31% 31% 31% 31%
Capex (% of revenue) 2.40% 2.40% 2.40% 2.40%
Explanation
Item Reasoning Item Reasoning
Stores Growth It is expected that private equity buyer would Depreciation, Remain same level as
focus on online channel growth and achieve SG&A, Tax Rate, management plan forecasts
120,000k revenue synergies Capex
Domestic Stores Revenue loss 3,250k per annual, savings
Closing 4,000 per annum, one-time expense 1,500k
Cost of Goods Sold Gross margin remain similar level as current
years
Note: Appendix 5.1: Industry Average Gross Margin
44Max Purchase Price by The Carlyle Group
Income Statement (Unit: € thousands, except margin, discount period and factor)
Income Statement 2019E 2020E 2021E 2022E
Domestic Stores 103,676.56 104,573.62 106,552.30 108,629.92
International Stores 10,242.84 10,447.70 10,761.13 11,191.57
Department Stores 52,401.08 53,711.10 55,590.99 57,536.68
Online 12,188.00 24,376.00 53,627.20 120,661.20
Total Revenue 178,508.48 193,108.42 226,531.62 298,019.37
Cost of Goods Sold 74,616.54 79,753.78 92,877.96 120,101.80
Gross Profit 103,891.93 113,354.64 133,653.66 177,917.56
Margin 0.58 0.59 0.59 0.60
SG&A 75,686.71 77,877.97 89,104.50 115,505.77
EBITDA 28,205.22 35,476.67 44,549.16 62,411.80
Depreciation 4,462.71 4,827.71 5,663.29 7,450.48
EBIT 23,742.51 30,648.96 38,885.87 54,961.31
Taxes 7,360.18 9,501.18 12,054.62 17,038.01
EBIAT 16,382.33 21,147.78 26,831.25 37,923.31
Plus: Depreciation 4,462.71 4,827.71 5,663.29 7,450.48
Less: Capex (4,284.20) (4,634.60) (5,436.76) (7,152.46)
Less: Inc. in NWC - - - -
Unleveraged Free Cash Flow 16,560.84 21,340.89 27,057.78 38,221.32
Discount Period 0.5 1.5 2.5 3.5
Discount Factor @ 9.17% WACC 0.96 0.88 0.80 0.74
PV of FCF 15850.05 18709.30 21728.71 28115.39
Max Purchase Price: € 506,221.03
457.
Final Recommendation on
Potential Sale
46Final Recommendation
Strategic Acquisition - Tapestry Private Equity Acquisition - The Carlyle Group
• Strategic Acquisition, in MJ’s case, the buyer may be able • The Carlyle Group has experiences in investing in
to pay lower price than private equity buyer. The strategic Moncler. During the time of holding, CG not only provide
buyer may not aid the company to largely and quickly financial support, but also supported international network
scale into the online luxury retail market, where the expansion and restructure its management team
revenue synergy is flat • The synergy for online luxury retail is expected to be
• The industry is in consolidation stage, Tapestry has solid significantly high, MJ is in the fastest growing segment of
liquidity status currently and the company is looking for personal luxury goods industry
building its own conglomerate. MJ will be a good fit for
Tapestry, enable the company to diversify its portfolio of
brands
• Positive view on online luxury retail market and expected rapid growth from this
revenue stream are attractive
Final Recommendation • The cost savings and revenue synergies are possibly realized through the acquisition
between The Carlyle Group and MJ
• The Carlyle Group will pay the highest price for MJ
478.
Appendix
48Appendix: Exchange Rate Applied
Exchange Rate
• The exchange rate applied as follows:
USD:EUR 1:0.9
EUR:HKD 1:0.12
CHF:EUR 1:0.91
GBP:EUR 1:1.2
49Appendix 4.1: Comparable Companies Selection
Luxury Companies
• Switzerland-based • Italian company, specialize in luxury shoes
• Offer jewelry, watches, leather goods, and other leather goods
pens, firearms, clothing and • Own advanced online channel focus on
accessories accessories selling
• Italian company, specialize in • Italian company
leather handbags, travel • Famous for down jackets and sportswear
accessories, shoes, ready-to-wear • Manufacture accessories which target to
& perfumes and accessories men, women and kids
• Italian company, manufacture shoes • French luxury group
and other leather goods • Primarily offer luxury apparels and
• License for eyewear and timepiece accessories
accessories that targets man and • Own brand including Gucci, YSL,
women Balenciaga, Boucheron, Brioni, etc.
Premium Companies
• American Retailer • American company • American company • Multinational company • American company,
• Produce footwear • Focus on fashion • Own multi-brands consisting of iconic brands produce mid-range to
and accessories appeals, footwears focusing on cloth & that focusing women and luxury level clothes
• Wholesaler of and accessories textile industry men’s footwear, apparels etc. • Focus on home,
branded footwear • Parent company of • Parent company of • Parent company of Versace, accessories and
under its Johnston Coach, Kate Spade Van Heusen, Tommy Jimmy Choo and Michael fragrances products
& Murphy brand and Stuart Weitzman Hilfiger, Calvin Kelvin Kors
50Appendix 4.2: DCF Base Scenario Assumptions
Base Scenario, Assumptions
2019E 2020E 2021E 2022E
Domestic Stores Growth (% change) 3% 4% 4% 5%
Domestic Stores Closing Revenue Lost - - - -
International Stores Growth (% change) 2% 2% 3% 4%
Department Stores Growth (% change) 2.50% 2.50% 3.50% 3.50%
Online Growth (% change) 12% 12% 12% 12%
Cost of Goods Sold (% of revenue) 41.80% 41.30% 41.00% 40.30%
SG&A (% of revenue) 43.80% 42.40% 41.10% 40.10%
Cost Savings - - - -
Depreciation (% of sales) 2.50% 2.50% 2.50% 2.50%
Tax Rate (% of Earning Before Tax) 31% 31% 31% 31%
Capex (% of revenue) 2.40% 2.40% 2.40% 2.40%
Explanation
Item Reasoning
Tax Rate 31%, Deloitte: International Tax France Highlight 2019
Other items Stated as Management Plan
51Appendix 4.3: WACC Calculation
WACC Calculation Reasoning
Target Capital Structure Item Value Reasoning
Debt-to-Total Capitalization 49.19% Target Capital Implied from Median of capital
Structure Debt/Equity Ratio structures of comparable
Equity-to-Total Capitalization 50.81%
= 96.83% companies
Cost of Debt Cost of Debt 13.84% S&P Rate on BB
Cost of Debt 13.84% Tax Rate 31.00% Deloitte: International Tax
France Highlight 2019
Tax Rate 31.00%
After-Tax Cost of Debt 9.55% Risk-free Rate 1.20% Average risk-free rate (RF)
of investment for France;
Data source: IESE
Cost of Equity
Risk-free Rate 1.20% Market Risk 6.00% Average market risk
Premium premium (MRP) for
Market Risk Premium 6.00%
France; Data source: IESE
Levered Beta 0.69
Unlevered Beta 0.41 Average of Comparable
Size Premium 3.47%
Companies
Cost of Equity 8.81%
Levered Beta 0.69
Size Premium 3.47% Size premium for micro-
WACC 9.17% capitalization stocks; Data
source: Ibbotson
52Appendix 4.3: WACC Calculation
Capital Structure Benchmark
Company Market Cap (Euro mm) Debt/Equity Levered Beta Unlevered Beta
Richemont SA 46264 61.1% 1.16 0.51
Prada SpA 8251 111.4% 1.18 0.52
TOD's SpA BIT 1380 68.0% 0.35 0.15
Moncler 10620 65.5% 0.81 0.36
Salavatore Ferragamo S.p.A. 2970 96.8% 0.96 0.42
Kering 67710 89.5% 1.12 0.49
Genesco Inc 868 151.8% 0.48 0.21
Tapestry Inc 7822 126.3% 1.04 0.46
PVH Corp 8356 84.1% 1.5 0.66
Capri Holding Limited 6278 189.4% 0.88 0.39
Ralph Lauren 9456 97.0% 0.92 0.40
Mean 15452 103.73% 0.95 0.41
Median 8251 96.83% 0.96 0.42
Source: Yahoo Finance, Capital IQ
53Appendix 4.4: Net Working Capital Assumption
Net Working Capital
2018A • Due to the large negative number for NWC represent in
the year of 2018, and limited information disclosure in
Current Asset the past years, it is assumed that the net working capital
Cash & Cash Equivalents 17,945 would be equal to 0 for the projection years in valuation
Accounts Receivable 11,779
Inventories 35,662
Other Current Asset 17,895
Total Current Assets 83,281
Current Liabilities
Account Payable 15,955
Accrued Expense 17,071
Current Portion of Debt 350,565
Other Current Liabilities 8,118
Total Current Liabilities 391,709
Total Current Assets 83,281
Less: Total Current Liabilities 391,709
Net Working Capital (308,428)
54Appendix 5.1: Industry Average Gross Margin
Industry Average Gross Margin
Company Gross Margin
Richemont SA 61.7%
Prada S.p.A 71.8%
TOD’s S.p.A BIT 68.4%
Moncler 77.6%
Salavatore Ferragamo S.p.A. 64.9%
Kering 74.5%
Genesco Inc 48.4%
Tapestry Inc 67.7%
PVH Corp 54.7%
Capri Holding Limited 60.6%
Ralph Lauren 61.9%
Mean 64.7%
55You can also read