An Exploration of First Nations Reserves and Access to Cash
←
→
Page content transcription
If your browser does not render page correctly, please read the page content below
Staff Discussion Paper/Document d’analyse du personnel —
2021-8
Last updated: May 25, 2021

An Exploration of First
Nations Reserves and
Access to Cash
by Heng Chen, Walter Engert, Kim P. Huynh and Daneal O’Habib

Currency Department
Bank of Canada, Ottawa, Ontario, Canada K1A 0G9

hchen@bankofcanada.ca, wengert@bankofcanada.ca, khuynh@bankofcanada.ca,
do’habib@bankofcanada.ca

Bank of Canada staff discussion papers are completed staff research studies on a wide variety of subjects relevant to
central bank policy, produced independently from the Bank’s Governing Council. This research may support or
challenge prevailing policy orthodoxy. Therefore, the views expressed in this paper are solely those of the authors and
may differ from official Bank of Canada views. No responsibility for them should be attributed to the Bank.

ISSN 1914-0568 ©2021 Bank of Canada
Acknowledgements
We thank colleagues at the Bank of Canada, especially Jason Allen, Alex Chernoff, Ted
Garanzotis and Ted Mieszkalski; Jerry Buckland (University of Winnipeg); Andre LeDressay and
other Tulo Centre colleagues; Stephen Wild (Financial Consumer Agency of Canada), Tim
Leonard, Sandra Romain, Bruno Powo Fosso and James Maracle (Indigenous Services Canada);
and colleagues at the Reserve Bank of New Zealand, for comments and discussion. We thank
Jerry Qinghui Yu for research assistance and Nicole van de Wolfshaar and Alison Arnot for
editorial assistance.

i
Abstract
Providing bank notes is one of the Bank of Canada’s core functions. The Bank is therefore
interested in whether cash is adequately distributed across society, and this also influences the
Bank’s thinking on issuing a central bank digital currency. We provide a perspective on these
issues by exploring access of First Nations reserves to cash. To do so, we measure the distance
between the 637 reserve band offices in Canada and their closest cash sources. In this study,
these cash sources are branches of financial institutions (FIs), automated bank machines (ABMs)
owned by FIs, and white label ABMs. We measure the distance between band offices and cash
sources by geographical distance (“as the crow flies”) and by travel distance (e.g., road routes).
We also provide some information on access to financial services more generally and set out
questions for future research.
Topics: Bank notes; Digital currencies and fintech; Financial institutions; Financial services;
Payment clearing and settlement systems
JEL codes: E, E4, E41, E42, E5, G21

ii
1. Introduction
In this paper, we explore access to cash for First Nations reserves located across Canada, for three reasons:

 • Providing bank notes to the Canadian public is one of the Bank of Canada’s core functions. To do
 that, the Bank distributes cash to financial institutions through 10 regional distribution points
 (RDPs) across the country. From these RDPs, financial institutions and other commercial firms
 distribute bank notes to the public to meet their own requirements, which include satisfying the
 demand for cash. 1 Accordingly, the Bank is interested in the adequacy of cash distribution across
 the country.

 • Accessibility of bank notes also affects the Bank’s perspective on a central bank digital currency
 (CBDC). That is, a key influence on the Bank’s decision about whether to issue a CBDC is “the
 availability of bank notes to Canadians who want to use them, including marginalized populations
 in our society” (Lane 2020).

 • In 2019, the Bank established a relationship with the Tulo Centre for Indigenous Economics to
 contribute to analysis of Indigenous economic issues (Bank of Canada 2019).

Our specific objective is to measure the distance between First Nations reserves and sources of cash, such
as branches of financial institutions and automated bank machines (ABMs). 2 Our strategy is straightforward,
but implementing it is not. First, we geographically locate all First Nations reserves in Canada (Chart 1).
Second, we locate sources of cash in Canadian dollars, defined here as financial institution branches,
financial institution ABMs and white label ABMs (Chart 2). Then we measure the distance (in kilometres)
between each reserve and its closest cash source in two ways—geographical distance and travel distance—
and we present several statistics to summarize our results. In this way, we provide empirical evidence on
access to cash for First Nations reserves. We also highlight a set of First Nations that appear to be among
the most remote from cash sources and financial services more generally.

In the next section, we provide some background information on First Nations reserves in Canada, including
basic terminology and summary data. Throughout this paper, we rely on publicly available information and
data sources. Section 3 sets out the methods we use to geographically locate reserves and cash sources.
Section 4 explains how we measure the distance between First Nations reserves and cash sources. Section
5 presents results. Conclusions are in Section 6, which also briefly considers access to financial services more
generally and sets out questions for future work.

1 For more information on the Bank Note Distribution System, see Bilkes (1997).
2 Australian authorities are similarly interested in access to cash in more remote areas of Australia and by Indigenous people living in
 those areas; see, for example, Delaney, O’Hara and Finlay (2019).

 1
Chart 1: First Nations reserves…

Chart 2: …meet sources of cash

 2
2. Some background information
(a) Terminology and definitions
We use several specific terms in this paper to describe the various peoples and organizational arrangements
related to First Nations. The following explains the key terms, based on archived information from Aboriginal
Affairs and Northern Development Canada (AANDC). 3 We also draw from the terminology established in
the Indian Act.

 • The term “First Nation” came into common use in the 1970s to replace the term “Indian.” Although
 First Nation is widely used, no corresponding legal definition exists. Some First Nations peoples
 have also adopted the term to replace the word “band” when referring to their community.

 • A “band” is a body of First Nations people who have lands or other resources set aside by the Crown
 for their collective use or who have been declared to be a band for the purposes of the Indian Act.

 • A “reserve” is a tract of land set aside under the Indian Act and through treaty agreements for the
 exclusive use of a band or First Nation. Reserve lands are not owned by bands but are held in trust
 for bands by the Crown. (The Indian Act grants the federal government authority over much of the
 activity on reserves.)

 • “Treaty Status Indians” are persons who belong to a First Nation or band that has signed a treaty
 with the Crown.

 • “Registered Indian” is a legal term indicating persons who are registered under the Indian Act.

(b) First Nations and on-reserve populations
According to the 2016 Canadian census, 1.7 million people with Indigenous identity live in Canada, which
is just under 5 percent of the Canadian population. Table 1 presents the distribution of the Indigenous
population by major identity groups from that census, including First Nations, Métis and Innuk. The
population of First Nations is 977,235, and just over one-third of this population lives on-reserve.

The First Nations population has been increasing rapidly in recent years. Between the 2006 and 2016
censuses, this population grew by more than 39 percent (Statistics Canada 2017). During this period, the
on-reserve population increased by 13 percent, and the off-reserve population grew by 49 percent. The
proportion of First Nations people living on reserves has been declining for a number of years. For example,
in the 2001 Census, 45 percent of the First Nations population lived on-reserve, but only about one-third
of that population lived on-reserve by 2016 (Richards 2018, 2020). Over this period, the proportion of First

3 The current name of the relevant government department is Crown-Indigenous Relations and Northern Affairs Canada. From 1966
 to 2011, it was Indian and Northern Affairs Canada; from 2011 to 2015, it was Aboriginal Affairs and Northern Development Canada
 (AANDC); and from 2015 to 2017, it was Indigenous and Northern Affairs Canada (INAC).

 3
Nations people living in rural, non-urban communities and small cities (those with a population less than
100,000) remained fairly stable at around 30 percent. The share of First Nations people living in large cities,
however, increased from 25 percent to 37 percent (Richards 2018, especially Figure 2 and Figure 3). 4

In addition to the 329,345 registered First Nations people living on-reserve, several thousand First Nations
people who are not registered or treaty status also live on-reserve. In total, 334,385 people live on First
Nations reserves in Canada, according to the 2016 census.

 Table 1: Indigenous population of Canada (2016 Census)

 Indigenous identity Population

 First Nations, registered or treaty status 744,855

 First Nations, not registered 232,380

 Total First Nations 977,235

 of which live on-reserve 334,385

 Métis 587,545

 Inuuk 65,025

 Multiple and other Indigenous identity 43,975

 Total Indigenous population in Canada 1,673,780

 Population of Canada 35,151,728
 Sources: Statistics Canada, Aboriginal Population Profile, 2016 Census, Statistics Canada,
 Focus on Geography Series, 2016 Census, Statistics Canada 2016 Census Profile

(c) First Nations reserves and band offices
As noted above, reserves have been set aside under the Indian Act for the exclusive use of specific First
Nations bands. Band members have the right to live on reserve lands, and band administrative structures
are generally, but not always, located on-reserve. Note also that a single band might control more than one
reserve that has been set aside for that First Nation.

First Nations bands manage their reserves under a framework set out in the Indian Act and implemented
by the federal government. Each band has its own governing council, usually consisting of one chief and
several councillors (AANDC 2012). Community members choose the chief and councillors by election or,

4 See Anderson (2019) for a statistical profile of Indigenous people living in Canadian cities.

 4
sometimes, through custom. The members of a band generally share common values, traditions and
practices rooted in their ancestral heritage.

A band office manages the band’s day-to-day administrative and commercial affairs as well as ongoing
interaction with government departments and other interested parties. Accordingly, we consider that the
reserve band office indicates the administrative and commercial hub of a First Nations reserve. There are
more than 630 band offices in Canada associated with about 3,100 reserves (many of which appear to be
uninhabited and some incompletely enumerated).

3. Data: Locating reserves and cash sources
Our analysis combines the geographical locations of First Nations reserves with the geographical locations
of cash sources in Canada. In this section, we first describe how we geolocate the populations of First
Nations reserves (based on 2016 census data), and then we describe how we geolocate cash sources across
Canada (based on 2018 data). Appendix 1 provides a summary of the various data sources noted in this
section.

(a) Locating reserve populations: Band offices as the origin point
For census purposes, Statistics Canada uses the term “census subdivision” (CSD) to refer to municipalities
or areas that are comparable to municipalities for statistical reporting and aggregation. The populations
living on First Nations reserves are from unique CSDs identified according to criteria established by AANDC.
More specifically, on-reserve populations include people living in any of the six CSD types affiliated with
First Nations or bands. 5

These CSD data provide information on census reserve boundaries and on-reserve populations. They do
not indicate, however, the commercial centre of a reserve or where on a reserve First Nations people reside.
To address our key questions concerning the distance from reserves to cash sources, we need an
economically meaningful geographical location to use as a representative origin point to map to cash
sources. As noted above, we consider that the band office indicates the administrative and commercial hub
of a reserve, and we use its location to also indicate the population hub of a reserve. In other words, we
assume that the location of the band office is also a reasonable way to approximate where people tend to
be on a reserve.

The geographical locations of band offices are registered in the INAC Band Governance Management
System and are recorded in the First Nations dataset (INAC 2016) on the Open Government data portal. 6

5
 These CSD types are Indian reserves, Indian settlements, Indian government districts, Terres réservées aux Cris, Terres réservées aux
 Naskapis and Nisga’a land.
6 When a band controls more than one reserve, the AANDC dataset locates the band office in the most populous reserve associated
 with that that band.

 5
We draw on these sources and compile a dataset that contains 637 unique band office locations. We match
these band office locations to the CSD boundary files and find that 86 percent of band offices are within a
CSD reserve boundary. We also count the number of reserves controlled by each First Nations band by
searching the tribal council profiles provided by Statistics Canada’s 2016 Aboriginal population profile.
(Some First Nation bands in our dataset are not in the latter source, so we manually search for these bands
online and count the number of reserves that they manage.)

Table 2 presents summary data for the band offices. As noted, most band offices (86 percent) are located
on a reserve. The table also provides a measure of proximity to the nearest population centre (as defined
by Statistics Canada), which could influence access to cash sources and other financial services. 7 We
calculated the distance to the nearest population centre with the nngeo package on CRAN (Dorman 2019),
which measures the great-circle distance between two points. (Details on this measure are provided below.)
Table 2 shows that 42 percent of band offices are within 20 kilometres (km) of a population centre.

 Table 2: Band office summary statistics

 Band office variable Number (% of total)

 First Nations band offices in Canada 637 (100%)

 Band offices located on a reserve 546 (86%)

 Band offices with census population data available 607 (95%)

 Band offices associated with a single reserve 382 (60%)

 Band offices within 20 kilometres of a population centre 269 (42%)
 Sources: Statistics Canada 2016 Census, INAC Band Governance Management System, Statistics
 Canada 2016 cartographic boundary files and author calculations.

(b) Locating cash sources
We consider the following primary cash sources:

 • financial institution (FI) branches

 • FI ABMs

 • white label (WL) ABMs.

FIs include banks, trust companies, credit unions and caisse populaires, and Alberta Treasury Branches (ATB).
WL ABMs are owned and operated by entities other than regulated FIs. The geographical locations of these

7 Statistics Canada defines a population centre as an area with a population of at least 1,000 and a population density of 400 persons
 or more per square kilometre. We use the population centre locations from the Statistics Canada 2016 cartographic boundary files.

 6
cash sources are from a dataset created at the Bank of Canada that combines the geographical locations of
FI branches in Canada with the geographical locations of ABMs in Canada.

The FI branch locations (in 2018) are from the Financial Institutions File (FIF) prepared by Payments Canada,
which is a dataset that provides the identities and locations of all FI branches in Canada. We consider only
retail deposit-taking branches in this dataset and exclude other service locations (such as business banking
centres and private wealth branches). Each observation in the raw FIF dataset has a routing number, so a
given branch can be associated with multiple routing numbers due to branch network consolidation or FI
mergers. We therefore consolidate multiple routing numbers associated with the same FI at the same
physical location (latitude and longitude) into a single observation uniquely representing a branch. For
example, two routing numbers at the same location in the raw data owned by the same FI would be merged
into a single branch record of that FI at that location. Chen and Strathearn (2020) provide additional
information on data cleaning and extraction methods, geocoding latitude and longitude coordinates of
branches, and manual checks.

We obtain the ABM locations using a dataset obtained from MasterCard. Differentiating between FI ABMs
and WL ABMs is a key part of our analysis. To do that, we identify all ABMs owned by banks by electronically
searching the database (string matching for “bank” as owner in the database)—we flag these as bank-
owned ABMs. We repeat string matching to identify ABMs owned by trust companies, credit unions and
caisses populaires. We supplement this by manually searching the data to ensure that no ABMs owned by
other FIs (such as Alberta Treasury Branches) were missed in the string-matching exercise. We then identify
all remaining ABMs in the database as WL ABMs. Finally, we recognize the co-locations of FI branches and
FI ABMs at common sites to generate a comprehensive dataset that identifies the geographical locations of
FI branches (with or without ABMs on-site), FI ABMs (which could be co-located at FI branches or stand-
alone) and WL ABMs.

(c) The North West Company and Arctic Co-operatives
The North West Company (NWCo) focuses on remote, small markets and Indigenous communities and is
an important retailer for communities in Northern Canada. Through roughly 130 Northern and Northmart
stores, the NWCo provides a range of retail products, including food and general merchandise, and various
services such as post offices. The NWCo also provides financial services in remote Canadian communities
through its subsidiary, We Financial, which offers tax, cheque-cashing and money-transfer services,
commercial credit as well as a network of ABMs. We Financial also provides a consumer credit card and has
partnered with Visa to provide a direct deposit solution on a NWCo/We Financial Visa prepaid card. 8 We
estimate that 55 percent of NWCo locations are within 20 km of a First Nations band office.

8
 This VISA-processed direct deposit solution enables NWCo/We Financial cardholders to use a routing account number to receive
 direct deposits of government benefits and employment payments and to make online payments and pre-authorized debits. This

 7
Arctic Co-operatives Limited is a service federation that is owned and controlled by 32 community-based
co-operative business enterprises in Nunavut, Northwest and Yukon Territories. Arctic Co-op coordinates
resources, consolidates purchasing power and provides operational and technical support to the
co-operatives to enable them to provide a range of services to their local member-owners, including
WL ABMs. Arctic Co-op also offers a prepaid, reloadable payment card in collaboration with Visa.

All of this suggests that the NWCo and Arctic Co-op contribute to the financial inclusion of Indigenous
communities and could be an important source of cash for some First Nations reserves. In this regard, NWCo
and Arctic Co-op ABMs are captured as WL ABMs in our dataset. Given the other cash services available at
NWCo stores (such as cheque cashing), we also add these stores (geolocated by web-scraping) to our cash
source dataset at a later stage in our analysis.

4. Methodology: Measuring the distance between band
offices and cash sources
The goal in this paper is to measure the distance from each of the 637 band offices and the cash source
that is closest to it. 9 In other words, we try to find the shortest distance between the origin (band office) and
a destination (cash source). We define the shortest distance of band office to cash source as:

 = ∈ �( , ), � , ��,

where denotes an FI branch, FI ABM or WL ABM and lat and lon refer to latitude and longitude coordinates.
Our specific distance measure (∙) can be defined as the geographical distance or the travel distance to the
nearest cash source, which are explained next.

(a) Geographical distance
In this case, we compute the great-circle distance from each band office to the closest cash source using
the nngeo package on CRAN (Dorman 2019). The great-circle distance function (∙) measures the distance
between two points on the surface of a sphere. This distance can be thought of the distance measured “as
the crow flies.” Accordingly, we use the standard great-circle formula to measure the distance between the
coordinates of each band office i and the nearest cash source j:

 product, which can be used instead of a bank or payment account, enables access to electronic payments for people in remote
 communities in Northern Canada who might otherwise have limited access to traditional financial services.
9
 Alternative ways to gain insight into cash access on reserves include, for example, measuring the number of cash sources at the level
 of First Nation CSDs or relative to the population of each CSD. Such measures, however, do not account for the spatial distribution
 of either the population or cash sources in a CSD. Further, the geographical size of these CSDs can be large and vary considerably.
 As well, instead of using distance to measure proximity to cash sources, travel time or travel cost could be used, which might,
 however, vary by season and weather conditions. (For more, see Alasia et al. 2017.)

 8
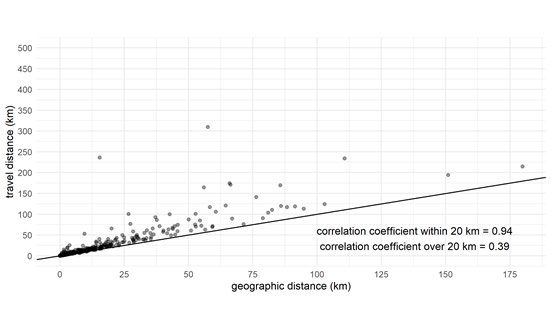
 �( , ), � , �� = 6,371 × [sin( ) × sin� � + cos( ) × cos� �] × cos� − �,

where lat and lon are the latitude and longitude coordinates and sin and cos are the sine and cosine
functions.

(b) Travel distance
Measuring the geographical distance between two points (as above) is convenient. But actually travelling
the associated route (as the crow flies) between any such origin-destination pair could be difficult or
impossible due to practical constraints, such as an intervening lake or mountain.

Geographical distance is likely to correspond closely to actual travel distance if the origin-destination pair
is close together or in a populous area with an adequate road network. This might not be the case, however,
for more isolated and remote areas or over very long distances. As a result, a geographical distance measure
might not reflect the actual travel distance to the nearest cash source in all circumstances.

We therefore also use the Google Travel Matrix Application Program Interface (API) to measure the travel
distance between each band office and the nearest cash source as identified by geographical distance. 10
Because it accounts for the transportation infrastructure and geographical topography, this distance
measure could better reflect proximity to the nearest cash source.

Although using such travel distance measures could improve our measurements, the API does not provide
comprehensive coverage for band office locations, which reduces its usefulness (particularly for large
distances). In our data, a route to the nearest cash source could not be found for 37 of the 637 band offices. 11
We deal with these missing routes in two ways. First, we find that the geographical distance (as the crow
flies) between a given band office and its nearest cash source usually is a good approximation of the travel
distance when the geographical distance is relatively short (within 20 km). Chart 3 plots geographical
distance and travel distance between band offices and nearest cash sources and shows that these two
measures are very similar at relatively short distances. The correlation coefficient between these two series
at distances within 20 km is 0.94. But as distance increases, correspondence between these two measures
declines. At distances greater than 20 km, the correlation coefficient falls to 0.39. Of the 37 missing travel
routes, 14 have a geographical distance within 20 km, so for these specific cases, we use geographical
distance as a proxy for the missing travel distances.

10 For greater clarity, we identify the closest cash source to a band office by geographical distance (as described above). We then
 measure the corresponding travel distance between each such pair using the Google API. An R package was used to interact with
 the API (Azuero Melo, Rodriguez and Zurrak 2018).
11 Manual Google searches indicated that, for some band office locations, the Google API could not map a travel route to a cash source
 even if the geographical distance between the origin-destination pair was small (in three cases, less than 200 metres). Even when
 changing the origin-point to an economically meaningful location, such as an airport, the API could not return a travel distance,
 suggesting that the API has limitations in remote areas.

 9
The second approach used to overcome missing travel distance measures involves assuming that the
remaining 23 missing values (beyond 20 km according to geographical distance) correspond to very large
travel distances between the band office and the closest cash source (or great inconvenience). For these
23 reserve band offices, we assign an extreme value of 500 km (top-coding) because that is just beyond the
largest travel distance that the API was able to map. This adjustment has the effect of increasing the average
travel distance for the overall sample.

Appendix 2 lists the 23 reserve band offices with a geographical distance from a cash source greater than
20 km for which we could not determine a travel route to the closest cash source, and were therefore
assigned an extreme travel distance of 500 km. Inspection of the data in Appendix 2 suggests that assigning
a distance from band office to cash source of 500 km probably overestimates the actual travel distance in
these cases. Further, geographical distance could be a more relevant measure for reserves without four-
season road access to a cash source. On the other hand, poor road connections or transportation links that
are highly susceptible to weather-related interruptions, for example, can make even relatively short
distances to cash sources challenging or costly. (It could be useful to focus specifically on such areas in
future work.)

Chart 4 illustrates these two solutions for the 37 band offices for which no travel distance measure could
be found: Geographical distance substitutes for the 14 missing travel distances within 20 km (as measured
by geographical distance) and 500 km is assigned for the remaining 23 missing observations.

Chart 3: Geographical distance versus travel distance

 10
Chart 4: Solving for missing travel distance measures

Finally, the vast majority of travel routes to closest cash sources identified by the API are road routes.
However, up to five of the identified routes involve a ferry trip. 12 Appendix 3 provides details on these five
cases.

Table 3 summarizes the type of travel routes that we identified.

 Table 3: Nature of travel routes from band offices to closest cash sources

 Total travel routes between band offices to closest cash sources 637 (100%)

 API-identified road routes 595 (93.4%)

 Road route proxied by geographical distance (within 20 km) 14 (2.2%)

 Travel route top-coded at 500 km 23 (3.6%)

 API-identified routes involving a ferry trip* 5 (0.8%)*
 * Inspection of these locations indicates that one of these ferry trips could be replaced by a short
 road route; see Appendix 3 for details.

12
 We thank Tulo Centre colleagues for pointing out this possibility at an earlier stage of this work.

 11
5. Results: Distance from band offices to cash sources
In this section, we present the results of the calculations described above. Table 4 shows the average distance
(median and mean) to the closest cash source for all band offices (regardless of type of cash source). Both
the geographical and travel distance measures are presented. We see that the median distance between
band offices and the nearest cash source is 2.7 km by geographical distance and 3.7 km by travel distance.
The mean travel distances are 12.0 km and 34.0 km, respectively. The discrepancies between the median
and mean indicate, not surprisingly, a skewed distribution with some significant outliers.

 Table 4: Distance from band offices to closest cash source—
 financial institution branches (FI), FI automated bank machines (ABMs) or white label ABMs)

 Geographical
 Travel distance*
 distance

 Median distance to closest cash source 2.7 km 3.7 km*

 Mean distance to closest cash source 12.0 km 34.0 km*

 * With geographical distance for 14 band offices within 20 km from a cash source and 500 km
 assigned to the travel distance to cash for 23 band offices

Chart 5 illustrates the skewed distribution of travel distances to cash sources. Closest cash sources are
generally clustered within a relatively short distance from band offices, but a small number of band offices
are far from a cash source (including top-coded values, at 500 km). Under such conditions, we consider
median distance to be the more representative measure. We discuss these distributional aspects further
below, in more concrete terms.

 12
Chart 5: Cumulative distribution function for travel distance to closest cash source
 (including top-coded values at 500 km)

Table 5 considers which specific type of cash source—FI branch (which could include an ABM), FI ABM
(which might be co-located at a branch or stand-alone) or WL ABM—is generally closest to band offices.
As above, we start by measuring the geographical distance between each band office and the closest
specific type of cash source. We then measure the travel distances corresponding to the closest pairs of
band office and specific cash sources as determined by geographical distance.

Again, we find cases where the Google API could not identify a travel route between band office and specific
cash source, even when they are relatively close together according to geographical distance. Not
surprisingly, we have more missing travel distances when considering specific cash source types compared
with the results above for cash sources regardless of type. More specifically, we find 84 missing travel
distances for the nearest FI branches and FI ABMs and 45 missing travel distances for the nearest WL ABMs.
To deal with this, as before, we use the geographical distance measure to stand in for travel distances within
20 km (according to geographical distance). Even after this step, however, both the FI branch and FI ABM
travel distances are still missing 80 values, and WL ABMs are missing 27. We again assign a distance of
500 km to these missing values, which pushes up the average outcomes.

Table 5 reports the results of these calculations, showing the closest cash sources by type, focusing on the
median travel distances. These results show that, on average, the closest FI branch is about 24 km from a
band office, the nearest FI ABM is just over 26 km away, while the closest WL ABM is 4.5 km away.

 13
Table 5: Distance from band offices to closest cash source by type

 Type of cash source
 Measure

 FI branch FI ABM
 White label ABM
 (could include ABM) (could be at branch)

 Geographical distance 17.4 km 19.4 km 2.9 km
Median distance to
closest cash source
 Travel distance 23.9 km* 26.4 km* 4.5 km*

 Geographical distance 50.9 km 54.4 km 12.7 km
Mean distance to
closest cash source
 Travel distance 113.3 km* 115.7 km* 37.6 km*

* With geographical distance used for those band office-specific cash source pairs that have missing travel distances and
within 20 km from the cash source, and 500 km is assigned for any remaining band office-specific cash source pairs with
missing travel distances.

 The results in Table 4 and Table 5 report average outcomes. Table 6 complements those results by focusing
 concretely on the distribution of outcomes, so it might be more informative. It shows the percentage
 distribution of band offices that have a cash source within specific (arbitrary) distance marks. That is, Table 6
 shows the percentage of band offices that have a cash source within 1 km, 5 km, 10 km and so on. This
 table also introduces NWCo stores as an incremental cash source (as explained above), keeping in mind
 that NWCo ABMs are already included as WL ABMs. Again, we focus on the travel distance measures, in the
 last row.

 Table 6 shows that 32 percent of band offices are within 1 km of a cash source, 54 percent are within 5 km,
 77 percent are within 20 km and 88 percent are within 50 km of a cash source. Note that including NWCo
 stores (distinct from ABMs) has virtually no incremental effect on the results. Finally, we also see that the
 results based on geographical distance (in the top two rows) are broadly similar to the results based on
 travel distance (in the bottom two rows). 13

 13
 Table 6 indicates that 23 percent of band offices are more than 20 km from a cash source. If we assume that First Nations people
 living on reserves are uniformly distributed across all reserves in Canada, then there would be about 76,000 people associated with
 these band offices, spread across a large area of Canada. Similarly, the results in Table 6 suggest that about 40,000 First Nations
 people live on reserves more than 50 km from a cash source. (These estimates might be upper bounds because these more remote
 reserves might be less populous than the average.)

 14
Table 6: Proximity of band offices to a cash source

 Percentage of band offices that have a cash source within:

 1 km 5 km 10 km 20 km 50 km 100 km 400 km

Geographical distance 34% 59% 69% 82% 93% 99% 100%

Geographical distance, 37% 60% 69% 83% 93% 99% 100%
including NWCo stores*

Travel distance 29% 54% 63% 76% 87% 93% 96%

Travel distance, 32% 54% 63% 77% 88% 93% 97%
including NWCo stores

* Cash sources include financial institution (FI) branches, FI automated bank machines (ABMs) and white label ABMs.
North West Company (NWCo ) ABMs are included in WL ABM data. Including NWCo stores reflects the incremental
inclusion of additional cash services provided at those outlets (such as cheque cashing). This has virtually no impact on
results. The data include band offices top-coded at 500 km; see Appendix 2.

 Finally, Chart 6 shows the frequency distribution of closest cash sources by type. Consistent with Table 5,
 this chart indicates that WL ABMs are the most common closest cash source, accounting for about two-
 thirds of closest cash sources. 14 Further inspection of our dataset indicates that these WL ABMs are located
 mostly at retail stores, gas stations and grocery stores. (At this point, we have little information on the terms
 of access for these ABMs, such as costs and withdrawal limits; we are exploring acquisition of these data.)

 14
 Chart 6 excludes 22 band office-specific cash source pairs found by geographical distance for which no travel route could be found
 with the Google Travel API.

 15
Chart 6: Distribution of closest cash sources to band offices by type of source

Note: This chart presents the frequency distribution of closest cash sources by type of source, which includes
financial institution (FI) branches and automated banking machines (ABMs), white label (WL) ABMs and
North West Company (NWCo) stores. See text for details.

6. Concluding remarks
One of the Bank of Canada’s core interests is to reliably provide bank notes to the public, including remote
communities. In this paper, we consider access to cash for First Nations reserves. The population of First
Nations in Canada is about 1 million, and about one-third of First Nations people live on-reserve.

Our goal is to measure the distance between First Nations reserves and Canadian-dollar cash sources. To
do so, we identify inhabited First Nations reserves across Canada and the location of corresponding band
offices. The latter are the reserve administrative or commercial hubs, and we consider band offices to also
represent the population hubs of reserves. We use a dataset of cash sources in Canada to locate FI branches,
FI ABMs and WL ABMs. We then measure the distance from each band office to the nearest cash source
according to geographical distance (“as the crow flies”) and according to travel distance. We focus on the
latter as the more practical measure, and we find that almost all of the travel routes from band offices to
the closest cash source are road routes (Table 3).

 16
Our main results are as follows:
 • The average (median) travel distance from band offices to the closest cash source is 3.7 km (without
 regard to the type of cash source, Table 4).

 • The median distance from band offices to the closest FI branch and to the nearest FI ABM is about
 25 km, and the median distance to the closest WL ABM is 4.5 km (Table 5).

 • Almost a third of band offices are within 1 km of a cash source, over half are within 5 km, over three
 quarters are within 20 km and almost 90 percent of band offices are within 50 km of a cash source
 (Table 6).

 • The results are highly skewed, and some band offices are far from a cash source (Chart 5).

 • WL ABMs are the most common closest cash source, located mostly at retail stores, gas stations
 and grocery stores (Table 5 and Chart 6).

Access to financial services—physical and electronic banking
The median travel distance to the closest FI branch, about 25 km, also informs understanding of the
proximity of First Nations reserves to financial services more generally, including access to cash along with
other services such as savings and credit products. The skewed nature of these data, however, suggests that
some band offices are far from an FI branch. Access to financial services is also influenced by reliable phone
and broadband internet service, which is important for online personal banking, electronic payment
processing and online commerce more generally. Most First Nations reserves (87 percent) have access to a
basic broadband download speed of 5 megabits per second (Mbps) and an upload speed of 1 Mbps
(CRTC 2020). This is adequate for basic internet activities, such as accessing government services, social
media, basic video streaming and online personal banking. 15

Faster broadband speeds, such as download/upload speeds of 50/10 Mbps, are needed for more
sophisticated cloud-based software applications and services, online business applications and to support
multiple simultaneous users. Availability of such speeds on First Nations reserves is limited, with only
35 percent of reserves having access to this level of service. Further, and importantly, more remote
communities rely on satellite-based service, which is more susceptible to interruptions (Appendix 4). As
part of a broader connectivity strategy, the Government of Canada has made a particular commitment to
meet the broadband needs of Indigenous communities (ISED 2019).

A complete assessment of First Nations access to financial services is beyond the scope of this paper and is
left for future research. As well as physical and electronic proximity to financial services (noted above), this
research could also draw on other aspects, such as Indigenous financial literacy and capability. (On these

15
 See Appendix 4 for more on these aspects.

 17
latter points, see, for example, Buckland, McKay and Reimer 2016, Buckland 2017, Collin 2011, and the
Tulo Centre.)

Next steps
Looking ahead, a number of questions follow from this paper for future work:

 • What access to cash and other payment methods, and to financial services, do the most remote
 First Nations reserves have? Which methods of payments are used for transactions? A focus on the
 most remote reserves that have relatively poor access to cash and other financial services might be
 particularly useful. This might include consideration of the First Nations bands set out in Appendix
 2 and Appendix 3 as well as those identified as relatively remote in Table 6. 16 (The results could
 also be compared with other indicators of remoteness and access, as in Alasia et al. 2017 and INAC
 2000.)

 • What access to cash and other payment methods do marginalized communities have, including in
 urban settings? How are such communities identified? Do other important sources of cash exist in
 these communities? Are employers a significant source of cash? Should payday lending be
 considered a source of cash (Brennan, Buckland and McGregor 2011)? Would a central bank digital
 currency provide meaningful benefits for such communities?

 • What access to cash sources and financial services should be reasonably expected for Indigenous
 and other Canadians living in remote areas and in lower-income urban areas? What sort of
 normative considerations could apply?

16
 For instance, a sample of 50 remote reserves can be constructed as follows: Appendix 2 (no travel route to cash) indicates 23
 reserve band offices; Appendix 3 (travel route requires a ferry/boat trip) indicates five band offices; and the data summarized in
 Table 6 indicate that 22 band offices have an identified road route to cash greater than 100 km. (Lowering the threshold from 100
 km to 50 km would add around 30 band offices.) As well as being physically remote from cash sources and FI branches, internet
 access is poor for many of these locations (ISED Canada and author calculations).

 18
References
Aboriginal Affairs and Northern Development Canada (AANDC, archived content). 2012. “Terminology.”
Accessed July 14, 2020.

Alasia, A., F. Bédard, J. Bélanger, E. Guimond and C. Penney. 2017. “Measuring Remoteness and Accessibility:
A Set of Indices for Canadian Communities.” Report on Special Business Projects, Statistics Canada.

Anderson, T. 2019. “Results from the 2016 Census: Housing, Income and Residential Dissimilarity Among
Indigenous People in Canadian Cities.” Insights on Canadian Society, Statistics Canada.

Azuero Melo, R., D. Rodriguez T. and D. Zarruk. 2018. “Distance and Travel Time Between Two Points from
Google Maps.” R package version 3.4. https://CRAN.R-project.org/package=gmapsdistance

Bank of Canada. 2019. Annual Report.

Bilkes, G. 1997. “The New Bank Note Distribution System.” Bank of Canada Review (Summer): 41–54.

Brennan, M., B. McGregor and J. Buckland. 2011. “The Changing Structure of Inner-city Retail Banking:
Examining Bank Branch and Payday Loan Outlet Locations in Winnipeg, 1980–2009.” Canadian Journal of
Urban Research 20 (1): 1–32.

Buckland, J. 2017. “Indigenous Financial Empowerment through Enhancing Capability and Inclusion.”
Presentation to AFOA Canada National Conference, Calgary, Alberta.

Buckland, J., D. McKay and N. Reimer. 2016. “Financial Inclusion and Manitoba Indigenous Peoples: Results
from an Urban and a Rural Case Study.” Canadian Centre for Policy Alternatives.

Canadian Radio-television and Telecommunications Commission. 2019. CRTC Communications Monitoring
Report 2020. Accessed March 22, 2021.

Collin, D. 2011. “Aboriginal Financial Literacy in Canada: Issues and Directions.” Paper prepared for the Task
Force on Financial Literacy.

Chen, H. and M. Strathearn. 2020. “A Spatial Model of Bank Branches in Canada.” Bank of Canada Staff
Working Paper 2020-4.

Delaney, L., A. O’Hara and R. Finlay. 2019. “Cash Withdrawal Symptoms.” Reserve Bank of Australia Bulletin.
June.

Dorman, M. 2019. “nngeo: k-Nearest Neighbor Join for Spatial Data. R package version 0.3.0.”
https://CRAN.R-project.org/package=nngeo

Innovation, Science and Economic Development (ISED) Canada. “High-Speed Access for All: Canada's
Connectivity Strategy.” Accessed July 20, 2020.

Innovation, Science and Economic Development (ISED) Canada. “National Broadband Internet Service
Availability Map.” Accessed March 8, 2021.

Indian Act, R.S.C., 1985, c. I-5. Accessed July 14, 2020.
 19
Indian and Northern Affairs Canada (INAC). 2000. Band Classification Manual. Accessed March 2, 2021.

Indigenous and Northern Affairs Canada (INAC). 2016. First Nations Locations. Retrieved from
https://open.canada.ca/data/en/dataset/b6567c5c-8339-4055-99fa-63f92114d9e4.

Lane. T. 2020. Money and Payments in the Digital Age. Remarks to CFA Montréal FinTech RDV2020. Montréal,
Quebec. February 25.

Richards, J. 2018. “Pursuing Reconciliation: The Case for an Off-Reserve Urban Agenda. CD Howe Institute
Commentary no. 526.

Richards, J. 2020. “No Easy Answers: Insights into Community Well-being among First Nations.” CD Howe Institute
E-Brief.

Statistics Canada. 2016. “Population Centre Boundary File, 2016 Census.” Catalogue no 92-166-X.

Statistics Canada. 2016. “Aboriginal Population Profile,” 2016 Census.

Statistics Canada. 2016. “Focus on Geography Series,” 2016 Census.

Statistics Canada. 2017. “Aboriginal peoples in Canada: Key results from the 2016 Census.” The Daily. October 25.

Tulo Centre for Indigenous Economics (various webpages).

 20
Appendix 1: Summary of selected data sources (noted in
 Section 3)
Data Description and source

Band office locations Geographical locations of First Nations are from a dataset provided by Aboriginal
 Affairs and Northern Development Canada (AANDC). Each geographical coordinate
 represents the address for a band’s administrative office as registered in Indigenous
 and Northern Affairs Canada (INAC) Band Governance Management System
 (BGMS), recorded in the First Nations dataset (INAC 2016) on the Open Government
 data portal. Date last modified is March 1, 2016.
ABM locations Geographical locations of ABMs are from a dataset obtained from MasterCard. This
 dataset also identifies the owner of each ABM, which facilitates differentiating white
 label ABMs and FI-owned ABMs. This dataset is updated annually.
Financial institution branch Locations of financial institution branches are from the Financial Institution File (FIF)
locations provided by Payments Canada. The FIF (.pdf) can be found here. See Chen and
 Strathearn (2020) for an explanation of the data extraction method and related
 considerations. This dataset is updated annually; a 2018 vintage was used.
Census subdivision Census subdivision (CSD) is a term used by Statistics Canada for municipalities or
boundaries other areas that are comparable to municipalities for statistical reporting and
 aggregation. The 2016 CSD cartographic boundary file contains the boundaries of
 all census subdivisions, covering all of Canada. Of the 54 CSD types, 6 are associated
 with reserves:
 • Indian reserves
 • Indian settlements
 • Indian government districts
 • Terres réservées aux Cris
 • Terres réservées aux Naskapis (TK)
 • Nisga’a land
 The reference date for the geographic area boundaries in the cartographic boundary
 files is January 1, 2016.
Census subdivision The 2016 Census Profile provides socioeconomic data for reserves (or other CSD
socioeconomics types if the band office does not correspond to a reserve). The reference date for
 this dataset is May 10, 2016.
Population centre Statistics Canada defines a population centre as an area with a population of at least
boundaries 1,000 and a population density of 400 persons or more per square kilometre.
 Geographical locations for population centres are from the 2016 cartographic
 boundary files on Statistics Canada. The reference date for this dataset is January 1,
 2016.
North West Company The North West Company provides the location of its stores on its website; see the
stores store locator tool. Store locations were webscraped on November 25, 2020, using
 an R script.

 21
Appendix 2: Selected remote reserves and band offices
 Table A2-1 shows First Nations reserves associated with band offices more than 20 km by geographical
 distance from a cash source and for which no route to closest cash source could be found using the Google
 Travel API. These were assigned a travel distance to cash of 500 km.
 Table A2-1: Selected remote reserves and band offices
 Band name Province Census subdivision Population Geographical Geographical
 (CSD) in which band of band distance to a distance to
 office is located* office CSD* town (km) cash (km)
1. Montagnais de Pakua Shipi QC Pakuashipi 237 people 214.53 50.34
2. Kingfisher ON Kingfisher Lake 1 511 345.29 35.27
3. Martin Falls ON Marten Falls 65 252 209.94 59.27
4. North Spirit Lake ON Kenora, 6,737* 168.65 54.19
 Unorganized*
5. Northwest Angle No. 33 ON Northwest Angle 95 53.81 28.88
 33B
6. Temagami First Nation ON Bear Island 1 153 54.69 23.74
7. Wawakapewin ON Wawakapewin (Long 22 379.54 36.66
 Dog Lake)
8. Red Sucker Lake MB Red Sucker Lake 675 91.31 74.22
9. Athabasca Chipewyan First AB Wood Buffalo* 71,589* 168.48 20.96
 Nation
10. Da’naxda’xw First Nation BC Dead Point 5 10 32.89 23.40
11. Dzawada’enuxw First BC Quaee 7 78 76.11 68.46
 Nation
12. Gitxaala Nation BC Dolphin Island 1 353 55.23 57.52
13. Gwawaenuk Tribe BC Hopetown 10A* 0* 41.26 35.72
14. Hesquiaht BC Refuge Cove 6 44 70.00 35.58
15. Ka:‘yu:’k’t’h’/Che:k:tles7et’h’ BC Houpsitas 6 181 64.60 38.52
 First Nations
16. Kwiakah BC Strathcona C* 2,431* 39.80 35.78
17. Kwikwasut’inuxw BC Gwayasdums 1 27 34.97 26.28
 Haxwa’mis
18. Lhoosk’uz Dene Nation BC Kluskus 1 36 107.20 107.88
19. Tlatlasikwala BC Hope Island 1* 0* 36.05 38.20
20. Wuikinuxv Nation BC Katit 1 90 105.89 78.78
21. Nahanni Butte NT Nahanni Butte 87 248.56 86.59
22. Sambaa K’e First Nation NT Sambaa K’e 88 197.76 121.58
23. Aishihik YT Yukon, 1,515* 154.08 86.59
 Unorganized*
 * Four of the CSDs listed here are not reserves: Kenora, Unorganized (row 4); Wood Buffalo (row 9);
 Strathcona C (row 16); and Yukon, Unorganized (row 24). Wood Buffalo CSD is a “specialized municipality”
 CSD that includes the city of Fort McMurray, which has a population of 67,573 (2016 Census). Two CSDs
 (Hopetown 10A and Hope Island 1) record a population of zero; this might reflect privacy or other concerns.
 Sources: Statistics Canada, Census Subdivision Profile, 2016 Census and author calculations.
 22
Appendix 3: Travel routes from band offices to cash sources
 involving a ferry trip
 Table A3-1 shows the identified travel routes from a band office to closest cash source that involve a ferry
 trip on the route.

 Table A3-1: Travel routes from band offices to cash sources involving a ferry trip

 Census subdivision Population of Geographical Travel
 Band name Province
 (CSD) in which band band office distance to distance to
 office is located CSD* cash (km) cash (km)

 1. Chippewas of ON Chippewas of 261 people 5.44 5.67
 Georgina Georgina Island
 (Lake Simcoe)
 Island

 2. Beausoleil ON Christian Island 30 614 4.60 4.79

 (Georgian Bay)

 3. Penelakut BC Penelakut Island 7 452 1.13 4.50
 Tribe
 (off SE coast of
 Vancouver Island)

 4. Uchucklesaht* BC Elhlateese 2* 5 23.03 28.03

 (central west coast
 Vancouver Island)

 5. Ehattesaht* BC Chenahkint 12* 0† 15.54 236.28

 (NW Vancouver
 Island)

*The Uchucklesaht Tribe website provides a different location for the band office than indicated in our dataset
(based on INAC files). That website indicates that its tribe office is located in Port Alberni, BC, and that the population
of the tribe is 299, living in two villages about 24 miles (39 kms) from Port Alberni (one of which is Ehthlateese).
*The Ehattesaht First Nation website provides a different location for the band office than indicated in our dataset
(based on INAC files). The band website also indicates that the reserve is accessible by helicopter, plane and
logging road and does not include a ferry trip. Further examination indicates that there is a cash source (WL ABM)
1.4 km by road from the band office. For the calculations presented in the paper, we retain the much larger travel
distance in the table above. This has little effect of on our main summary measures, such as the median distances,
or the distributions presented in Table 6.
†A population record of zero might reflect privacy or other concerns.
Sources: Statistics Canada, Census Subdivision Profile, 2016 Census, and author calculations.

 23
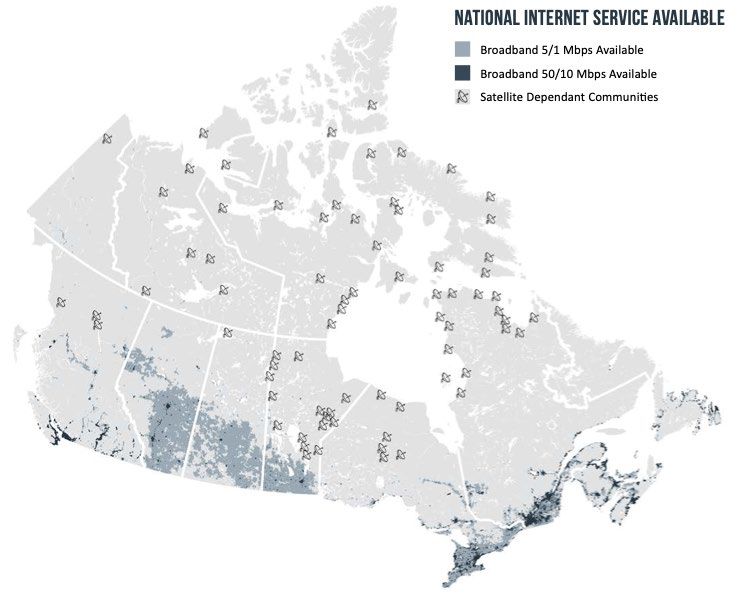
Appendix 4: First nations broadband access
Until 2016, the Canadian Radio-television and Telecommunications Commission (CRTC) and governments
across Canada shared a goal of universal broadband access with a download speed of 5 megabits per
second (Mbps) and an upload speed of 1 Mbps (ISED 2019). This is adequate for basic internet activities,
such as accessing government services, social media, basic video streaming and online personal banking.
Table A4-1 shows that such basic broadband service was available to the vast majority of Canadians in 2019
(98 percent of households), including 100 percent of households in urban centres. But coverage is not
complete in rural areas of Canada, where such basic internet speeds are available to 92 percent of
households.

Urban areas of Canada already have near-universal access (99 percent of households) to much faster
broadband download/upload speeds of 50/10 Mbps plus unlimited data transfer capacity. These speeds
are needed for more sophisticated cloud-based software applications and services, high-definition
streaming, online business applications and supporting multiple simultaneous users. Again, availability lags
in rural areas, with 46 percent of rural households having access to this level of service.

As shown in Table A4-1, 87 percent of First Nations reserves have access to basic broadband
download/upload speeds of 5/1 Mbps. But availability of 50 Mbps download speeds and 10 Mbps upload
speeds in First Nations reserves is limited, with only 35 percent of reserves having access to this service.
Further, this advanced service level was available to only 2 percent of reserves in Manitoba and
Saskatchewan and not available at all to First Nations reserves in Newfoundland and Labrador, Yukon and
Northwest Territories (CRTC 2020).

Chart A4-1 illustrates the availability across Canada of basic and advanced broadband speeds and identifies
areas that are dependent on satellite transmission for internet connectivity. Satellite service typically has
relatively slow download/upload speeds, suffers from poor latency and is susceptible to weather-related
disruptions. These satellite-dependent areas are generally in more northern and remote areas of Canada.

The Government of Canada has committed to making 50 Mbps download speeds, 10 Mbps upload speeds
and unlimited service available to 90 percent of all Canadian households by the end of 2021, 98 percent of
households by 2026, and for the remaining areas to have such access by 2030 (ISED 2019 and PMO). In this
context, the government also has made a particular commitment to meet the broadband needs of
Indigenous communities.

 24
Table A4-1: Broadband service availability in Canada, by speed in 2019

 At least 5/1 At least 10 Mbps At least 25 Mbps 50/10 Mbps and unlimited
 Mbps data capacity

All households 98.2% 97.2% 95.0% 87.4%

Urban households 99.9% 99.8% 99.4% 98.6%

Rural households 91.7% 87.1% 77.6% 45.6%

First Nations reserves 87.1% 74.5% 59.3% 34.8%

 Notes: Urban households live in population centres of at least 1,000 people with a population density of
 400 persons or more per square kilometre. All areas outside of population centres are classified as rural
 areas.

 Source: Figure 4.8, Figure 4.9 and Figure 4.10 of “Availability of Broadband in Various Communities,” in
 CRTC (2020).

 25
Chart A4-1: National internet service

Note: This map depicts broadband internet coverage in Canada by speeds of 5 Mbps download and 1 Mbps
upload (5/1), by 50 Mbps download and 10 Mbps upload (50/10) and identifies satellite-dependent areas.

Source: ISED (2019)

 26
You can also read