X-ray ptychographic topography: A robust nondestructive tool for strain imaging
←
→
Page content transcription
If your browser does not render page correctly, please read the page content below
PHYSICAL REVIEW B 103, 144107 (2021)

              X-ray ptychographic topography: A robust nondestructive tool for strain imaging

        Mariana Verezhak ,1,* Steven Van Petegem ,1 Angel Rodriguez-Fernandez,2 Pierre Godard ,3 Klaus Wakonig,1,4
                 Dmitry Karpov,1 Vincent L. R. Jacques,5 Andreas Menzel ,1 Ludovic Thilly,3 and Ana Diaz 1
                                1
                                  Paul Scherrer Institute, Forschungsstrasse 111, 5232 Villigen PSI, Switzerland
                                          2
                                            European XFEL, Holzkoppel 4, 22869 Schenefeld, Germany
                             3
                               Institut Pprime, CNRS-University of Poitiers-ENSMA, SP2MI, Futuroscope, France
                        4
                          ETH and University of Zürich, Institute for Biomedical Engineering, 8093 Zürich, Switzerland
                    5
                      Laboratoire de Physique des Solides UMR8502, CNRS, Université Paris-Saclay, 91405, Orsay, France

                         (Received 3 July 2020; revised 16 February 2021; accepted 5 April 2021; published 30 April 2021)

                   Strain and defects in crystalline materials are responsible for the distinct mechanical, electric, and magnetic
                properties of a desired material, making their study an essential task in material characterization, fabrication, and
                design. Existing techniques for the visualization of strain fields, such as transmission electron microscopy and
                diffraction, are destructive and limited to thin slices of the materials. On the other hand, nondestructive x-ray
                imaging methods either have a reduced resolution or are not robust enough for a broad range of applications.
                Here we present x-ray ptychographic topography, a method for strain imaging, and demonstrate its use on an InSb
                micropillar after microcompression, where the strained region is visualized with a spatial resolution of 30 nm.
                Thereby, x-ray ptychographic topography proves itself as a robust nondestructive approach for the imaging of
                strain fields within bulk crystalline specimens with a spatial resolution of a few tens of nanometers.

                DOI: 10.1103/PhysRevB.103.144107

                        I. INTRODUCTION                                      obtained with a polychromatic x-ray beam and each diffrac-
                                                                             tion spot comes from a different crystalline plane. The peak
    Progress in advanced materials, from lightweight compos-
                                                                             position depends on the average crystal orientation and unit
ites to biomedical technology, relies on understanding the
                                                                             cell parameters, while the width provides information on the
relationship between the structure and properties of a material.
                                                                             strain gradient within the illuminated volume. Therefore, any
In addition to the chemical composition and crystalline lattice,
                                                                             change in peak positions and/or widths is the footprint of a
strain fields caused by defects also regulate material prop-
                                                                             specific strain field in the crystal caused by the presence of
erties. Therefore, the detection and characterization of strain
                                                                             particular defects or lattice distortions. In such experiments,
and its relation to the type and concentration of defects in the
                                                                             spatial resolution is achieved by focusing the beam and raster
crystal at the nanoscale is an essential, albeit challenging task.
                                                                             scanning the sample at different positions [6]. Monochromatic
    Transmission electron microscopy (TEM) provides imag-
                                                                             x-ray diffraction microscopy in full field [7] and scanning
ing of crystalline defects with atomic spatial resolution.
                                                                             mode [8,9] have also been able to reveal the strain field in
However, due to the limited penetration depth of electrons,
                                                                             crystalline samples with the spatial resolution limited by the
invasive sample preparation of thin sections is required, which
                                                                             focusing lens.
can modify the strain fields to be analyzed [1]. X-ray diffrac-
                                                                                With advancements in synchrotron brilliance and degree of
tion, on the other hand, is a noninvasive alternative which
                                                                             spatial coherence, probing individual crystalline defects like
is sensitive to atomic displacements [2]. X-ray topography
                                                                             dislocations became possible [10]. Coherent x-ray diffraction
(XRT) [3,4] has been routinely used for imaging the defect
                                                                             microscopy has enabled nanometer spatial resolution beyond
microstructure in the micrometer- to centimeter-sized crystals
                                                                             focusing optics limitations [11,12]. Bragg coherent diffraction
based on the diffraction contrast. In XRT, the image contrast
                                                                             imaging (BCDI) is based on measuring the far-field diffraction
comes from variations in the crystal lattice spacing and/or ori-
                                                                             patterns of a fully illuminated crystal placed in the Bragg
entation, with the resolution limited by the detector pixel size.
                                                                             condition and subsequent application of a phase retrieval al-
    To achieve higher spatial resolution with x rays, x-ray
                                                                             gorithm for image reconstruction. Thus, BCDI provides 3D
focusing optics were introduced, as for example in Laue x-
                                                                             maps of the atomic displacement field within a small, iso-
ray microdiffraction [5]. Here, the diffraction patterns are
                                                                             lated nanocrystal with a spatial resolution of a few tens of
                                                                             nanometers [13]. On the other hand, ptychographic methods,
                                                                             based on measuring a series of diffraction patterns at a set
 *
     Corresponding author: mariana.verezhak@psi.ch                           of overlapping areas [14], enable the application of coherent
                                                                             methods to larger crystalline specimens. Bragg ptychogra-
Published by the American Physical Society under the terms of the            phy is also capable of imaging strain; however, the strict
Creative Commons Attribution 4.0 International license. Further              requirements on the specimen translation and beam stability
distribution of this work must maintain attribution to the author(s)         make the technique difficult to apply, especially in 3D [15].
and the published article’s title, journal citation, and DOI.                Bragg projection ptychography [16] has more relaxed stability

2469-9950/2021/103(14)/144107(9)                                 144107-1                             Published by the American Physical Society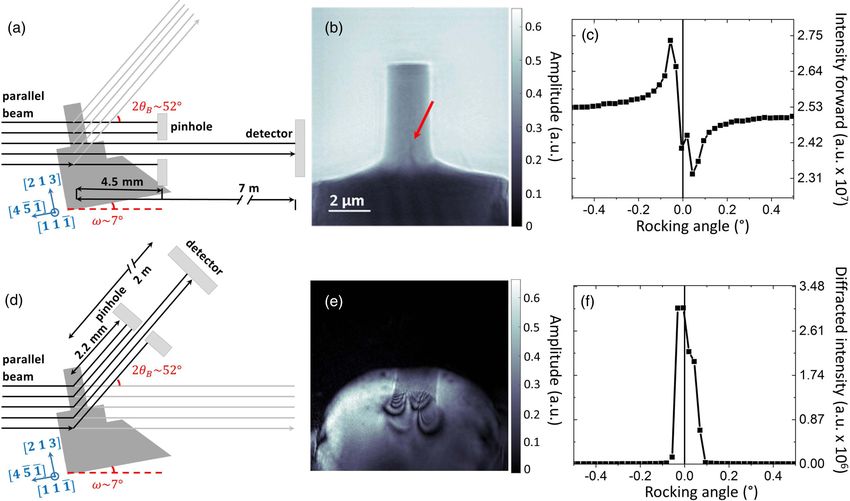
MARIANA VEREZHAK et al. PHYSICAL REVIEW B 103, 144107 (2021)
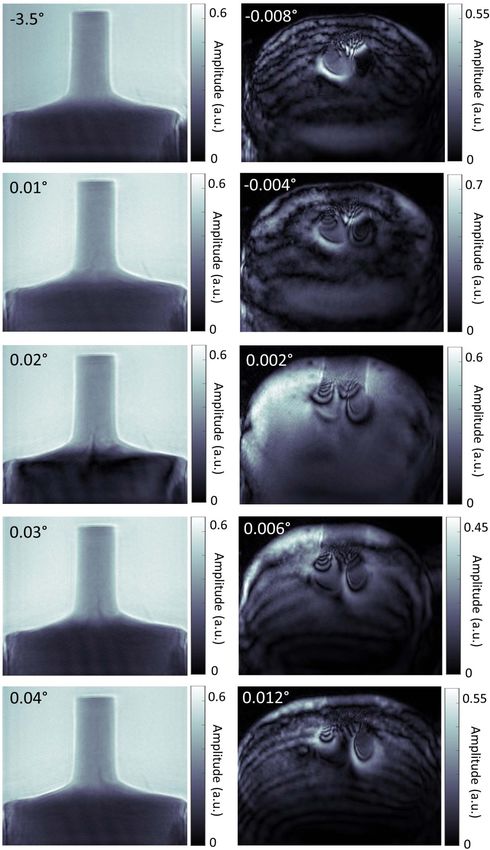
FIG. 1. Ptychographic topography acquisition scheme. Step (1) focused beam: sample alignment and diffraction peak detection from
nonstrained crystal region using microscope, focusing optics, and 2D detector along the diffracted beam. Focusing optics include Fresnel zone
plate (FZP), central stop (CS), and order-sorting aperture (OSA). Step (2) parallel beam: ptychographic topography with parallel beam. A
pinhole is scanned after the sample and far-field patterns are recorded with the detector along the forward direction. Note: the two steps are
performed consecutively.
requirements, but due to the divergence of the incoming beam II. METHODS
the method is not working for crystals with lattice displace-
A. The principle of ptychographic topography
ments within the scattering plane. In such cases, it is not
always the same part of the convergent incoming beam that The concept of ptychographic topography consists of
is diffracted, contradicting the hypothesis of a constant probe, placing the crystal in diffraction condition for specific crys-
as discussed in Ref. [17]. This reduces the robustness of the tallographic planes and performing ptychographic scans in
image reconstruction in Bragg ptychography. the forward (or diffraction) direction with a pinhole scanned
Taking advantage simultaneously of the high strain sensi- several millimeters after the sample to reconstruct the exit
tivity, large field of view, and simplicity of x-ray topography, wave field at the pinhole position. The resulting image is
as well as the high spatial resolution of x-ray ptychography, then numerically backpropagated to the crystal position and
we propose an x-ray imaging technique, ptychographic topog- is sensitive to lattice imperfections.
raphy, for robust and flexible strain field imaging in extended As shown in Fig. 1, first the sample’s region of interest is
selected via an auxiliary visible light microscope. While set-
crystalline samples with high spatial resolution. This method
ting up the experiment, we used a focused beam configuration
exploits the high strain sensitivity provided by a parallel,
to illuminate a region of the sample which has no crystalline
monochromatic incident beam in combination with the con-
defects, and to find and center the diffraction peak on the
cept of tele-ptychography [17] to reconstruct the exit wave detector placed along the diffracted beam as shown in step
field a few millimeters downstream of the sample. Subsequent (1) in Fig. 1.
numerical backpropagation of the reconstructed wave field to To perform the ptychographic topography measurement,
the sample position provides the exit wave after parallel x rays we switch to the parallel beam configuration [step (2) in
propagate through the crystal. This approach offers straight- Fig. 1]. A pinhole is placed a few millimeters after the sam-
forward reconstructions, even in the case of complicated strain ple and is scanned perpendicular to the beam, providing the
fields, with the resolution not limited by lenses. sufficient overlap of the pinhole area at neighboring scan
In this paper, we describe the application of this technique positions required for ptychographic reconstructions [17,18].
to strain mapping of InSb micropillars that were uniaxially The diffraction patterns are recorded with a 2D detector
compressed up to the plastic deformation regime. The strain downstream of the pinhole along the forward (or diffraction)
field is visualized in two different configurations of ptycho- direction in the far field and are used for the reconstruction
graphic topography, in forward and diffraction directions. of the wavefront at the pinhole position using ptychographic
The advantages and limitations of both configurations are ex- phase retrieval. Numerical backpropagation to the sample
plained and the effect of dynamical diffraction on the observed plane then results in an image of the sample sensitive to the
results is discussed. lattice displacements caused by defects.
144107-2
X-RAY PTYCHOGRAPHIC TOPOGRAPHY: A ROBUST …                                                      PHYSICAL REVIEW B 103, 144107 (2021)

    FIG. 2. Mechanical deformation of InSb micropillars. (a) SEM image of the pillar and its pedestal after uniaxial compression along the
[2 1 3] crystallographic direction to reach the plastic deformation regime (applied force of 2.35 mN). Scale bar: 5 μm. (b) Force-displacement
curve of the compression test that confirms that the sample was plastically deformed.

    By rotating the sample and performing measurements at                a Fresnel zone plate of 200 μm diameter and 90 nm outermost
different angular steps close to a diffraction condition, quan-          zone width upstream of the sample with a central stop of
titative information about the amount of strain and lattice              60 μm diameter and an order-sorting aperture of 30 μm di-
rotations can be obtained. To recover all components of the              ameter. Such optical layout allowed achieving an illumination
three-dimensional displacement field one would need to mea-              spot size of ∼100 nm in diameter. InSb samples were then
sure at several nonequivalent diffraction peaks.                         brought to the (2 0 2) diffraction condition (similar to the
                                                                         geometry in Ref. [22]) at 6.2 keV, corresponding to a Bragg
        B. InSb micropillars upon uniaxial compression                   angle θB = 25.88◦ and an orientation angle of the sample
                                                                         ω ∼ 7◦ , as shown in Fig. 3(a) and Fig. 3(d).
    Focused ion beam (FIB) milled InSb single-crystalline
                                                                            The region well below the pillar, i.e., the pedestal, was
cylindrical micropillars were used to demonstrate the potential
                                                                         chosen for the diffraction peak alignment as a region without
of the method. The samples were prepared by ion milling with
                                                                         crystalline defects. The rocking curves were recorded with
Ga+ focused ion beam (FIB) on an InSb single-crystalline
                                                                         an Eiger 500 K detector [23] placed along the diffraction
wedge with known orientation in the form of a series of
                                                                         direction and a Pilatus 2M detector [24] along the forward
cylindrically shaped micropillars on cylindrical pedestals. The
                                                                         direction. The rocking curves obtained at the pedestal position
pillars dimensions are 2 μm in diameter and 6 μm in height.
                                                                         are shown in Fig. 3(c) and Fig. 3(f).
The pedestals dimensions are 10 μm in diameter and 10 μm
                                                                            For forward ptychographic topography, the setup was then
in height. A scanning electron microscopy (SEM) image of
                                                                         switched to the parallel-beam configuration, in which the
such a pillar is shown in Fig. 2(a). Two equivalent pillars
                                                                         beam is partially coherent with a transversal coherence of
(S1 and S2) were investigated by ptychographic topography
                                                                         about 300 μm in the vertical direction and 30 μm in the hor-
for reproducibility. The results from sample S1 are presented
                                                                         izontal direction. For this purpose we removed the focusing
below while those from sample S2 are shown in the Supple-
                                                                         optics and placed a pinhole of ∼3.5 μm diameter on a 2D
mental Material [19].
                                                                         piezo translation stage 4.5 mm downstream from the sample
    The micropillars were uniaxially compressed with a dedi-
                                                                         in the forward direction. Samples were rocked around the (2
cated microcompression device [20] along the pillar vertical
                                                                         0 2) diffraction peak in a range of ±0.7◦ with a step size
axis that corresponds to the [2 1 3] direction, favoring only
                                                                         of 0.01◦ . At each rocking angle, the pinhole was scanned
one dislocation slip system [21]. The pillars were compressed
                                                                         after the sample perpendicular to the incoming beam with a
up to a force of 2.35 mN (S1) and 2.5 mN (S2), corresponding
                                                                         step size of 0.5 μm and 0.2 s exposure time covering a field
to the plastic regime, which led to an irreversible reduction of
                                                                         of view of 12 × 12 μm2 . The scanning positions followed
the pillars height of about 300 nm (S1) and 500 nm (S2) (i.e.,
                                                                         a Fermat spiral pattern [25]. The diffraction patterns were
about 5% and 8% of their initial height, respectively). This
                                                                         recorded with a Pilatus 2M detector, placed at 7.338 m from
can be seen as a residual displacement after unloading at the
                                                                         the sample in the forward direction. The schematic of the
force-displacement curve shown in Fig. 2(b). In addition, slip
                                                                         described experiment is shown in Fig. 3(a).
traces [pointed to with red arrows in Fig. 2(a)] are visible at
                                                                            The second experiment was performed in the diffraction
the pillar surface.
                                                                         geometry, using the parallel-beam configuration, a 2 μm pin-
                                                                         hole carried by the 2D piezo motors was placed at 2.2 mm
  III. PTYCHOGRAPHIC TOPOGRAPHY IN FORWARD
                                                                         downstream from the sample in the diffracted beam direc-
           AND DIFFRACTION GEOMETRY
                                                                         tion and used for scanning, see schematic in Fig. 3(d). The
   We demonstrate the implementation of ptychographic to-                smaller, 2 μm pinhole was used for appropriate sampling for
pography in both the forward and diffraction direction at the            ptychography at 2.171 m. The data was acquired with the
cSAXS beamline at the Swiss Light Source (SLS). In both                  Eiger 500 K detector, placed at 2.171 m along the diffracted
cases, we first used the focused beam configuration. We used             beam direction. Samples were rocked around the (2 0 2)

                                                                  144107-3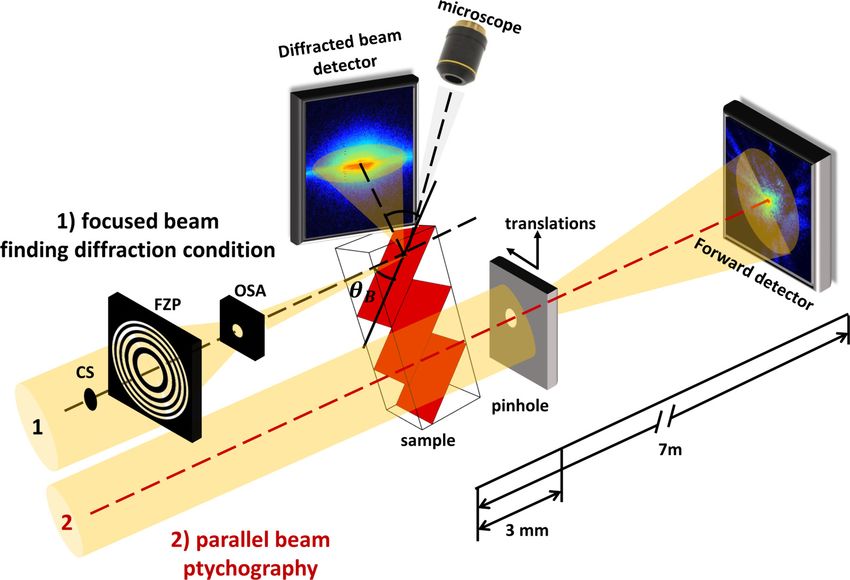
MARIANA VEREZHAK et al.                                                                             PHYSICAL REVIEW B 103, 144107 (2021)

    FIG. 3. Ptychographic topography of InSb micropillars in forward and diffraction directions. Schemes of ptychographic topography in the
(a) forward and (d) diffraction direction with sample orientation (sample not to scale). (b) Amplitude of the image reconstruction obtained in
the forward direction at the rocking angle of 0.03◦ . Red arrow shows strained region on the image. (c) Forward direction rocking curve around
the (2 0 2) diffraction peak measured with focused beam at the pedestal position. (e) Amplitude of the image reconstruction in the diffraction
direction at the rocking angle of 0.002◦ . (f) Rocking curve in the diffraction direction around the (2 0 2) diffraction peak measured with focused
beam at the pedestal position.

diffraction peak in a range of ±0.02◦ with an angular step of               only negligible strain [Fig. 3(c)]. The curve shows increased
0.002◦ . Ptychography scans were performed with a step size                 intensity at angles just below the diffraction condition and
of 0.5 μm and 0.2 s exposure time following a Fermat spiral                 exhibits an intensity drop at the diffraction angle. Such effect
pattern [25].                                                               shows that dynamical scattering effects take place in this re-
    Ptychographic reconstructions were performed using 300                  gion of the crystal. This is expected as the pedestal is 10 μm
iterations of the difference map algorithm [26] followed by                 thick and the extinction length of InSb at 6.2 keV and (2 0 2)
1000 iterations of a maximum likelihood refinement [27]                     diffraction reflection is 4.98 μm, as estimated from Ref. [32].
using the PtychoShelves package [28]. The resulting pty-                    Such an effect is well known as a dynamical diffraction effect
chographic reconstructions with a pixel size of 21 nm (in                   [33,34], and it highlights the good crystallinity at the pedestal
forward geometry) and 30 nm (in diffraction geometry) were                  far away from the strained micropillar.
backpropagated to the sample position and followed by post-                     Each projection of the ptychographic topography ex-
processing (phase offset and a linear phase wrap removal,                   periment in the forward direction was reconstructed using
vertical and horizontal spatial alignment) [29]. We estimated               single-probe mode [35] in order to reconstruct the pinhole, see
the resulting spatial resolution using Fourier ring correlation             Fig. S1(a). The fact of reconstructing a single probe mode is
[30] (see Fig. S2 in the Supplemental Material [19]).                       a sign that the reconstruction works well and that experimen-
                                                                            tal parameters such as coherence and mechanical vibrations
                                                                            are well behaved to perform ptychography. The amplitude
       IV. STRAIN AND DYNAMICAL DIFFRACTION
                                                                            [Fig. 3(b)] of the ptychographic reconstruction clearly shows
                   EFFECTS IN INSB
                                                                            the pillar and pedestal shapes. At the bottom of the pillar
   As mentioned above, the 2D ptychographic projections                     and at the pillar/pedestal interface, a dark feature is visible,
were taken at different angular positions in the vicinity of                indicated by the red arrow in Fig. 3(b). This feature is only
the InSb (2 0 2) diffraction peak. This reflection is in Laue               visible in the vicinity of the diffraction peak angle (as shown
diffraction geometry, in which the diffracted wave exits the                in Fig. 4 for rocking angles 0.01–0.04◦ ) and is not observed
crystal at the opposite surface to the incoming beam [31].                  far away from the diffraction peak (as shown in Fig. 4 for a
The rocking curve was acquired with a focused beam in the                   rocking angle of −3.5◦ ). All projections can also be accessed
forward direction at the pedestal position where we expect                  in the Media S1. This feature corresponds to crystallinity

                                                                    144107-4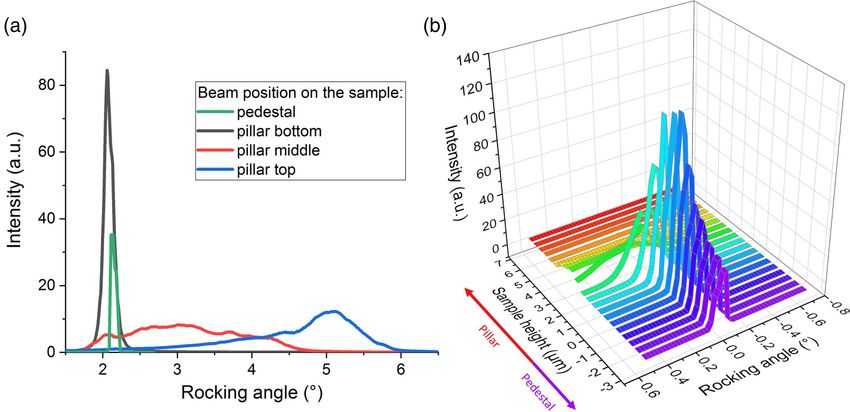
X-RAY PTYCHOGRAPHIC TOPOGRAPHY: A ROBUST …                                                   PHYSICAL REVIEW B 103, 144107 (2021)

                                                                        that the phase information is needed for the backpropagation
                                                                        of the exit wave field from the pinhole to the sample position.
                                                                            In the case of ptychographic topography in the diffraction
                                                                        direction, the reconstruction improved taking into account a
                                                                        second incoherent mode [35], with an intensity distribution
                                                                        for the first and second modes of 77% and 23%, respectively
                                                                        [see in Fig. S1(b) and Fig. S1(c)]. This is similar to what
                                                                        is observed with Bragg ptychography as the reconstructions
                                                                        are more difficult compared to conventional ptychography and
                                                                        sometimes require several incoherent modes. As the signal in
                                                                        the diffraction direction is often several orders of magnitude
                                                                        smaller than in the direct transmitted beam, there is less data
                                                                        available while the system might also have higher stability re-
                                                                        quirements, which affects the robustness of the reconstruction.
                                                                            The resulting reconstruction along the diffraction direction
                                                                        [Fig. 3(e)] contains no information at the top half of the
                                                                        images [black region in Fig. 3(e)]. This is partially due to
                                                                        the diffraction angle 2θB ∼ 52◦ at which those projections
                                                                        were recorded. At this angle, we see a projection of the whole
                                                                        pillar/pedestal assembly along the diffracted beam direction.
                                                                        In order to illustrate this effect, we calculated the projected
                                                                        thickness of the sample, including pillar and pedestal, along
                                                                        both the forward and diffraction direction in our measurement
                                                                        geometry (see Fig. S4 in the Supplemental Material [19]). The
                                                                        projected thickness of the sample, shown in Fig. S4(d), has a
                                                                        similar shape as observed in the image reconstructions along
                                                                        the diffraction direction and shows that the information of the
                                                                        whole pillar as well as the pedestal is encoded in the bottom
                                                                        half of the reconstructed image. Apart from this, no signal is
                                                                        expected to come from the top of the pillar as this region may
                                                                        have a very high density of defects and is out of diffraction
                                                                        condition, as will be discussed later.
                                                                            A very interesting feature can be seen in the ptychographic
                                                                        topography reconstructions obtained in diffraction geome-
                                                                        try [see Fig. 3(e)]: two sets of circular fringes of varying
                                                                        contrast. These features strongly change with the rocking
                                                                        angle and more interferences appear as we go further away
                                                                        from the diffraction angle, as shown in Fig. 4, right column.
    FIG. 4. Evolution of ptychographic topography of InSb mi-           The projections at all rocking angles obtained by ptycho-
cropillars in forward and diffraction geometry with the rocking angle   graphic topography in the diffraction direction can be seen in
around the (2 0 2) reflection. The rocking angle is shown in the        Media S2.
top left corner of individual images. Left column: amplitudes of the        The interpretation of these features is complicated as it can
image reconstruction obtained in the forward direction. The image at    involve the simultaneous presence of different effects. First
the rocking angle of −3.5◦ is acquired far away from the diffraction    of all, the thickness variation of single crystals can cause
condition and shows no strain features. Other images in the vicinity    so-called Pendellösung fringes in the presence of dynami-
of the diffraction condition show the strain feature. Right column:     cal scattering, i.e., if the crystal thickness is larger than the
amplitudes of the image reconstruction obtained in the diffraction      extinction length. This effect is widely observed in x-ray
direction, showing circular features and fringes of varying contrast.   topography caused by thickness variations [36]. We believe
                                                                        that the thickness-based Pendellösung effect does not cause
                                                                        the observed fringes at the diffraction direction [Fig. 3(e)] as
imperfection or strain field present in the crystal that makes          the projected thickness variation in the diffraction direction
this part of the crystal diffract at a slightly different angle. The    does not show similar patterns or significant sudden thickness
resolution of the reconstructed amplitude image was estimated           change at the base of the pillar. However, thickness-based
to be 29 nm.                                                            Pendellösung effect can very well explain the appearance and
   It is also important to note that in ptychographic topog-            the shape of the additional fringes in the region of the pedestal
raphy the amplitude provides higher contrast of crystalline             as we go further away from the diffraction peak, as shown in
imperfections compared to the phase reconstruction, as can              Fig. 4, right column.
be seen in Fig. S3 in the Supplemental Material [19]. This                  To confirm our hypothesis, we qualitatively simulated the
can be understood as a result of the diffraction-based contrast,        absorption signal from the projected thicknesses using pencil-
similar to the one in x-ray topography. Nevertheless, we note           beam symmetrical Laue dynamical theory based on Eq. (16)

                                                                  144107-5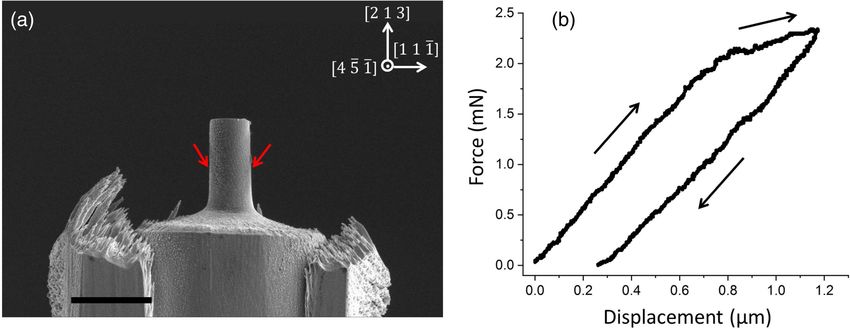
MARIANA VEREZHAK et al.                                                                          PHYSICAL REVIEW B 103, 144107 (2021)

    FIG. 5. Intensity of the (2 0 2) diffraction peak integrated over all pixels of the detector as a function of rocking angle, acquired with
focused beam: (a) comparison of integrated intensity on the diffraction peak at four characteristic positions (at the pedestal, bottom, middle,
and top of the pillar), (b) the (2 0 2) diffraction peak evolution along the pillar and pedestal height. Position of 0 height correspond to the
pillar/pedestal interface.

in Ref. [37]. At some rocking angles, we were able to ob-                 is produced in addition to the slip planes, as confirmed by the
serve similarities between these fringes that appear further              x-ray scanning diffraction microscopy below.
away from the diffraction condition with the simulated ones
(reported in the Supplemental Material, Fig. S5 [19]). More
                                                                           V. ADDITIONAL CHARACTERIZATION BY SCANNING
detailed simulation, taking into account the nonsymmetric
                                                                                        X-RAY MICROSCOPY
Laue dynamical theory as well as nonpencil beam is required
to further understand this phenomenon but is beyond the scope                 To confirm our observations, we performed an additional
of this paper.                                                            sample characterization. First, using the 100 nm focused beam
    A second possible effect, which could not be properly                 we performed angular rocking scans around the (2 0 2) diffrac-
taken into account in our simulations, is the possibility                 tion condition at different positions along the pillar (pedestal,
of additional destructive and constructive interferences that             pillar bottom, middle, and top), recording the intensity with
emerge due to the beam path differences caused by our large               the 2D detector along the diffraction direction, see Fig. 5(a).
nonfocused incident beam, so called Borrmann-Lehmann in-                  The rocking curves at the pedestal and bottom of the pillar are
terference patterns [38,39]. This effect, which is also caused            narrow, as expected for a crystal. But the curves for the middle
by dynamical scattering, could very well contribute to the                and the top of the pillar show not only that the sample is out of
observed fringes.                                                         the diffraction condition but also that the crystal may have too
    Finally, strain can also cause interference fringes. This             high density of defects to be reliably studied by monochro-
effect is extensively studied with x-ray topography using dif-            matic diffraction contrast methods. The linear scan along the
ferent single crystalline specimens with different strain states          pillar height in Fig. 5(b) also shows that the diffraction peak
[40–43]. We believe that the fringes we observe with pty-                 is the narrowest at the pedestal and is of sufficient quality at
chographic topography in the diffraction direction are mainly             the bottom of the pillar, while the curve becomes broader and
caused by the strain present in the crystal in combination with           significantly shifted as the beam impinges higher on the pillar.
the interference effects caused by the shape, thickness, and              Such a diffraction on the top of the pillar is another reason why
orientation of our sample. In addition, any interference fringes          we do not see the top of the pillar in Fig. 3(e).
caused by sample size and shape are extremely sensitive to                    Secondly, with the focused beam of 100 nm diameter,
strain. The fringes symmetry, shape, and number will change               scanning step size of 100 nm and 0.1 s acquisition time, we
in the presence of characteristic strain or lattice imperfections         performed scanning x-ray diffraction microscopy at a fixed
[39]. This makes ptychographic topography in the diffraction              angle of −0.05◦ close to the (2 0 2) diffraction condition.
direction extremely sensitive to small crystalline imperfec-              Our findings are summarized in Fig. 6. The scanning trans-
tions and strain fields.                                                  mission x-ray microscopy map in Fig. 6(a) shows no contrast
    The stress-displacement curve in Fig. 2(b) shows that there           to strain and the pillar appears brighter than the pedestal due
has been a 5% irreversible deformation in the total height of             to absorption. The scanning diffraction x-ray microscopy map
the pillar, which is a sign of considerable plastic deformation           in Fig. 6(b) reveals strained areas within the pillar and at the
in the pillar. This was confirmed by SEM images performed                 pillar/pedestal interface. We also built the dark field image by
after the compression experiment, like that shown in Fig. 2(a),           masking out only the peak from the perfect crystal (pedestal
which reveal the presence of slip traces, a typical signature of          position), see Fig. 6(c). By looking at individual diffraction
plastic deformation in this system [21]. Furthermore, a large             patterns at different positions of the pillar and pedestal in
amount of strain most probably in the form of lattice rotations           Figs. 6(c) and 6(e) we conclude that the diffraction peak

                                                                  144107-6
X-RAY PTYCHOGRAPHIC TOPOGRAPHY: A ROBUST … PHYSICAL REVIEW B 103, 144107 (2021)
FIG. 6. Scanning x-ray microscopy. (a) Intensity integrated over the central area around the beam of the forward detector. (b) Intensity
integrated over the entire area of the detector at the diffraction direction. (c) Dark field image obtained by masking out only the peak from
the perfect crystal (pedestal position 1) with characteristic diffraction patterns in (e). (d) Dark field image obtained by masking out the peak
from the perfect crystal and using the ROI shown in (e) as a red rectangle. This ROI corresponds to the mild deformation, without taking into
account very strong deformation in the form of peak splitting. Scale bar in (a)–(d): 1 μm. Scale bar in (e): 34.55 μm−1 .
begins broadening and changing shape at the top of the VI. DISCUSSION
pedestal and bottom of the pillar (patterns 2 and 3), followed
In the ptychographic topography demonstration described
by vertical streaking in the middle of the pillar (patterns 4 and
here, we observe deviations from perfect crystallinity due to
6). But at the top half of the pillar (pattern 5) the diffraction
strain and lattice rotations especially at the bottom part of the
peak streaks, splits, and moves out of the detector coverage
pillar, both along the forward and the diffraction directions.
(most of the peak intensity is no longer caught by the detec-
With a parallel incident beam, it is clear that a certain degree
tor). Such a diffraction at the top of the pillar is a characteristic
of crystallinity within the sample is needed in order to ob-
of a large deformation in this region and means that the sample
serve deviations from that crystallinity, and this is the case
has too high density of defects. Therefore, this method, as well
at the bottom part of the pillar. On the other hand, on the
as any other method that relies on monochromatic diffrac-
top part of the pillar the strain affects most of the bulk of
tion contrast, cannot provide the information to sufficiently
the sample, in such a way that only a small sample volume
describe strain in this region of the sample. Figure 6(d) shows
diffracts at a given angle. Hence, for heavily strained crystals,
another dark field image obtained by taking into account only
the diffraction signal is too weak to be reconstructed in the
the ROI that corresponds to a mild (i.e., measurable) deforma-
diffraction geometry, and the diffraction-based contrast is too
tion. From this image we can see that the bottom half of the
low in the forward geometry. Nevertheless, the advantage of
pillar already has strong deformation, but higher resolution is
having a parallel beam is that the technique can potentially
needed to visualize individual details.
have a very high sensitivity to strain in a crystalline specimen.
We summarize that scanning x-ray diffraction confirms our
As the contrast is the same as in x-ray topography, we expect
observations with ptychographic topography that significant
that the strain sensitivity could be as good as d/d = 10−7 ,
strain is present in the pillar and that the top half of the sample
where d is the lattice spacing of the crystal and d is a change
has too high density of defects. On the other hand, we would
in d over the initial length.
like to mention that ptychographic topography, while more
For illustration of reproducibility, the same ptychographic
experimentally demanding, has important benefits compared
topography measurement was conducted along the (2 0 2)
to scanning x-ray diffraction microscopy: resolution not being
diffraction direction on a similar pillar, sample S2, that had
limited to the lens and ability to simultaneously obtain phase
also been previously mechanically compressed, see Fig. S6.
information. In summary, our method provides a full descrip-
The reconstructed amplitudes along the diffraction direction
tion of the wavefront after the specimen, as phase information
show many similarities in the type, contrast, and spacing of the
available in addition to the amplitude is present and is used
fringes, although their exact arrangement is not identical and
to reconstruct the data and to propagate the object back to the
could be explained by different strain and/or lattice rotation
sample position. This offers much more freedom of analyzing
distribution inside the pillar. Sample S2 was also investigated
the data and correcting for potential artifacts. In addition, our
by ptychographic topography at the (2 2 0) Bragg condition
method will benefit much more from the increase in brilliance
along the forward direction (see Fig. S7), revealing at some
at fourth generation synchrotrons and potentially be signifi-
angles a crystalline imperfection feature [Fig. S7(b)] similar to
cantly faster than scanning microscopy measurements aiming
that observed in sample S1 at the (2 0 2) diffraction condition
for a similar resolution.
144107-7MARIANA VEREZHAK et al. PHYSICAL REVIEW B 103, 144107 (2021)
[Fig. 3(b)]. At a different angle, other interesting features were coherent flux could be improved by about a factor of 10 al-
also observed [Fig. S7(c)]. However, the exact determination ready now by using this technology. With upcoming upgrades
of the type of defects seen here will require further studies. of synchrotron storage rings, an additional significant increase
In this paper, we report a robust strain imaging technique, in the coherent flux will be possible. Most importantly, the
ptychographic topography, as well as its realization in both simultaneous phase and amplitude reconstruction provided by
the forward and diffraction direction. This approach allows our method opens a potential to retrieve quantitative strain
visualization of the exit wave after propagation of a beam field directly from the topography data.
through the crystal with high resolution (at least 29 nm as
achieved in the present work) and both amplitude and phase
ACKNOWLEDGMENTS
contrast. In the forward direction, we obtain a superposition
of the strained areas within the sample and the transmission We acknowledge the Paul Scherrer Institute, Villigen,
image of the specimen, which is useful to study strain in a Switzerland for provision of synchrotron radiation beam-
crystal in context with its surrounding material, regardless of time at the cSAXS beamline of the SLS. This work
its structural nature. In the diffraction direction, we observed was supported by the SNF Grant No. 200021L_169753,
fringes caused by dynamical scattering effects due to strain ANR-16-CE93-0006, by “Investissement d’Avenir” (LABEX
and geometrical features in the sample both in absorption and INTERACTIFS, ANR-11-LABX-0017-01) and by Nouvelle
phase contrast. The use of a parallel beam offers opportunities Aquitaine Region/European Structural and Investment Funds
for very high strain sensitivity when used on samples that (ERDF No P-2016-BAFE-94/95). M.V. was supported by
present a sufficient degree of crystallinity. Signal-to-noise in the European Union’s Horizon 2020 research and innovation
ptychographic topography could be improved for such highly program under the Marie Skłodowska-Curie Grant Agreement
strained samples with the use of a coherently illuminated No. 701647. K.W. acknowledges the support by the SNF
condenser designed to produce a flat illumination (i.e., pro- Grant No. 200021_166304. D.K. acknowledges funding from
viding a parallel beam) for x-ray transmission microscopes SNSF under Grant No. 200021_175905. Authors thank M.
[44]. With the currently available coherent flux in third gen- Guizar-Sicairos, P. O. Renault, T. Sadat, D. Le Bolloc’h, B.
eration synchrotron sources like the SLS, we estimate that Kedjar, and F. Mignerot for fruitful discussions.
[1] M. J. Hÿtch and A. M. Minor, Observing and measuring strain Boesecke, J. Katzer, I. Costina, H. Djazouli, T. Schroeder, and
in nanostructures and devices with transmission electron mi- T. U. Schülli, Imaging of strain and lattice orientation by quick
croscopy, MRS Bull. 39, 138 (2014). scanning X-ray microscopy combined with three-dimensional
[2] N. Hrauda, J. Zhang, E. Wintersberger, T. Etzelstorfer, B. reciprocal space mapping, J. Appl. Crystallogr. 47, 762
Mandl, J. Stangl, D. Carbone, V. Holy, V. Jovanovic, C. (2014).
Biasotto, L. Nanver, J. Moers, D. Grutzmacher, and G. Bauer, [10] V. L. R. Jacques, S. Ravy, D. Le Bolloc’h, E. Pinsolle, M.
X-ray nanodiffraction on a single sige quantum dot inside Sauvage-Simkin, and F. Livet, Bulk Dislocation Core Dissoci-
a functioning field-effect transistor, Nano Lett. 11, 2875 ation Probed by Coherent X Rays in Silicon, Phys. Rev. Lett.
(2011). 106, 065502 (2011).
[3] G. N. Ramachandran, X-Ray topographs of diamond, Proc. [11] J. Miao, T. Ishikawa, I. K. Robinson, and M. M. Murnane, Be-
Indian Acad. Sci. Sect. A 19, 280 (1944). yond crystallography: Diffractive imaging using coherent x-ray
[4] Y. Tsusaka, S. Takeda, H. Takano, K. Yokoyama, Y. Kagoshima, light sources, Science 348, 530 (2015).
and J. Matsui, X-ray topography using the forward transmit- [12] F. Pfeiffer, X-ray ptychography, Nat. Photonics 12, 9 (2018).
ted beam under multiple-beam diffraction conditions, Rev. Sci. [13] M. A. Pfeifer, G. J. Williams, I. A. Vartanyants, R. Harder,
Instrum. 87, 023701 (2016). and I. K. Robinson, Three-dimensional mapping of a defor-
[5] G. E. Ice and J. W. L. Pang, Tutorial on x-ray microLaue mation field inside a nanocrystal, Nature (London) 442, 63
diffraction, Mater. Charact. 60, 1191 (2009). (2006).
[6] R. Maaß, S. Van Petegem, D. Ma, J. Zimmermann, D. [14] J. M. Rodenburg, A. C. Hurst, A. G. Cullis, B. R. Dobson, F.
Grolimund, F. Roters, H. Van Swygenhoven, and D. Raabe, Pfeiffer, O. Bunk, C. David, K. Jefimovs, and I. Johnson, Hard-
Smaller is stronger: The effect of strain hardening, Acta Mater. X-Ray Lensless Imaging of Extended Objects, Phys. Rev. Lett.
57, 5996 (2009). 98, 034801 (2007).
[7] H. Simons, A. King, W. Ludwig, C. Detlefs, W. Pantleon, S. [15] P. Godard, G. Carbone, M. Allain, F. Mastropietro, G. Chen,
Schmidt, F. Stöhr, I. Snigireva, A. Snigirev, and H. F. Poulsen, L. Capello, A. Diaz, T. Metzger, J. Stangl, and V. Chamard,
Dark-field X-ray microscopy for multiscale structural charac- Three-dimensional high-resolution quantitative microscopy of
terization, Nat. Commun. 6, 6098 (2015). extended crystals, Nat. Commun. 2, 568 (2011).
[8] T. Etzelstorfer, M. J. Süess, G. L. Schiefler, V. L. R. Jacques, [16] S. O. Hruszkewycz, M. Allain, M. V. Holt, C. E. Murray,
D. Carbone, D. Chrastina, G. Isella, R. Spolenak, J. Stangl, H. J. R. Holt, P. H. Fuoss, and V. Chamard, High-resolution
Sigg, and A. Diaz, Scanning X-ray strain microscopy of inho- three-dimensional structural microscopy by single-angle Bragg
mogeneously strained Ge micro-bridges, J. Synchrotron Radiat. ptychography, Nat. Mater. 16, 244 (2017).
21, 111 (2014). [17] E. H. R. Tsai, A. Diaz, A. Menzel, and M. Guizar-Sicairos,
[9] G. A. Chahine, M.-I. Richard, R. A. Homs-Regojo, T. N. X-ray ptychography using a distant analyzer, Opt. Express 24,
Tran-Caliste, D. Carbone, V. L. R. Jacques, R. Grifone, P. 6441 (2016).
144107-8X-RAY PTYCHOGRAPHIC TOPOGRAPHY: A ROBUST … PHYSICAL REVIEW B 103, 144107 (2021)
[18] M. Verezhak, S. Van Petegem, V. Jacques, P. Godard, K. x-ray coherent diffractive imaging projections, Opt. Express 19,
Wakonig, L. Thilly, and A. Diaz, Visualization of crys- 21345 (2011).
tallographic defects in InSb micropillars by ptychographic [30] M. van Heel and M. Schatz, Fourier shell correlation threshold
topography, Microsc. Microanal. 24, 18 (2018). criteria, J. Struct. Biol. 151, 250 (2005).
[19] See Supplemental Material at http://link.aps.org/supplemental/ [31] A. Rodriguez-Fernandez, V. Esposito, D. F. Sanchez, K. D.
10.1103/PhysRevB.103.144107 for ptychographic reconstruc- Finkelstein, P. Juranic, U. Staub, D. Grolimund, S. Reiche, and
tions of the pinholes, resolution estimated using Fourier ring B. Pedrini, Spatial displacement of forward-diffracted X-ray
correlation, comparison of amplitude and phase of the im- beams by perfect crystals, Acta Crystallogr., Sect. A: Found.
age reconstruction in the forward direction, simulations of the Adv. 74, 75 (2018).
sample thickness along the beam path, pendellosung fringes [32] A. Authier, Dynamical Theory of X-Ray
simulations, sample s2, and medias of ptychographic topog- Diffraction (Oxford University Press, 2010),
raphy reconstructions of InSb micropillar in the forward and pp. 626–646.
diffraction direction at different angular positions of the rocking [33] W. H. Zachariasen, Theory of X-ray Diffraction in Crystals
curve. (Dover Publications, New York, 1968), p. 255.
[20] C. Kirchlechner, J. Keckes, J.-S. Micha, and G. Dehm, In situ [34] B. W. Batterman and H. Cole, Dynamical Diffraction of X Rays
microLaue: Instrumental setup for the deformation of micron by Perfect Crystals, Rev. Mod. Phys. 36, 681 (1964).
sized samples, Adv. Eng. Mater. 13, 837 (2011). [35] P. Thibault and A. Menzel, Reconstructing state mixtures
[21] L. Thilly, R. Ghisleni, C. Swistak, and J. Michler, In from diffraction measurements, Nature (London) 494, 68
situ deformation of micro-objects as a tool to uncover the (2013).
micro-mechanisms of the brittle-to-ductile transition in semi- [36] N. Kato and A. R. Lang, A study of pendellösung fringes in
conductors: the case of indium antimonide, Philos. Mag. 92, X-ray diffraction, Acta Crystallogr. 12, 787 (1959).
3315 (2012). [37] V. I. Punegov, S. I. Kolosov, and K. M. Pavlov, Bragg-
[22] V. L. R. Jacques, D. Carbone, R. Ghisleni, and L. Thilly, Laue X-ray dynamical diffraction on perfect and deformed
Counting Dislocations in Microcrystals by Coherent X-Ray lateral crystalline structures, J. Appl. Crystallogr. 49, 1190
Diffraction, Phys. Rev. Lett. 111, 065503 (2013). (2016).
[23] I. Johnson, A. Bergamaschi, H. Billich, S. Cartier, R. Dinapoli, [38] Z. Mai and H. Zhao, Absorption effect on Borrmann-Lehmann
D. Greiffenberg, M. Guizar-Sicairos, B. Henrich, J. Jungmann, interference phenomena, Acta Crystallogr., Sect. A: Found.
D. Mezza, A. Mozzanica, B. Schmitt, X. Shi, and G. Tinti, Crystallogr. 45, 602 (1989).
Eiger: a single-photon counting x-ray detector, J. Instrum. 9, [39] A. R. Lang, G. Kowalski, and A. P. W. Makepeace, Borrmann-
C05032 (2014). Lehmann interference patterns in perfect and in distorted
[24] B. Henrich, A. Bergamaschi, C. Broennimann, R. Dinapoli, E. crystals, Acta Crystallogr., Sect. A: Found. Crystallogr. 46, 215
Eikenberry, I. Johnson, M. Kobas, P. Kraft, A. Mozzanica, and (1990).
B. Schmitt, Pilatus: A single photon counting pixel detector for [40] U. Bonse, M. Hart, and G. H. Schwuttke, X-ray inves-
x-ray applications, Nucl. Instrum. Methods Phys. Res., Sect. A tigation of lattice deformations in silicon induced through
607, 247 (2009), Radiation Imaging Detectors 2008. high-energy ion implantation, Phys. Status Solidi B 33, 361
[25] X. Huang, H. Yan, R. Harder, Y. Hwu, I. K. Robinson, and Y. S. (1969).
Chu, Optimization of overlap uniformness for ptychography, [41] R. Negishi, T. Fukamachi, M. Yoshizawa, K. Hirano, and T.
Opt. Express 22, 12634 (2014). Kawamura, Observation of interference fringes due to lattice
[26] P. Thibault, M. Dierolf, O. Bunk, A. Menzel, and F. Pfeiffer, distortion by resonant scattering X-ray topography, Phys. Status
Probe retrieval in ptychographic coherent diffractive imaging, Solidi A 204, 2694 (2007).
Ultramicroscopy 109, 338 (2009). [42] F. N. Chukhovskii and P. V. Petrashen, X-ray topography of bent
[27] P. Thibault and M. Guizar-Sicairos, Maximum-likelihood re- crystals, Acta Crystallogr., Sect. A: Found. Crystallogr. 44, 8
finement for coherent diffractive imaging, New J. Phys. 14, (1988).
063004 (2012). [43] S. M. Novikov, I. M. Fonchuk, D. G. Fedortsov, and A. Y.
[28] K. Wakonig, H.-C. Stadler, M. Odstrčil, E. H. R. Tsai, A. Struk, Calculated images of dislocations in crystals on section
Diaz, M. Holler, I. Usov, J. Raabe, A. Menzel, and M. Guizar- topograms, Semicond. Phys., Quantum Electron. Optoelectron.
Sicairos, PtychoShelves, a versatile high-level framework for 13, 268 (2010).
high-performance analysis of ptychographic data, J. Appl. [44] K. Jefimovs, J. Vila-Comamala, M. Stampanoni, B. Kaulich,
Crystallogr. 53, 574 (2020). and C. David, Beam-shaping condenser lenses for full-field
[29] M. Guizar-Sicairos, A. Diaz, M. Holler, M. S. Lucas, A. transmission X-ray microscopy, J. Synchrotron Radiat. 15, 106
Menzel, R. A. Wepf, and O. Bunk, Phase tomography from (2008).
144107-9You can also read