Identifying Defects in Li-Ion Cells Using Ultrasound Acoustic Measurements - IOPscience
←
→
Page content transcription
If your browser does not render page correctly, please read the page content below
Journal of the Electrochemical
Society

OPEN ACCESS

Identifying Defects in Li-Ion Cells Using Ultrasound Acoustic
Measurements
To cite this article: James B. Robinson et al 2020 J. Electrochem. Soc. 167 120530

View the article online for updates and enhancements.

                               This content was downloaded from IP address 46.4.80.155 on 31/12/2020 at 19:37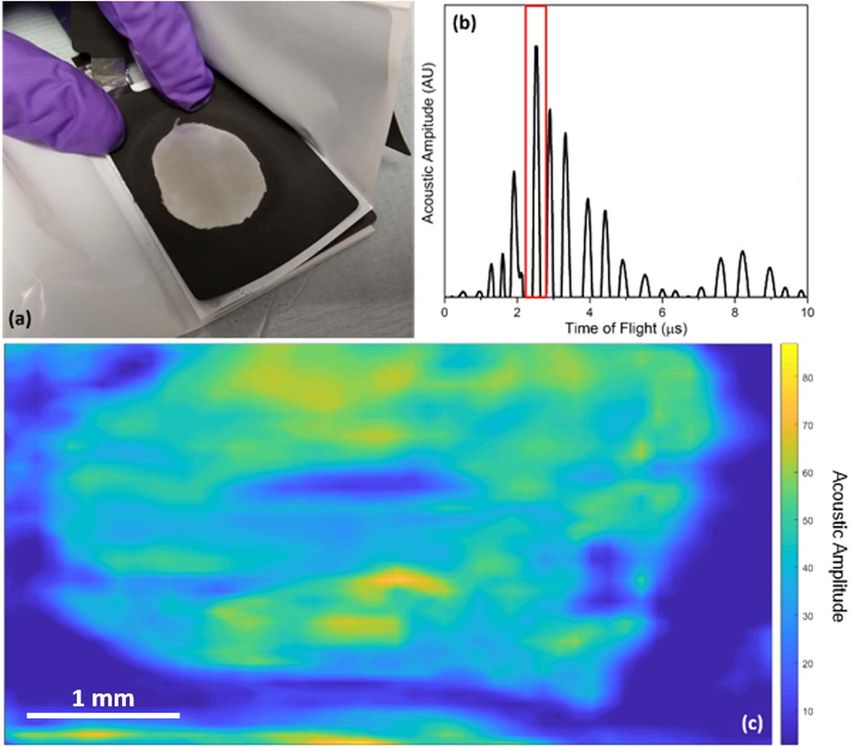
Journal of The Electrochemical Society, 2020 167 120530

                           Identifying Defects in Li-Ion Cells Using Ultrasound Acoustic
                           Measurements
                           James B. Robinson,1,2,z Rhodri E. Owen,1,2 Matt D. R. Kok,1,2 Maximilian Maier,1
                           Jude Majasan,1 Michele Braglia,3 Richard Stocker,3 Tazdin Amietszajew,4 Alexander
                           J. Roberts,4,* Rohit Bhagat,4 Duncan Billsson,5 Jarred Z. Olson,6 Juyeon Park,6,*
                           Gareth Hinds,6,* Annika Ahlberg Tidblad,7,8 Dan J. L. Brett,1,2 and Paul R. Shearing1,2
                           1
                             Electrochemical Innovation Lab, Department of Chemical Engineering, UCL, London, WC1E 7JE, United Kingdom
                           2
                             The Faraday Institution, Quad One, Harwell Science and Innovation Campus, Didcot, OX11 0RA, United Kingdom
                           3
                             HORIBA MIRA Ltd., Watling Street, Nuneaton, Warwickshire, CV10 0TU, United Kingdom
                           4
                             Institute for Future Transport and Cities, Coventry University, Coventry, CV1 5FB, United Kingdom
                           5
                             School of Engineering, University of Warwick, Coventry, CV4 7AL, United Kingdom
                           6
                             National Physical Laboratory, Teddington, Middlesex, TW11 0LW, United Kingdom
                           7
                             Volvo Car Corporation, SE-405 31, Gothenburg, Sweden
                           8
                             The Angstrom Advanced Battery Centre, Department of Chemistry, Uppsala University, SE-751 21 Uppsala, Sweden

              Identification of the state-of-health (SoH) of Li-ion cells is a vital tool to protect operating battery packs against accelerated
              degradation and failure. This is becoming increasingly important as the energy and power densities demanded by batteries and the
              economic costs of packs increase. Here, ultrasonic time-of-flight analysis is performed to demonstrate the technique as a tool for
              the identification of a range of defects and SoH in Li-ion cells. Analysis of large, purpose-built defects across multiple length scales
              is performed in pouch cells. The technique is then demonstrated to detect a microscale defect in a commercial cell, which is
              validated by examining the acoustic transmission signal through the cell. The location and scale of the defects are confirmed using
              X-ray computed tomography, which also provides information pertaining to the layered structure of the cells. The demonstration of
              this technique as a methodology for obtaining direct, non-destructive, depth-resolved measurements of the condition of electrode
              layers highlights the potential application of acoustic methods in real-time diagnostics for SoH monitoring and manufacturing
              processes.
              © 2020 The Author(s). Published on behalf of The Electrochemical Society by IOP Publishing Limited. This is an open access
              article distributed under the terms of the Creative Commons Attribution 4.0 License (CC BY, http://creativecommons.org/licenses/
              by/4.0/), which permits unrestricted reuse of the work in any medium, provided the original work is properly cited. [DOI: 10.1149/
              1945-7111/abb174]

              Manuscript submitted May 13, 2020; revised manuscript received August 4, 2020. Published August 31, 2020.
              Supplementary material for this article is available online

    The ubiquity of Li-ion batteries across a wide range of sectors                 at larger scales with reports of the cracking of the composite
has resulted in an increased focus on the safe construction and                     electrode structure being correlated to a drop in cell capacity.13,14
operation of electronic devices. While catastrophic failure events of               New, high-throughput, in-line techniques for battery quality assur-
Li-ion cells are high profile,1–4 they are also rare. Despite this,                  ance (QA) are required; however, at present, this monitoring is
accelerated degradation and failure of batteries can occur due to a                 typically performed using optical techniques, which may not be
range of manufacturing faults including the presence of foreign                     sufficiently sensitive to identify sub-surface defects.15 While not yet
bodies, misaligned electrodes and poor construction of cells.5 One of               capable of achieving the required rates for battery QA, the
the most noted cases of Li-ion battery failure was that of the                      development of X-ray computed tomography (X-ray CT) techniques
Samsung Galaxy Note7 mobile phone battery which resulted in at                      has occurred at a remarkable pace; for example Kok et al.16 have
least 96 reports of battery failure within two months of release.6,7                demonstrated the potential for the evaluation of a full battery in 80 s.
The high-profile nature of these battery failures points to the need for                 In addition to the value of in-line monitoring of manufacturing
a robust and efficient screening process that can be used both on a                  processes to cell producers, field-deployable techniques enable the
manufacturing line and as a field-deployable technique. Such a tool                  routine evaluation of cell SoH. These tools must be comparatively
should also enable an improved understanding of battery                             compact, low cost and offer fast and reliable results. One such
degradation8 by providing active monitoring of the physical condi-                  technology, which has particular promise in this area, is ultrasonic
tion or state-of-health (SoH) across the cells full lifecycle. While full           acoustic analysis. The ultrasonic time-of-flight (ToF) technique
recycling of batteries remains challenging, there is increasing                     utilises material interfaces to partially reflect signals transmitted
interest in the repurposing and reuse of Li-ion batteries in second-                from a point source. Material properties including density, porosity
life applications. When the capacity and power capability drops so                  and strain affect the propagation of waves through layers, which, in a
that the battery is no longer fit for purpose in first-life applications              battery, can provide access to a number of relevant parameters,
(often reported as a 20% drop in initial capacity), there remains                   including the state-of-charge (SoC), electrode condition and poten-
substantial economic value both in the materials, which comprise the                tially the presence of internal defects. The ability to detect small-
battery, and in the remaining capacity.                                             scale defects has further potential to supplement current techniques
    The degradation of battery performance has been shown to                        applied to SoH monitoring.17 While the SoH of batteries remains an
correlate with physical changes in the constituent material and                     ill-defined area, routes to access a SoH metric include the analysis of
internal architecture of the cell. At the electrode particle level,                 the rate of change of capacity18 or the internal resistance.19
cracking, and the consequently enhanced particle porosity, and                      However, this can be complicated by the SoC and temperature of
dislocation from electronic pathways, has been shown to accelerate                  cells, the change of open circuit voltage (OCV) during a cells life
ageing in both electrodes.9–12 This behaviour has also been observed                and external electrical noise. At present, the degradation of batteries
                                                                                    is typically determined through predictive modelling due to the
                                                                                    substantial difficulty in monitoring the complex nature of battery
                                                                                    degradation, particularly with the SoH being a highly application
  *Electrochemical Society Member.
  z
    E-mail: j.b.robinson@ucl.ac.uk
                                                                                    dependent characteristic. Statistical and model-based methods are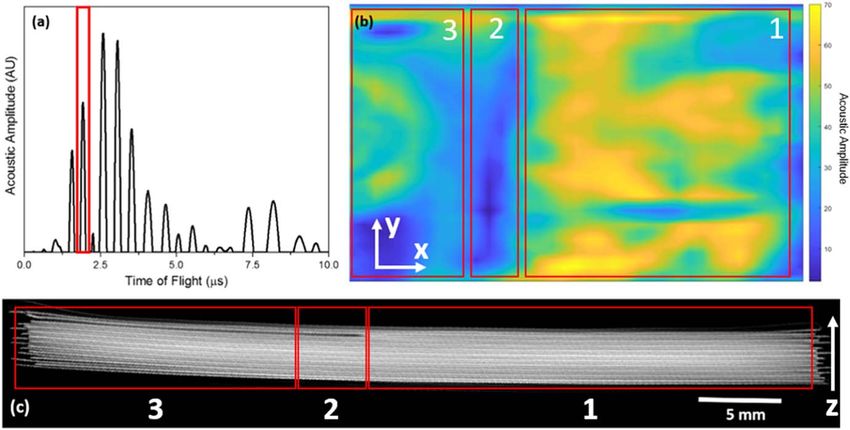
Journal of The Electrochemical Society, 2020 167 120530

commonly employed to mitigate these effects20–23 with predicted           were performed at their initial OCV of 3.6 V with subsequent
performance compared to measured parameters. However, this                imaging performed at similar conditions.
increases the computational expense of battery management systems             Ultrasonic ToF measurements of the lab-built Li-ion pouch cell
(BMSs) and the methods are limited by the accuracy of the predicted       analogue were conducted using an Olympus Focus PX phased array
behaviour. In contrast to computational approaches, a physical            instrument (Olympus Corp., Japan). A 10 MHz 1D linear phased
measurement, such as ultrasonic time-of-flight analysis, to determine      array probe consisting of 64 transducers and an active aperture of
the SoH of Li-ion batteries has the potential to feed into BMSs and       64 mm with an element pitch (centre-to-centre distance between
provide degradation and failure information, including forewarning        elements) of 1 mm. The probe was fitted with a 0° Rexolite wedge to
of catastrophic events, in real-time without the need for complex         protect the surface of the transducer. For cell mapping measure-
calculations.                                                             ments, the active aperture of the probe was reduced to match the
    Reports of ultrasonic analysis of batteries have increased in         width of the cell. Movement along the length of the cell was
number and complexity since initial studies performed by Ohzuku et        measured using an Olympus GLIDER 2-axis encoded scanner with
al.24 who identified particle cracking during cycling using passive        the step size set at 1 mm to give a resolution of ca. 1 mm2. Elements
acoustic spectroscopy in a Li/MnO2 cell. This technique was also          were pulsed in groups of 16. Analysis of the measured signals was
applied by Villevieille et al.25 who used passive acoustic emission       performed using the OmniPC software with visualisation undertaken
spectroscopy to monitor morphological changes in a Li/NiSB2 cell          in Matlab. Further pulse-echo ToF measurements were performed on
and identify the growth of the solid electrolyte interphase (SEI)         commercial 400 mAh LiCoO2/graphite cells using a Panametrics
during the first cycle and Rhodes et al. who investigated Si               5052PR pulse-receiver to excite the ultrasound transducer. The
electrodes in cells.26 Sood et al. advanced this work reporting for       response signal was recorded using the same Panametrics pulse-
the first time a drop in through-cell acoustic transmission with           receiver unit which was in turn connected to a Tektronix TBS 1052-
cycling associated with cell swelling/gas formation.27 This work          EBU digital oscilloscope. The measurements were taken at a rate of
demonstrated the feasibility of using pulse-echo techniques in Li-ion     1 Hz with 64 signals averaged to give the final waveform and
cells; however, the cell used showed severe degradation at a              minimise the impact of external noise effects. The measurements
comparatively low cycle rate, with effective failure of the cell          were obtained with a 1 MHz (Panametrics) transducer with a
occurring after approximately 75 cycles. Hsieh et al. presented a         12.7 mm diameter at an appropriate drive level to ensure the
significant development on this work with operando monitoring of a         response signal was not of sufficient amplitude to saturate the
cell throughout multiple cycles using transmission ultrasonic ToF         receiver. Ultrasonic transmission measurements were obtained by
techniques.28 This work identified changes in both the reflected and        using a second receiving probe (5 MHz, Olympus Corp., Japan) with
transmitted acoustic profiles associated with the lithiation/delithia-     a diameter of 6.35 mm placed on the opposite side of the cell and
tion process in the electrodes at low cycling rates. Building on this,    connected to the oscilloscope. A uniform pressure between the
model development was undertaken by Davies et al.,29 who                  transducer(s) and cell was maintained by placing a 200 g weight on
identified key parameters which govern the acoustic signal, in-            one transducer prior to all measurements with the receiver transducer
cluding the bulk and shear moduli, and Poisson ratio. Previous work       placed below this when transmission measurements were obtained.
by the authors has highlighted the need for spatially resolved            The waveforms were exported from the oscilloscope as a .csv file
acoustic measurements and also examined the effect of high-rate           prior to analysis in Matlab. To facilitate acoustic measurements an
operation, identifying a method for quantifying the “electrochemical      ultrasonic couplant (D12 Couplant, Olympus Corp., Japan) was
stiffness” induced in materials under these conditions.30,31 While the    placed between the cells and transducers prior to all measurements.
majority of published work has investigated the use of ultrasound             The internal characteristics of the lab-built cells were identified
techniques to monitor reversible, expected changes arising in cells       via X-ray CT, conducted using a Nikon XT-225 instrument (Nikon
due to cell cycling, a recent report by Bommier et al. demonstrated       Metrology, Tring, UK). These scans were obtained at an accelerating
the use of the technique to identify Li plating in small pouch cells.32   voltage of 180 kV and an incident beam power of 18.5 W, using a W
    This work presents the validation of spatially resolved acoustic      target and a 1 mm Cu filter. To minimise artefacts in the image, 3176
ToF measurements in identifying cm-mm scale faults within custom-         projections were obtained for each scan with the geometric
built cells. The use of the technique is further demonstrated on a        magnification of the system resulting in a pixel size of approximately
commercial cell to detect a microscale-manufacturing defect, the          24.5 μm. Reconstruction of the radiographic images was performed
presence of which is corroborated via X-ray CT.                           using “Nikon CT Agent” software, which enabled the visualisation
                                                                          of the electrode layers, and current collection tabs within the cell.
                           Experimental                                   The commercial cells were imaged using a Zeiss Xradia Versa 520
                                                                          (Carl Zeiss XRM, Pleasanton, CA, USA) with an accelerating
    Bespoke cells were constructed with individual layers of elec-
                                                                          voltage of 80 kV and a total power of 10 W. A total of 1601
trode removed to generate defects in the electrode stack. The cells
                                                                          projections were collected with a magnification of 0.4× used to
were constructed using 11 graphite negative electrode layers and ten
                                                                          obtain a resolution of 7.7 μm. Reconstruction of the acquired images
LiNi0.6Mn0.2Co0.2O2 (NMC, Targray, Quebec, Canada) based posi-
                                                                          was conducted using proprietary software (‘Reconstructor Scout-
tive electrode layers stacked and sealed in a laminated Al pouch. To
                                                                          and-Scan, Zeiss, Carl Zeiss, CA, USA) with visualisation of all
reduce the risk of Li plating and localised cell shorting, 9.5 g of
                                                                          reconstructed datasets being performed using Avizo Fire 9.4 (FEI,
dimethyl carbonate (DMC, anhydrous, >99%, Sigma Aldrich,
                                                                          France).
Missouri, USA) was used as an analogue for the electrolyte to
mimic the acoustic properties of commercial electrolytes without the
                                                                                                Results and Discussion
presence of Li+ salts. During the construction process, deliberate
defects were introduced to the cell with the third negative electrode        In order to leverage acoustic techniques in a QA or quality
cut in half and one half removed from the stack in one cell. A second     control (QC) process it must be demonstrated that ToF-based
defect was introduced in a second cell by dissolving the active           techniques can establish a significant and reproducible signal
cathode material away from the surface of the current collector using     variation between pristine regions and those that contain defects.
the solvent N-methyl-2-pyrrolidone (NMP, anhydrous, 99.5%,                The interpretation of acoustic ToF signals in Li-ion batteries is
Sigma Aldrich). Commercial Li-ion cells composed of a LiCoO2              governed by a number of factors including the condition and
(LCO) positive electrode with a graphite negative electrode were          mechanical properties of the constituent materials and the internal
also examined (PL-402248-2C, AA Portable Power Corp.,                     architecture of the cell. In a cell under electrochemical load this
Richmond, CA, USA). Acoustic and X-ray imaging of these cells             becomes increasingly challenging due to SoC-dependent variations
                                                                          in electrode properties which affect the speed of sound (c) in a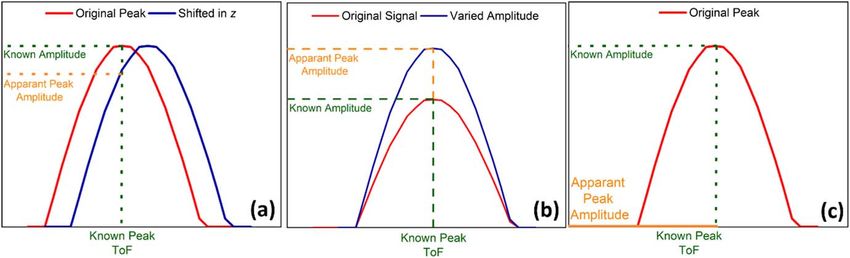
Journal of The Electrochemical Society, 2020 167 120530

material; most noticeably the Young’s modulus (E), density (ρ) and            Fig. 1b, is unlikely to be measured in a healthy cell at OCV, as this
Poisson ratio (υ)29 as seen in Eq. 1, where K and G are the bulk and          change would require a change in the physical properties of the
shear moduli respectively (Eqs. 2 and 3).                                     materials at the interface. A shift in the amplitude for a cell at rest is
                                                                              indicative of a defect in a region located at a prior ToF and is due to
                                           4
                                   K + 3G                                     the reduced transmission of acoustic waves through the cell. Finally,
                         c =                                          [1]     the absence of a peak (Fig. 1c) would most likely be due to a severe
                                       r                                      defect in a cell, such as the removal of an electrode layer. The loss of
                                                                              a peak and subsequent features in a waveform is indicative of the
                                     E                                        presence of a non-acoustically conductive layer, provides a facile
                         K =                                          [2]     method for determining the presence of degradation indicators such
                                3 (1 - 2n)
                                                                              as accumulated gas pockets and delamination in cells.
                                                                                  To validate the use of this technique against known defects, the
                                       E
                         G =                                          [3]     phased array probe was rastered across a cell to provide a scan of the
                                   2 (1 + n )                                 cell in three dimensions, namely, x, y and ToF, corresponding to a
                                                                              thickness, as shown in Fig. 2.
    These considerations are not required when analysing a cell                   Following the full three-dimensional acoustic scan, individual
which has been allowed to rest at open circuit, removing any                  peaks were examined to understand the spatially variant changes in
variation in the SoC and consequently the condition of the                    the waveforms obtained. A consistent delay was applied to the
constituent layers and any potential electrochemical stiffness derived        signals to remove the peaks associated with the ringing of the
from cycling.31 Under these circumstances, any change in the ToF              transducers, which were also shifted in ToF due to the presence of
will be entirely governed by the physical distance between the                the delay block. The total delay applied was consistent across all
interface causing reflections and the transducer. However, in Li-ion           measurements. To ensure a minor peak shift had not caused any
batteries, the layered structure provides a number of component (i)           variation, the maximum amplitude over a 0.4 μs range was plotted.
velocities in each composite material, which must be considered to            Slight variations in the signal amplitude were observed across all
facilitate appropriate analysis and obtain direct measurements of             peaks due to the packaging of the pouch cell, which allowed slight
depth (z).                                                                    movement of both the electrode layers and electrolyte. However,
                             i=n                                              when interrogated, a single peak located at ca. 2.0 μs was observed
                    ToF =    å ci (r , t ¼) · z i                     [4]     to show an approximately constant amplitude (Region 1) before a
                             i=1                                              sharp deviation from this expected amplitude; seen in Region 2
                                                                              where the peak amplitude approaches zero. The large change in the
    While in principle this is a relatively facile calculation, the           gradient of the amplitude is indicative of either a large shift in the
impact of a large number of factors (which may be spatially variant),         peak location or the absence of a peak in this location as described in
including, particle size, density, local electrode composition and            Figs. 1b, 1c. The peak at 2.0 μs is observed to be the third significant
tortuosity, provide significant challenges to directly measure thick-          peak in the acoustic signal, suggesting the defect observed occurs in
nesses in real cells. The amplitude of the reflected peaks at an               the third layer of the cell, in this instance, corresponding to the
interface is governed by the reflection coefficient (R) which indicates         removed anode layer in the deliberately constructed cells. This is
the extent to which an incident acoustic wave is reflected. This               further corroborated via the reconstructed tomography image shown
coefficient depends on the relative acoustic impedance (Z) of the two          in Fig. 2c. While there is a region of reduced ToF peak amplitude
materials at the interface, and is calculated as shown in Eq. 6.              after the large gradient (Region 2 in Fig. 2b), variations in the
                             Z = rc                                   [5]     measured values can be seen to increase from zero as the raster
                                                                              moves towards the other end of the cell (Region 3). The signal in
                                                                              Region 3 is complicated by the increasing degree of curvature of the
                            ⎛ Z - Z 1 ⎞2                                      cell due to the pressure from the transducer. It can also be seen in the
                        R = ⎜ 2        ⎟                              [6]
                            ⎝ Z1 + Z 2 ⎠                                      X-ray image (Fig. 2c), that the cell allows movement of the entire
                                                                              electrode region, which contributes to slight variations in the
   Despite the complications outlined above, acoustic techniques              location of peaks. This effect is most likely to occur in Region 2
can provide highly resolved results that can be used to detect                where the weight of the transducer is not uniform across the surface
changes in well-characterised systems. Employing this approach,               of the cell due to the removal of the anode layer (seen in Fig. 2c) in a
acoustic ToF signals can be subtracted from known standards and               similar manner to an anchoring effect previously reported.21,22 This
variations in rectified peak locations can be observed in a two-               boundary region will result in a sudden reduced constriction on the
dimensional map. These changes in peak behaviour may arise due to             anode layer, which will tend to bend towards the free space due to
a range of physical factors in a cell, some of which are outlined in          the pressure of the transducer and the edge of the electrode layer.
Fig. 1.                                                                       Measurement in regions where this variation in pressure occurs (i.e.
   The first and most likely cause of a variation in total amplitude           Region 2) is facilitated by the couplant, which is in sufficient
over a given ToF range in a Li-ion cell at OCV will be due to a               quantity to ensure no air gaps are present between the transducer and
physical shift in the interface location as outlined in Fig. 1a. A shift      the cell.
in the interface towards or away from the transducer caused by                    In examining the regions above, it is evident that there is intimate
electrode layer expansion or contraction will change the measured             contact between the layers and electrolyte due to the presence of
amplitude of the peak at a given ToF value with the apparent                  subsequent peaks, which can only be measured in the presence of an
amplitude of the peak decreasing directly as a result. This shift in          acoustically conductive medium. In this instance, propagation is
ToF as a result of cycling has been reported in a number of                   achieved through the liquid DMC electrolyte, which is in excess
works28,31 and can be accounted for in a monitoring system by                 when compared to industrially formulated pouch or prismatic cells.
ensuring a range of ToF values are included in any peak analysis              Deeper examination of individual waveforms from the aforemen-
with only the maximum amplitude being assessed. The extent of the             tioned regions provides further evidence that there is a relative
range will be determined by the resolution of the measurement;                change in position of the electrode layers in the cell as seen in Fig. 3.
however, it should be sufficient to accommodate slight structural or               The variation in signal between Region 1 and 2 is evident across
surface variations, which may manifest over nanosecond timescales.            all ToFs in Fig. 3a, with better agreement evident only in the first
An actual change in the peak amplitude at a given ToF, shown in               echo peaks, i.e. those occurring from ca. 6.9 μs onwards. These echo
                                                                              peaks are associated with the waveform passing through the entire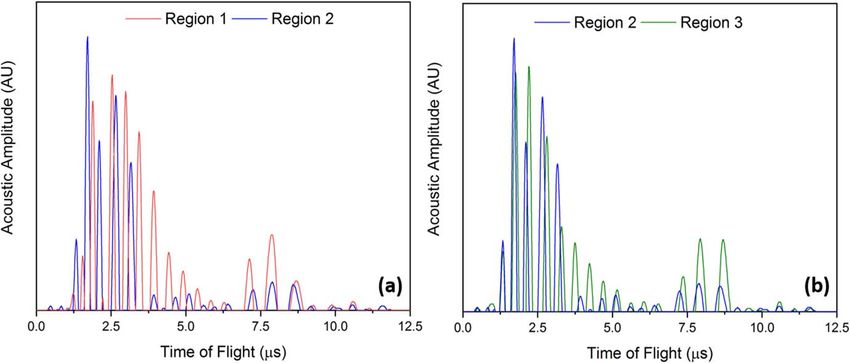
Journal of The Electrochemical Society, 2020 167 120530

Figure 1. A number of potential peak variations in acoustic ToF analysis of Li-ion batteries including (a) a change in measured amplitude due to the interface
physically moving in z, (b) a measured increase in the amplitude due to a change in the ratio of acoustic impedances at a given interface and (c) the complete
absence of the interface being measured.

Figure 2. Diagnostic analysis of a Li-ion pouch cell with a large anode defect (in this instance one electrode layer removed in one half of the cell) showing (a) a
sample acoustic signal from the area without the defect highlighting the third layer within the cell as the peak of interest; (b) a 2D raster of acoustic scans
corresponding to the amplitude variations of the peak at ca. 2.0 μs (with a 0.4 μs range applied to account for small ToF shifts) and (c) a reconstructed X-ray CT
of the cell confirming the defective region in the cell. Regions are indicated 1, 2 and 3 to aid later discussion.

cell and reflecting off the back of the cell and therefore, when                     Region 2. The variations in the individual signals shown in Fig. 3
analysing potential movement in the electrode layers in a cell, should              highlight a challenge in applying single measurements to detect
be considered in a different manner. In contrast, there is similarity               defects which occur over large areas of the cell (i.e. larger than the
between the peaks in Region 2 and 3 until ca. 2.0 μs. Following this                transducer). The variations also point to the importance of not only
peak, minor variations in the waveforms are evident in each region,                 applying a uniform weight, but also a consistent force when using
suggesting a movement of the component layers before similarity is                  single-point measurements as the relative changes in a waveform
once again observed from ca. 4.8 μs until the echo peaks are                        will not be observed across the cell.
measured at 6.9 μs. The variations in the region 2.0–4.8 μs begin                       Having validated the technique against large defects (i.e. the
with the third major peak and suggest that the bending effect noted                 absence of an entire electrode layer), the potential use of acoustic
previously propagates through several layers before the layers are                  spectroscopy as a tool to detect in-electrode defects was examined.
sufficiently constrained due to the pressure applied by the weight of                Delamination of electrode layers is highly detrimental to cell
the transducer and the neighbouring electrode layers. It can also be                performance and a predictor of the onset of cell failure.13,14,16 As
seen that the signal obtained in Region 3 has a more periodic                       a proxy for electrode delamination a region of cathode located in the
structure, in contrast to the irregular peak locations in Region 2. This            fourth layer of a cell similar to that discussed previously was
suggests that in Region 2 the pressure of the transducer is acting                  removed prior to sealing, with the results shown in Fig. 4.
across a sufficiently large area to press the remaining electrode                        Once more, it can be seen that spatially resolved pulse-echo
layers together and is not influenced by the “ledge effect” seen in                  imaging can be used to identify defective regions in the electrode.
Journal of The Electrochemical Society, 2020 167 120530

Figure 3. Example waveforms highlighting the relative change in displacement between the transducer and electrode layers caused by the ledge effect, showing
a large variation throughout the waveforms between Region 1 and 2 and a similarity in waveforms until ca. 2 μs between Region 2 and 3.

Figure 4. Diagnostic approach to identifying defects in cathode deposition (a) shown in a photograph prior to cell sealing (b) a single acoustic scan highlighting
the ToF peak of interest at 2.5 μs and (c) a 2D raster showing a region corresponding to that highlighted in the photograph demonstrating the efficacy of the
technique.
Journal of The Electrochemical Society, 2020 167 120530
Figure 4 shows the amplitude of the peak that can be ascribed to the radial region (highlighted in blue boxes in Figs. 5d, 5e) in the
interface of the electrolyte and bare current collector; the apparently electrode plane with a small increased distance (>5 μm) observed
reduced amplitude in the surrounding regions is therefore explained between the second anode and cathode layers. It is suggested that
by the scenario shown in Fig. 1a. The image in Fig. 4c was obtained this increased distance introduced an acoustically resistive void,
similarly to that shown in Fig. 2b with a candidate peak identified at which affected the propagation pathway for the acoustic signal
ca. 2.5 μs analysed across the lateral extent of the defective battery. resulting in a large acoustic impedance and consequently a high
A region corresponding to the defect shown in Fig. 4a can clearly be degree of signal attenuation. In this instance, the peaks located after
seen, with this area also correlating a variation in amplitude of the the signs of degradation may correspond to echo reflections, which
fourth significant peak and therefore the defect located in the fourth manifest between the transducer and the defective layer due to the
layer. Variations in the amplitude can be observed across the defect, large reflection coefficient (described in Eq. 6) at the electrode/void
with this ascribed to pressure variations as the transducer is rastered interface. These peaks may also arise due to reflections that occur
across the surface of the battery. The demonstration of this technique beyond the defect with a significantly attenuated signal.
to detect defects at resolutions below the electrode thickness To confirm this hypothesis the transmission of acoustic waves
indicates significant promise for the deployment of acoustic techni- through the pristine and defective cells was investigated using two
ques as a tool for both in-line QA of coating processes, by imaging transducers as explained previously, with the results shown in Fig. 6.
the underside of coated electrodes, and as a final QC metric for cell It is evident that the presence of the internal defect significantly
assembly. Indeed, given the ongoing improvement in X-ray imaging retards the transmission of an acoustic wave through the battery. The
times, ultrasonic measurements could be used as a preliminary high amplitude transmission peak, which begins at ca. 2.5 μs in the
screening technique as part of a wider triage process to mitigate pristine cell, is not present in the defective cell, with subsequent
against cell defects, preventing catastrophic failures and associated peaks also not observed. It can also be seen that the signal recorded
economic costs for cell manufacturers. contains significantly fewer component peaks. The substantially
While the validation of defects on a millimetre scale has an reduced transmission of the acoustic signal provides further evidence
impact for the in-line deployment of ultrasonic ToF techniques, the as to the presence of an acoustically insulating layer suggesting the
identification of foreign artefacts, localised defects or delamination defect observed in Figs. 5d, 5e resulted in a separation of the
at a micrometre scale would allow the technique to be deployed to a component layers, through either physical means or the formation of
wider range of users. Commercial cells are more finely optimised for a layer of gas.
performance, and, as a result are typically more rigid and contain The use of pulse-echo techniques has been shown to provide
less electrolyte than lab-built pouch cells. The scale of defects which depth-resolution, offering the opportunity to pinpoint the location of
are most likely to arise in commercial cells would be expected to be defects in cells. However, the technique must be tailored for the
smaller than the diameter of a transducer; and therefore, unlikely to appropriate thickness range to ensure the received signal is suffi-
result in measureable variations in electrode location. As such, a ciently large to be recorded while also not exceeding the maximum
single transducer placed in the correct location is likely to be amplitude recordable by the transducer. This limitation could be
sufficient to capture the effect of defects. However, it should be overcome by recording the response to sequential pulses of varying
highlighted that architectural features and large defects may extend amplitude to probe a range of depths. The use of acoustic
beyond the scope of a single transducer, and, defects may occur at transmission techniques to identify defects has been shown to have
any position in the cell emphasising the need for spatially resolved the advantage of a more facile analysis; however, the technique does
examinations.30 To investigate the application of this technique to a not provide information relating to the internal structure of the cell.
commercial cell, two 400 mAh batteries, one pristine and one with a It is also likely that transmission measurements would provide a
defect, were examined, with the results shown in Fig. 5. simpler correlative tool for the identification of voids caused by
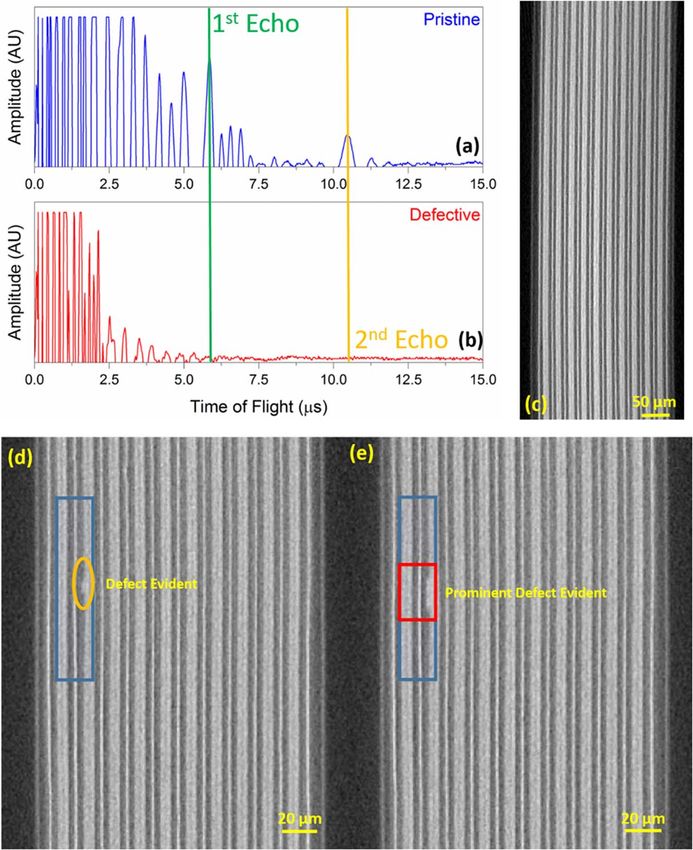
The ultrasonic waveform associated with the pristine cell in either gas or defect formation in cells with no need for a priori
Fig. 5a is indicative of the regular layered structure expected in a Li- knowledge of cell componentry or condition. The optimised nature
ion pouch cell, as seen in Fig. 5c. The signals obtained in the pristine of commercial cells, with a minimal electrolyte volume will also aid
commercial cell can be seen to be more homogenous then those the use of this technique when compared to lab-built cells.
obtained in the lab-built cell highlighting the potential use of this
technique as a QA/QC diagnostic. As previously highlighted, Conclusions
deviations from this structure have been associated with capacity
Acoustic pulse-echo spectroscopy was performed on lab-built
fade and cell failure13,14,16 making such deviations a candidate
cells with in-built defects and on pristine and defective commercially
metric to interrogate the SoH of batteries. The waveform acquired
available cells, with acoustic transmission used to corroborate the
from the defective cell (Fig. 5b) shows significant variations from
presence of such defects. These measurements were further validated
the pristine waveforms at ToF above ca. 1.25 μs suggesting the
using X-ray computed tomography to highlight the potential of
defect is located in the region of this ToF. It should be noted that in
acoustic measurements as a quality assurance and quality control
contrast to the previous results no delay block was used in this
tool in manufacturing, operational and end-of-life scenarios. The
instance so the initial signal contains peaks associated with the
presence of defects were clearly identifiable in the characteristic
ringing of the transducer. The absolute amplitude and periodicity of
ultrasonic waveforms with the importance of spatial resolution
the signal is observed to decrease substantially throughout the
highlighted in the lab-built cells, where the defects were sufficiently
primary signal in Fig. 5b alongside the disappearance of the first
large to result in widespread variability in the cell condition. The
and second echo peaks located at ca. 6 and 11 μs, respectively. The
microscale defect observed in the commercial cell was sufficiently
absence of these echo peaks suggests that the waveform is not able
characterised using a single transducer providing a pathway for
to propagate through the cell to the rear casing and back to the
direct SoH monitoring in Li-ion cells.
transducer due to some form of defect. While no macroscale gassing
The techniques described in this work benefit from the relatively
of the cell was observed prior to measurement the presence of gas in
compact, low-cost nature of the componentry, in addition to rapid
the region adjacent to the defect cannot be ruled out and may explain
data acquisition, which offer the potential to form part of an in-line
the substantial drop in signal propagation beyond the defect. Having
QA triage system to identify potentially problematic cells in real-
obtained this waveform, the cell was examined using high-resolution
time prior to deeper analysis using complimentary methodologies.
X-ray CT to understand the cause of the signal attenuation. Once
Acoustic spectroscopy may further substantially enhance SoH
reconstructed, a single defect was identified in the second cathode
monitoring of batteries, with the time-series information currently
layer, as highlighted in Fig. 5. The nature of this defect could not be
being readily analysed by on-board BMSs in a wide array of Li-ion
fully determined; however, it was observed to be ca. 20 μm in
battery packs. Furthermore the application of frequency domain
diameter. Secondary effects of this defect were noticed in a 200 μmJournal of The Electrochemical Society, 2020 167 120530
Figure 5. Identifying microscale defects in commercial pouch cells using ultrasound pulse-echo techniques. The spectra associated with pristine (a) and
defective (b) cells are shown, with a reconstructed X-ray tomography slice of the pristine cell shown in (c). Following the identification of a suspected defect
using ultrasound techniques the cell was examined using X-ray tomography with the presence of a single defect in the cell confirmed, as shown in (d), (e).
analysis may facilitate layer-wise reconstructions which could be a Acknowledgments
powerful addition to battery monitoring systems in certain applica-
The authors would like to acknowledge the EPSRC for sup-
tions. The application of this technique as a correlative tool to
porting the energy storage work in the Electrochemical Innovation
identify deviations from expected behaviour could also be used as a
Lab (EP/R020973/1; EP/R023581/1; EP/N032888/1) and the
first step in end-of-life assessment for batteries, aiding the ever-
Institute for Future Transport and Cities (EP/R023581/1) and
increasing drive to improve the reusability, remanufacture and
Innovate UK for funding the ‘Valuable’ project (Grant No.
recycling of Li-ion cells and components.
104182). The authors would also like to acknowledge the Royal
Academy of Engineering for funding Robinson and Shearing
through ICRF1718\1\34 and CiET1718 respectively and the
Faraday Institution (EP/S003053/1, grants FIRG003, FIRG014).Journal of The Electrochemical Society, 2020 167 120530
8. M. Broussely, P. Biensan, F. Bonhomme, P. Blanchard, S. Herreyre, K. Nechev,
and R. J. Staniewicz, “Main aging mechanisms in Li ion batteries.” J. Power
Sources, 146, 90 (2005).
9. Y. Zhang, C. Zhao, and Z. Guo, “Simulation of crack behavior of secondary
particles in Li-ion battery electrodes during lithiation/de-lithiation cycles.” Int. J.
Mech. Sci., 155, 178 (2019).
10. J. Li, E. Murphy, J. Winnick, and P. Kohl, “Studies on the cycle life of commercial
lithium ion batteries during rapid charge–discharge cycling.” J. Power Sources,
102, 294 (2001).
11. B. Lu, C. Ning, D. Shi, Y. Zhao, and J. Zhang, “Review on electrode-level fracture
in lithium-ion batteries.” Chinese Phys. B., 29, 026201 (2020).
12. J. P. Pender et al., “Electrode degradation in lithium-ion batteries.” ACS Nano., 14,
1243 (2020).
13. A. Pfrang, A. Kersys, A. Kriston, D. U. Sauer, C. Rahe, S. Käbitz, and
E. Figgemeier, “Long-term cycling induced jelly roll deformation in commercial
18650 cells.” J. Power Sources, 392, 168 (2018).
14. T. Waldmann, S. Gorse, T. Samtleben, G. Schneider, V. Knoblauch, and
M. Wohlfahrt-Mehrens, “A mechanical aging mechanism in lithium-ion batteries.”
J. Electrochem. Soc., 161, A1742 (2014).
15. J. Kurfer, M. Westermeier, C. Tammer, and G. Reinhart, “Production of large-area
lithium-ion cells—preconditioning, cell stacking and quality assurance.” CIRP
Ann., 61, 1 (2012).
16. M. D. R. Kok, J. B. Robinson, J. S. Weaving, A. Jnawali, M. Pham, F. Iacoviello,
D. J. L. Brett, and P. R. Shearing, “Virtual unrolling of spirally-wound lithium-ion
cells for correlative degradation studies and predictive fault detection.” Sustain.
Energy Fuels., 3, 2972 (2019).
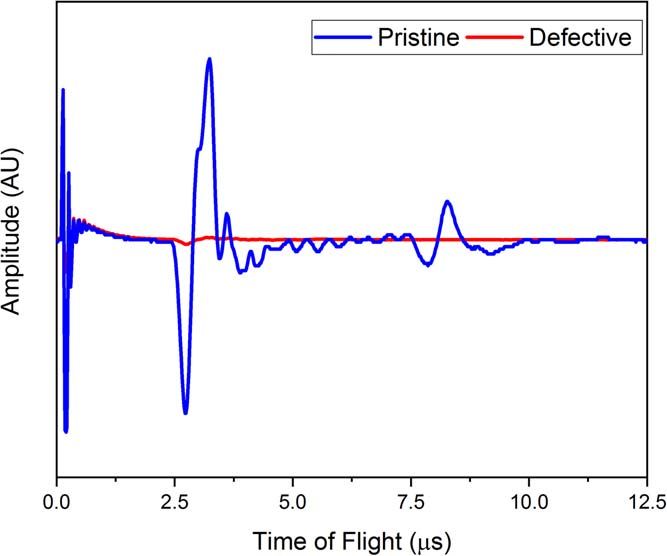
Figure 6. Ultrasonic ToF waveforms obtained in through transmission mode 17. J. Zhang and J. Lee, “A review on prognostics and health monitoring of Li-ion
through the pristine and defective commercial cells shown in Fig. 5 showing battery.” J. Power Sources, 196, 6007 (2011).
large differences between the transmission signals due to the presence of the 18. X. Li, C. Yuan, X. Li, and Z. Wang, “State of health estimation for Li-Ion battery
defect. using incremental capacity analysis and Gaussian process regression.” Energy, 190,
116467 (2020).
19. L. Chen, Z. Lü, W. Lin, J. Li, and H. Pan, “A new state-of-health estimation method
The authors also acknowledge the STFC for supporting Shearing and for lithium-ion batteries through the intrinsic relationship between ohmic internal
Brett (ST/K00171X/1) and ACEA for supporting ongoing research resistance and capacity.” Measurement, 116, 586 (2018).
20. M. Berecibar, F. Devriendt, M. Dubarry, I. Villarreal, N. Omar, W. Verbeke, and
at the EIL. Support from the National Measurement System of the J. Van Mierlo, “Online state of health estimation on NMC cells based on predictive
UK Department for Business, Energy and Industrial Strategy is also analytics.” J. Power Sources, 320, 239 (2016).
gratefully acknowledged. 21. G. You, S. Park, and D. Oh, “Real-time state-of-health estimation for electric
vehicle batteries: a data-driven approach.” Appl. Energy, 176, 92 (2016).
ORCID 22. X. Hu, J. Jiang, D. Cao, and B. Egardt, “Battery health prognosis for electric
vehicles using sample entropy and sparse Bayesian predictive modeling.” IEEE
James B. Robinson https://orcid.org/0000-0002-6509-7769 Trans. Ind. Electron., 63, 2645 (2016).
23. Y. Zou, X. Hu, H. Ma, and S. E. Li, “Combined state of charge and state of health
Rhodri E. Owen https://orcid.org/0000-0002-1246-2988 estimation over lithium-ion battery cell cycle lifespan for electric vehicles.”
Matt D. R. Kok https://orcid.org/0000-0001-8410-9748 J. Power Sources, 273, 793 (2015).
Jude Majasan https://orcid.org/0000-0002-9573-5039 24. T. Ohzuku, H. Tomura, and K. Sawai, “Monitoring of particle fracture by acoustic
Tazdin Amietszajew https://orcid.org/0000-0001-7452-1034 emission during charge and discharge of Li/MnO2 cells.” J. Electrochem. Soc., 144,
3496 (1997).
Alexander J. Roberts https://orcid.org/0000-0002-3920-9579 25. C. Villevieille, M. Boinet, and L. Monconduit, “Direct evidence of morphological
Jarred Z. Olson https://orcid.org/0000-0001-7560-8668 changes in conversion type electrodes in Li-ion battery by acoustic emission.”
Dan J. L. Brett https://orcid.org/0000-0002-8545-3126 Electrochem. Commun., 12, 1336 (2010).
Paul R. Shearing https://orcid.org/0000-0002-1387-9531 26. K. Rhodes, N. Dudney, E. Lara-Curzio, and C. Daniel, “Understanding the
degradation of silicon electrodes for lithium-ion batteries using acoustic emission.”
J. Electrochem. Soc., 157, A1354 (2010).
References 27. B. Sood, C. Hendricks, M. Osterman, and M. Pecht, “Health monitoring of lithium-
1. Japan Transport Safety Board, Aircraft Serious Incident Investigation Report All ion batteries.” Electron. Device Fail. Anal., 16, 4 (2014).
Nippon Airways Co., LTDJA804A. Report No. AI2014-4 (2014), https://www.mlit. 28. A. G. Hsieh, S. Bhadra, B. J. Hertzberg, P. J. Gjeltema, A. Goy, J. W. Fleischer, and
go.jp/jtsb/eng-air_report/JA804A.pdf. D. A. Steingart, “Electrochemical-acoustic time of flight: in operando correlation of
2. U.S. Department of Energy, Report of Investigation: Hybrids Plus Plug in Hybrid physical dynamics with battery charge and health.” Energy Environ. Sci., 8, 1569
Electric Vehicle (2008), https://prius-touring-club.com/librairie/mediatheque/pdf/ (2015).
toyota-prius-a123-car-fire-investigation-report-2008.pdf. 29. G. Davies, K. W. Knehr, B. Van Tassell, T. Hodson, S. Biswas, A. G. Hsieh, and D.
3. Air Accident Investigation Branch, Report on the serious incident to Boeing B787- A. Steingart, “State of charge and state of health estimation using electrochemical
8, ET-AOP London Heathrow Airport on 12 July 2013 (2015), https://assets. acoustic time of flight analysis.” J. Electrochem. Soc., 164, A2746 (2017).
publishing.service.gov.uk/media/55d43f8d40f0b6091a000001/AAIB_2-2015_ET- 30. J. B. Robinson, M. Maier, G. Alster, T. Compton, D. J. L. Brett, and P. R. Shearing,
AOP.pdf. “Spatially resolved ultrasound diagnostics of Li-ion battery electrodes.” Phys.
4. National Transport Safety Board, Auxiliary Power Unit Battery Fire Japan Airlines Chem. Chem. Phys., 21, 6354 (2019).
Boring 787-8, JA829J Report No. NTSB/AIR-14/01 (2014), https://www.ntsb.gov/ 31. J. B. Robinson, M. Pham, M. D. R. Kok, T. M. M. Heenan, D. J. L. Brett, and P.
investigations/AccidentReports/Reports/AIR1401.pdf. R. Shearing, “Examining the cycling behaviour of li-ion batteries using ultrasonic
5. M. J. Loveridge et al., “Looking deeper into the Galaxy (Note 7).” Batteries., 4, 1 time-of-flight measurements.” J. Power Sources, 444, 227318 (2019).
(2018). 32. C. Bommier, Y. Lu, M. Williams, C. Bommier, W. Chang, Y. Lu, J. Yeung, and
6. Samsung, (2016), Samsung Expands Recall to All Galaxy Note7 Devices https:// G. Davies, “In operando acoustic detection of lithium metal plating in commercial
pages.samsung.com/us/note7/recall/index.jsp. LiCoO2/graphite pouch cells.” Cell Reports Phys. Sci., 1, 100035 (2020).
7. Shmuel De-Leon, Samsung Galaxy Note7 Case—Battery Safety Issues Impact on
Business (2017), http://www.sdle.co.il/wp-content/uploads/2018/08/18-samsung-
case-battery-safety-issues-impact-on-business-ver-3.pdf.You can also read