A PROFILE OF POVERTY IN EDMONTON UPDATE - February 2017 - Living Wage Canada
←
→
Page content transcription
If your browser does not render page correctly, please read the page content below

A PROFILE OF
POVERTY IN
EDMONTON
UPDATE
        February 2017
CONTENTS

                                             Purpose of the Update ................................................................................ 1
                                                   Methods ............................................................................................... 1
                                                   Metro Edmonton Has Relatively High Median Incomes ......................3
 A PROFILE OF POVERTY IN
                                                   Increasing Diversity—Newcomers ....................................................... 4
   EDMONTON: UPDATE
                                                   Growing Indigenous Population in Edmonton .....................................4
             FEBRUARY 2017
                                             Overall Picture of Poverty in Edmonton...................................................... 5
                                                   Low Income Rates ................................................................................ 5
 A report to inform EndPovertyEdmonton
     in their work to end poverty in a             Child Poverty Rate Flat Since 2006 ....................................................... 6
          generation. For more on                  Poverty by Family Size .......................................................................... 7
        EndPovertyEdmonton, visit
      www.endpovertyedmonton.ca.                         Most Low Income Families Live Well Below the Poverty Line.......8

               Publisher:                          Significant Proportion of Jobs Pay Low Wages ....................................9
   Edmonton Social Planning Council,
                                                   Provincial Minimum Wage Moves Closer to
#37, 9912 106 Street, Edmonton, Alberta,
                T5K 1C5
                                                   Edmonton’s Living Wage ...................................................................... 9
                                                   Most Edmonton Income from Employment not Government
Prepared by John Kolkman, Research
Associate | Design by Rebecca Fletcher,
                                                   Transfers ............................................................................................. 10
Communications Officer                             Child Tax Benefits Most Important Income Transfer .........................11
February 2017
                                                   Child Benefit Increases Will Reduce Poverty .....................................12
ISBN: 978‐0‐921417‐74‐3
                                                   Impact of Carbon Tax Offset by Rebates ............................................14
Acknowledgments
Thank you Phaidra Jenner, Heather Curtis,          Job Growth Slows Down, Unemployment Higher ..............................14
Susan Morrissey, and members of the
                                                         Employment Insurance Numbers Up Sharply..............................15
EndPovertyEdmonton Stewardship
Roundtable for input and feedback.                       Social Assistance Caseloads Rising...............................................16
This report is published by the Edmonton
                                                         Economic Downturn Adds to Food Security Challenges..............17
Social Planning Council. Any errors,
omissions, and opinions are strictly those         Housing Affordability ......................................................................... 17
of the authors. For a copy of this report,
please visit
                                                   Progress on Plan to End Homelessness..............................................18
www.edmontonsocialplanning.ca                      An Unequal City .................................................................................. 19
                                                         Gender Disparity .......................................................................... 20

  Licensed under a Creative Commons                      Implementation Roadmap’s Impact on Poverty Reduction ........20
 Attribution‐NonCommercial‐ShareAlike                    The Road Map Poverty Reduction Target ....................................21
        4.0 International License.
                                             Conclusion ................................................................................................. 22
                                             References ................................................................................................. 23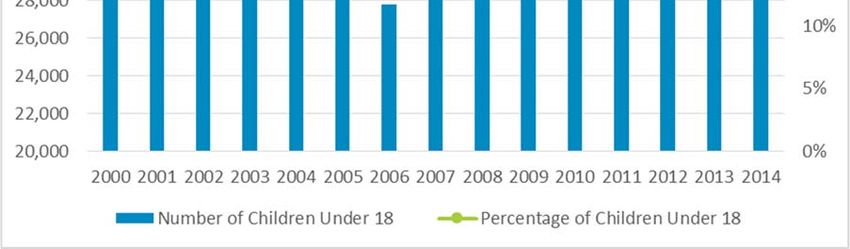
PURPOSE OF THE UPDATE

A Profile of Poverty in Edmonton was first published in January 2015 to describe the landscape of poverty in our city
and to serve as a benchmark for the City’s EndPovertyEdmonton initiative. Much has changed since then both
politically (changes in government at both the provincial and federal levels) and economically (a prolonged downturn
in oil prices). Despite the challenges posed by the current economic downturn, the policies of all three orders of
government have seldom been better aligned to make meaningful progress in poverty reduction.

This report updates many of the poverty trends and challenges identified two years ago within the context of broader
social and economic trends in our community. This profile updates the actions the City could take within its
jurisdiction to help work towards eliminating poverty and in keeping with the Poverty Roadmap approved by City
Council.

This profile update provides data and analysis to answer the following questions:
    1. What is the overall picture of poverty in Edmonton, and how has it changed in the past two years?

    2. How does poverty vary across age, gender, and households in the city? What trends are we seeing among
       different population groups?

    3. Who is impacted most by poverty? What population groups are at higher risk of experiencing poverty than
       others? (i.e., Indigenous people, recent immigrant/refugees, low income workers, women, children and
       youth.)

    4. What are the emerging trends impacting poverty in Edmonton or influencing the work on eliminating
       poverty?

The terms poverty and low income are used interchangeably in this profile. After‐tax income is used as a measure
because it most closely resembles family or household disposable income after taxes have been paid and government
income transfers received. The terms Edmonton region and metro Edmonton are used interchangeably to refer to
the Edmonton Census Metropolitan Area (CMA).

METHODS

There are a number of data sources used to develop this profile detailed in the References section at the end of the
profile. Data on the prevalence of low income is from the Annual Income Estimates for Census Families and
Individuals (T1 Family File) or T1FF for short. Starting with the 2000 tax year, the T1FF standard tables are available
on CANSIM down to the Edmonton CMA level of geography. T1FF data is taken from tax records. It is considerably
more accurate than the previous small sample income surveys used to calculate poverty rates.

EndPovertyEdmonton is focused on the city, not the CMA. The Edmonton Social Planning Council (ESPC) obtained
custom tabulations of low income taxfiler data corresponding to city boundaries to allow for trend analysis at the city
level of geography.

This poverty profile update uses the After‐Tax Low Income Measure (AT LIM) as its definition of the poverty line. AT
LIM is the international standard used to measure poverty and deprivation and is increasingly being adopted by
federal and provincial governments as the de facto Canadian standard.

                                1|A PROFILE OF POVERTY IN EDMONTON 2017 UPDATE
Using LIM, those with after‐tax incomes 50% or below the national after‐tax median income, adjusted for family size,
are considered to be living in low income. After‐Tax LIM is calculated after federal and provincial income taxes have
been paid and income transfers received.

The 2014 low income thresholds are $17,824 for a single person household, $30,301 for a lone‐parent family with
two children under age 16, and $35,648 for a two‐parent family with two children under age 16. All of those below
the annual income thresholds for family sizes and family types described in Table 1 are considered to be living in low
income. (Statistics Canada 2016c).

                      Table 1: Low Income Thresholds (After‐Tax Low Income Measure, 2014)
                                                   Children Less than 16 Years of Age
 Number of Adults*             0                      1                     2                        3
         1                   17,824                24,954                 30,301                  35,648
         2                   24,954                30,301                 35,648                  40,995
         3                   32,083                37,430                 42,778                  48,125
         4                   39,213                44,560                 49,907                  55,254
*Includes parents/spouses, children aged 16 and 17 years, and the first child in lone‐parent families regardless of age
(Statistics Canada, 2015).

In order to measure long‐term trends, where available, the year 2000 is the starting point for most of the trend data
in this profile.

T1FF data divides families into three types using the same definitions as the federal census. Couple families include
both married and common‐law whether or not they have dependent children. Lone‐parent families can be headed by
either gender and have dependent children under age 18. Persons not in census families are also called single adults
whether they live alone or with others who are not immediate family.

This update is being published two years after the first poverty profile was published by the Edmonton Social
Planning Council. It contains the most recently available data but does not include data from the 2016 federal census
which will be released throughout 2017 according to the schedule available at www12.statcan.gc.ca/census‐
recensement/2016/ref/release‐dates‐diffusion‐eng.cfm (Statistics Canada, 2016e).

The economic downturn caused by low oil and natural gas prices—now entering its third year—is having a major
impact on Edmonton and its economy. This update captures some of the impacts and how they will influence and
inform the EndPovertyEdmonton strategy adopted by City Council going forward.

POPULATION GROWTH SLOWING

Edmonton remains one of Canada’s fastest growing major cities. The 2016 municipal census found the city’s
population to be 899,447, an increase of 21,521 in two years. While still a healthy increase, the pace of population
growth has slowed significantly from the 60,428 population increase between 2012 and 2014. Since 2001, the city’s
population has grown by 242,107, an increase of 36.3%. This rate of growth since the turn of the millennium trails
only Calgary (City of Edmonton, 2017).

Edmonton’s rapid growth has until recently been driven by a strong economy. Since 2000, metro Edmonton has
added 279,500 jobs, an increase of 63.7% (Statistics Canada, 2017d). Despite over two years of low energy prices,
                                2|A PROFILE OF POVERTY IN EDMONTON 2017 UPDATE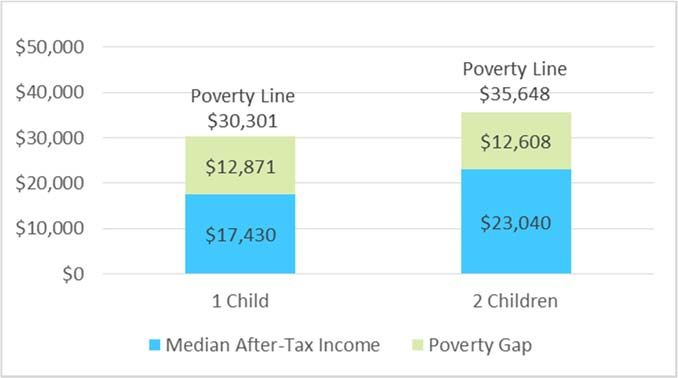
Edmonton’s diversified economy was surprisingly resilient in the early stages of the economic downturn. Despite the
rapid decline of oil prices beginning in the fall of 2014, job numbers continued to increase until the spring of 2016,
and have only begun to decline in the latter half of 2016.

The number of people employed in metro Edmonton grew from an average of 743,200 in 2014 to 765,400 in 2016, an
increase of 22,200. Many of the new jobs were part‐time, and they tended to be in sectors like public administration,
health care and education. Until now, these sectors have been shielded from the cutbacks that have taken place in
other sectors especially jobs tied to the energy sector.

The number of unemployed persons in metro Edmonton increased to an average of 58,900 in 2016, up from an
average of 40,800 two years earlier in 2014.

METRO EDMONTON HAS RELATIVELY HIGH MEDIAN INCOMES AND YOUTHFUL POPULATION

In 2014, at $38,100 per taxfiler, Edmonton had the highest median after‐tax income of any of Canada’s 25 census
metropolitan areas (CMA) with Calgary very close behind at $38,030 (Statistics Canada, 2016c). Median incomes
could reasonably be expected to decline in future years as the 2014 data only captures the very beginning of the oil
price decline.

With a median age of 36.0 in 2015, metro Edmonton is the youngest of Canada’s six largest urban centres (Statistics
Canada, 2016f). Compared to other cities, Edmonton’s younger population means more people in the labour force for
longer, and fewer challenges with an aging population.

                                     (Edmonton Social Planning Council and Edmonton Community Foundation, 2016)

                               3|A PROFILE OF POVERTY IN EDMONTON 2017 UPDATE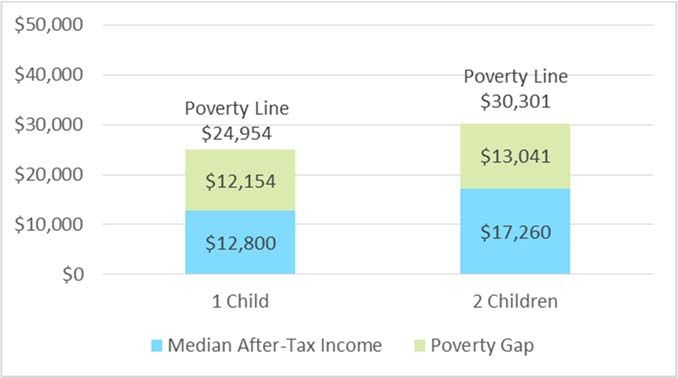
INCREASING DIVERSITY—NEWCOMERS

Edmonton is an increasingly diverse city. The National Household Survey found that, in 2011, 205,445 Edmontonians
were born outside of Canada (25.8%) and 238,755 (30.0%) were visible minorities (Statistics Canada, 2013). Because
an increasing proportion of newcomers are choosing to settle here, there is every reason to expect that these
percentages will be even higher when the results of the 2016 Census are released on October 25, 2017.

In 2015, 16,739 immigrants and refugees settled here as permanent residents, compared to 6,016 a decade earlier in
2005. Between 2005 and 2015, the number of persons arriving as permanent residents has increased by 178.2%. This
compares to a 3.7% increase in the number of permanent residents arriving in the country as a whole during the
same period.

Despite the current downturn, the number of arrivals from overseas shows no signs of slowing. In the first nine
months of 2016, 14,678 people arrived in Edmonton as permanent residents. Of the new 2016 arrivals, 1,644 (or
11.2%) were Syrian refugees (Government of Canada, 2016b).

One of the results of Edmonton’s increasing diversity is that the growth in the number of students enrolled in English
Language Learning (ELL) is significantly faster than the growth in overall student enrolment between the years 2011
to 2016. Total student enrolment in Edmonton Public Schools increased by 15.8% in the past five years, whereas ELL
enrolment in the same time period increased by 77.9%. Total enrolment in Edmonton Catholic Schools increased by
19.4%, whereas ELL enrolment increased by 97.7% (Edmonton School Boards, 2016).

Many newcomers to Edmonton access services to help with their successful settlement including help finding
housing, English language training, job search, skills training, and academic upgrading. In the 18 months between
April 2015 and September 2016, 78,309 unique clients received such services in Alberta from settlement service
providers (Government of Canada, 2016a).

GROWING INDIGENOUS POPULATION IN EDMONTON

Edmonton is located at the geographic centre of the Alberta portion of Treaty 6 territory. In 2011, 41,985
Edmontonians had an Indigenous identity, the second largest urban Indigenous population after the city of Winnipeg
(Statistics Canada, 2013). Based on its past rapid growth at about twice the rate of overall population growth, the
number of Indigenous Edmontonians is expected to increase significantly when the results of the 2016 Census for
Indigenous Peoples are released on October 25, 2017.

There is no updated data available about household incomes and poverty rates for Indigenous Edmontonians beyond
that available in the 2011 National Household Survey and reported in the Edmonton Social Planning Council’s 2015
poverty profile. Focusing only on lower median incomes and higher poverty rates does not tell the entire story.
Market income (mostly from paid employment) made up 85.1% of the total income of Indigenous Edmontonians
compared to 14.9% from all government transfers. 14.1% of total income was paid to the federal and Alberta
governments as income taxes.

The past two years of low energy prices is also taking a toll on Indigenous Edmontonians. The unemployment rate for
Indigenous Edmonton residents not living on First Nations (off‐reserve) averaged 11.2% in 2016 compared to 7.0%
two years earlier in 2014 (Government of Alberta, 2016a). The number of Indigenous people employed was up by

                               4|A PROFILE OF POVERTY IN EDMONTON 2017 UPDATE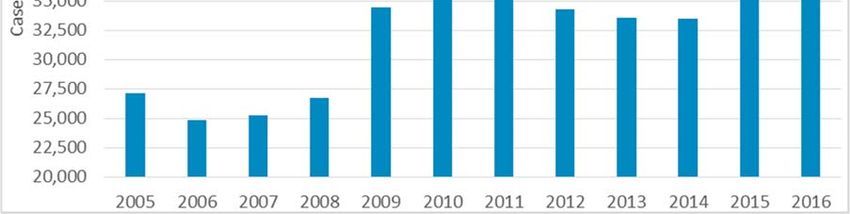
2,000 from an average of 36,000 in 2014 to 38,000 in 2016. However, this pace was not enough to keep up with the
number of Indigenous people entering the job market, hence the higher unemployment rate.

OVERALL PICTURE OF POVERTY IN EDMONTON

LOW INCOME RATES

The City of Edmonton has a disproportionately high rate of low income compared to suburban communities located
within metro Edmonton. The charts below show the low income rate in the city of Edmonton was 12.1% in 2014,
more than double the 5.7% low income rate in the metro region outside city boundaries. In 2014, 107,960 persons
lived in low income in the city of Edmonton (out of 890,860), and 22,710 persons lived in low income in the metro
region outside city boundaries (out of 375,810) (Statistics Canada, 2016h).

                                   Chart 1: Low Income Rate, City of Edmonton

                                    Chart 2: Low Income Rate, CMA Minus City

                              5|A PROFILE OF POVERTY IN EDMONTON 2017 UPDATE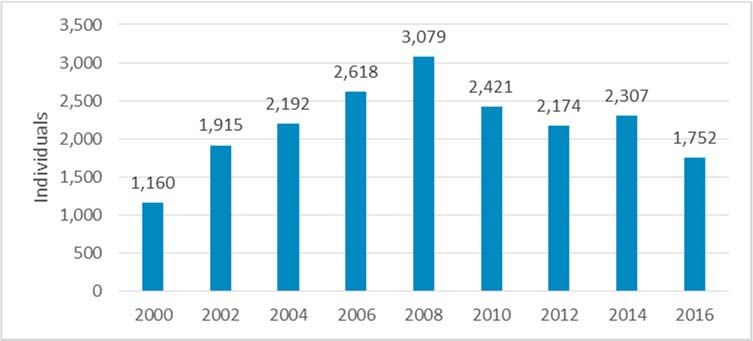
The 107,960 persons living in low income in the city of Edmonton were comprised of 47,730 persons in low income
couple families, 31,150 persons in lone‐parent families, and 29,090 single adults (Statistics Canada, 2016h).

Chart 3 shows the prevalence (rate) of low income by family type in the city of Edmonton between the years 2000 to
2014 compared to all families of that type. In 2014, the highest poverty rate was experienced by lone‐parent families
(34.2%), followed by single adults (17.2%) and then by couple families (7.6%). Since the year 2000, there has been a
modest reduction in poverty rates across all family types.

           Chart 3: Prevalence of Low Income by Family Type, Edmonton City (Statistics Canada, 2016h)

CHILD POVERTY RATE FLAT SINCE 2006

Children are more likely to live in poverty than adults. In 2014, 34,220 children aged 0 to 17 years lived in low income
in the city of Edmonton, a poverty rate of 17.8 %. Of this total, 15,420 lived in couple families and 18,800 lived in
lone‐parent families. Chart 4 shows both the number of children living in low income and the poverty rate. The
poverty rate declined between 2000 and 2006 and has since levelled off. The number of children living in poverty
dropped significantly between 2000 and 2006 and has since increased modestly. (Statistics Canada, 2016g).

                                6|A PROFILE OF POVERTY IN EDMONTON 2017 UPDATE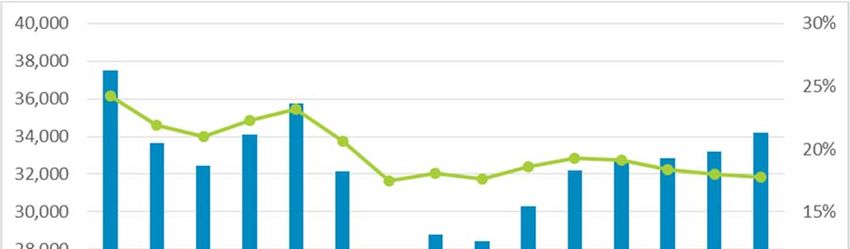
Chart 4: Prevalence of Children Living in Low Income Families, Edmonton City, 2014 (Statistics Canada, 2016h)

POVERTY BY FAMILY SIZE

The T1FF taxfiler data in Chart 5 calculates poverty rates by family size. While there is little difference in poverty rates
for families with one or two children, poverty rates are higher for larger families with three or more children
(Statistics Canada, 2016a). 54.0% of lone‐parent families with three children or more lived in poverty in Edmonton in
2014, as did 11.6% of couple families with three children or more.

         Chart 5: Prevalence of Low Income by Family Size, Edmonton City, 2014 (Statistics Canada, 2016h)

                                 7|A PROFILE OF POVERTY IN EDMONTON 2017 UPDATE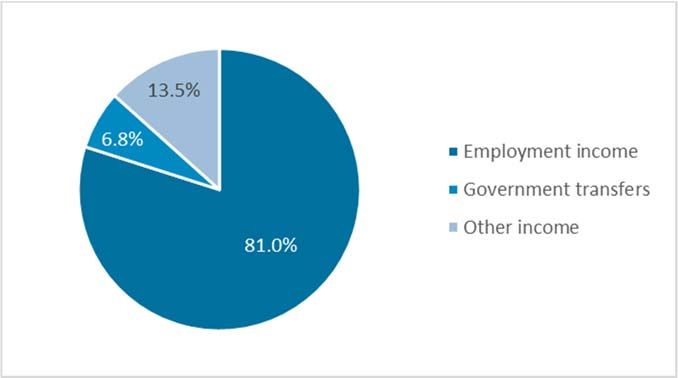
MOST LOW INCOME FAMILIES LIVE WELL BELOW THE POVERTY LINE
Most low income families in Edmonton live far below the poverty line. The poverty gap measures how far half of
those living in low income are below the poverty line. Chart 6 illustrates the difference between the 2014 median
after‐tax income of all low income lone parent families and the poverty line for those families. To be lifted above the
poverty line, their median after‐tax income would need to increase by $12,154 for one child families and $13,041 for
families with two children.

          Chart 6: Poverty Gap for Low Income Lone Parent Families, by Family Size, Edmonton City, 2014
                                            (Statistics Canada, 2016h)

The situation is similar for two‐parent families. As shown on Chart 7, to be lifted out of poverty, the median after‐tax
income of a typical two‐parent family with one child would need to increase by $12,871 and by $12,608 for a typical
two‐parent family with two children.

    Chart 7: Poverty Gap for Low Income Two Parent Families, Edmonton City, 2014 (Statistics Canada, 2016h)

                                8|A PROFILE OF POVERTY IN EDMONTON 2017 UPDATE
SIGNIFICANT PROPORTION OF JOBS PAY LOW WAGES
Working poverty means being employed (often full‐time) while earning an insufficient income to be above the
poverty line. Alberta has the highest rate of working poverty in Canada. In 2011, 59.2% of Alberta children in poverty
lived in families where one or both parents worked full‐time for the entire year (Statistics Canada, 2014). Due to
limitations of the survey size, no comparable data is available for Edmonton but the results would not be expected to
be significantly different than Alberta as a whole.
Working poverty exists in Edmonton because while jobs are abundant, a significant proportion are low paying. Low
paying jobs are often precarious, lacking in job security and fixed hours of work. Low paying jobs also
disproportionately lack benefits like employer paid pensions and prescription drug and dental coverage.
In 2016, over three‐quarters (75.2%) of jobs in metro Edmonton are in the services sector, rather than in the better
paying goods producing and construction sectors. Within the services sector, the largest occupation by number of
employees is retail and wholesale trade (111,000). Accommodation and food services also employ many in Edmonton
(46,600). Both of these occupational groupings pay predominantly low wages (Statistics Canada, 2017c).
The following custom tabulations were obtained from Statistics Canada by Public Interest Alberta (2016). They
indicate the average number of employed Albertans in each category for the year ending June 30, 2016. Low‐wage
workers are defined as those earning $15 per hour or less.
Nearly one in five employed people in the region are low‐wage workers.
118,800 of 668,300 employed people in the region earn $15 per hour or less (17.8%).
134,800 earn $16 per hour or less (20.2%).
53,000 earn the new minimum wage ($12.20 per hour) or less (7.9%).
The majority of low‐wage workers in the region are women.
73,700 low‐wage workers are women (62.0%).
35,000 workers earning the new minimum wage ($12.20 per hour) or less are women (66.0%).
93,300 (78.5%) are 20 years of age or older.
26,100 (22.0%) are between 20 and 24 years old.
43,400 (36.5%) are between 25 and 44 years old.
23,800 (20.0%) are 45 years of age or older.
PROVINCIAL MINIMUM WAGE MOVES CLOSER TO EDMONTON’S LIVING WAGE
On October 1, 2016, the Alberta government increased the minimum wage from $11.20 per hour ($10.70 per hour
for liquor servers) to $12.20 per hour for all workers including liquor servers. The minimum wage is scheduled to
increase by two additional steps of $1.40 per hour each to reach $15 per hour on October 1, 2018. These increases
will bring Alberta’s minimum wage closer to Edmonton’s living wage (Government of Alberta, 2016c).
For the year 2016, the Edmonton Social Planning Council calculated a living wage of $16.69 per hour for a two‐parent
family with two children. This is the hourly wage a typical family of four with both parents working full‐time for the
entire year requires to live in economic stability and maintain a modest standard of living. The $0.67 per hour drop
9|A PROFILE OF POVERTY IN EDMONTON 2017 UPDATE(compared to 2016, a year earlier) is primarily due to increased benefits from the enhanced Canada Child Benefit and
enhancements to the Alberta Family Employment Tax Credit (AFETC) (Edmonton Social Planning Council, 2016a).
The ESPC also calculated living wages for two other household types. The 2016 hourly living wage for a lone‐parent
family with one child was $18.15 per hour, a drop of $1.18 per hour compared to 2015. The drop was mainly due to
the enhanced Canada Child Benefit, the enhanced AFETC, and the new Alberta Child Benefit. Meanwhile, the 2016
living wage for a single adult living alone went up by $0.25 per hour to $17.81 per hour, mainly due to increases in
the cost of cellular phone plans (Edmonton Social Planning Council, 2016b).
MOST EDMONTON INCOME FROM EMPLOYMENT NOT GOVERNMENT TRANSFERS
Employment income is from paid employment or net self‐employment. Government income transfers include child
tax benefits, social assistance, employment insurance, the GST tax credit, public pensions, and other payments to
persons by the federal and provincial governments. Other income includes investment income, private pensions and
child support payments by non‐custodial parents (Statistics Canada, 2016a). The data below is for all families. It is not
possible to isolate low income families from the dataset.
Edmontonians in all family types (couple, lone‐parent and single adults) obtain most of their income from paid
employment. Moreover, the trend between 2000 and 2014 has been toward a greater reliance on employment and
less reliance on government transfers for family income. Chart 8, Chart 9, and Chart 10 show that, in all three census
family types, the proportion of income from government transfers decreased, while the share of employment income
increased in importance for lone‐parents and single adults. Lone‐parents, for instance, earn almost $5 for every $1
they receive in all government income transfers.
Chart 8: Source of Income, Couple Families, Edmonton CMA, 2014 (Statistics Canada, 2016a)
10 | A P R O F I L E O F P O V E R T Y I N E D M O N T O N 2 0 1 7 U P D A T EChart 9: Source of Income, Lone Parent Families, Edmonton CMA, 2014 (Statistics Canada, 2016a)
Chart 10: Source of Income, Persons Not in Census Families, Edmonton CMA, 2014 (Statistics Canada, 2016a)
CHILD TAX BENEFITS MOST IMPORTANT INCOME TRANSFER
There were 35,210 lone‐parent families in the city of Edmonton in 2014, of which 10,760 families (or 30.6%) lived
below the poverty line. There were 110,000 couple families with children in the city of Edmonton in 2014. 7,610 of
these couple families (or 6.9%) lived below the poverty line.
In 2014, lone‐parent families in metro Edmonton received $142.1 million in child tax benefits from the federal
government including the supplement for low income families. This compares to $96.9 million received by Edmonton
lone‐parents in provincial social assistance (Statistics Canada, 2016a). Social assistance is mainly comprised of Alberta
Works and Assured Income for the Severely Handicapped (AISH) income support benefits. This shows the importance
of child tax benefits in reducing child poverty. Chart 11 compares the relative shares of government income transfers
to lone‐parent families and illustrates that lone‐parent families receive almost $1.50 in child tax benefits for every $1
received from social assistance.
11 | A P R O F I L E O F P O V E R T Y I N E D M O N T O N 2 0 1 7 U P D A T EChart 11: Relative Shares of Government Transfers, Lone Parent Families, Edmonton CMA, 2014
(Statistics Canada, 2016a)
Couple families in Chart 12 show a similar trend of increasing importance of federal child tax benefits compared to
social assistance. In 2014 couple families received over $2 in child tax benefits for every $1 dollar in social assistance.
This includes both couples with and without children, as the dataset does not allow for a further breakdown.
Chart 12: Relative Shares of Government Transfers, Couple Families, Edmonton CMA, 2014
(Statistics Canada, 2016a)
CHILD BENEFIT INCREASES WILL REDUCE POVERTY
Viewed through a social policy lens, the new Alberta Child Benefit and the new Canada Child Benefit (which adds to
and replaces several poorly‐targeted programs) are child poverty game changers. Starting in July 2016, an Alberta
family with two children making $30,000 annually will receive $4,300 more per year from the federal and provincial
governments. These impacts are illustrated in Chart 13.
12 | A P R O F I L E O F P O V E R T Y I N E D M O N T O N 2 0 1 7 U P D A T EChart 13: Additional Annual Child Benefits, Two Children (Government of Alberta, 2016b)
Non‐taxable child benefits are the most effective way to reduce poverty because they put money directly into the
pockets of low income families. Low income working families receive the same amount as those on government
income support at the same level of income. Administrative costs are negligible. Amounts are calculated by the
Canadian Revenue Agency from tax returns. This makes it more important than ever for all low income families to file
tax returns regardless of whether they pay taxes.
The new Alberta Child Benefit will provide an annual benefit of up to $1,100 per child, and up to $550 per child for
each of the next three children. Benefits will begin to be phased out at $25,500 of net family income, and be fully
phased out at $41,220 of net family income. The new Alberta Child Benefit will complement an enhanced Alberta
Family Employment Tax Credit (AFETC) which bolsters the household incomes of low income working families with
children. Maximum benefits under the AFETC are provided between $25,500 and $41,220 of net family income, and
will begin to be phased out thereafter. With the AFETC enhancements, the maximum benefit will be $1,457 per year
for a low income working family with two children (Government of Alberta, 2016b).
The federal government has repealed income splitting and several other measures that mainly benefit higher income
families. Effective July 1, 2016, these measures have been replaced with a progressive new Canada Child Benefit
(CCB) for low and middle income families. Low income families will see sizeable increases in their benefits of about
$1,000 per year for each child. Families making about $45,000 to $90,000 in net family income will see the biggest
increases compared to the previous system. Federal child tax benefits are about more than just fighting child poverty.
They are also about supporting middle income families with the substantial costs of raising children. The new CCB is
designed so that two child families with up to $157,000 in yearly income will receive more from the new benefit than
they received from the previous child benefits program (Government of Alberta, 2016b).
Federal and provincial child benefit enhancements come at a favourable time. Many Alberta families are facing
reductions in paid employment earnings due to the current economic downturn. The increases in child benefits will
13 | A P R O F I L E O F P O V E R T Y I N E D M O N T O N 2 0 1 7 U P D A T Ehelp offset decreases in employment income. Otherwise, the downturn would likely have caused child poverty to rise
due to the loss in working income. As a result of the timely enhancements to federal child benefits and the
introduction of an Alberta Child Benefit, child poverty rates will instead go down.
IMPACT OF CARBON TAX OFFSET BY REBATES
Effective January 1, 2017, an economy wide carbon price of $20 per tonne is being implemented on diesel, gasoline,
propane, and natural gas used for home heating. The price will increase to $30 per tonne on January 1, 2018.
To offset increased costs for transportation and home heating, rebates to low‐ and middle‐income households are
being provided through the income tax system. Rebates will be mailed or direct deposited to eligible households,
either quarterly, semi‐annually or annually, depending upon the amount received. The first payment was made in
January 2017 based on 2015 tax returns that have already been filed.
As shown in the table below, the income thresholds are more than sufficient to ensure all low income families and
individuals receive a full rebate.
Table 2: Income Thresholds for Carbon Tax Rebates (Family Net Income)
2017 2018
Rebate amounts First adult $200 $300
Spouse/Equivalent to spouse $100 $150
Each child (maximum 4) $30 $45
Maximum income to receive full rebate Single $47,500 $47,500
Couple $95,000 $95,000
Families $95,000 $95,000
Maximum income to receive partial rebate Single $51,250 $55,000
Couple $100,000 $103,750
Couple with 1 child $100,750 $104,875
Couple with 2 children $101,500 $106,000
Couple with 3 children $102,250 $107,125
Couple with 4 children $103,000 $108,250
(Government of Alberta, 2016b, p. 97)
Once rebates are factored in, most low income households will likely come out money ahead from the carbon levy
because people living in low income tend to live in smaller accommodation, use public transit, and drive less if they
do have cars. However, there will always be exceptions. Until July 2017, the rebates will be based on 2015 income tax
returns, even if households experienced a loss of income in 2016. The only way to avoid this would be to delay the
rebates until July 2017, which would have imposed financial hardship on all low and middle income Edmontonians.
JOB GROWTH SLOWS DOWN, UNEMPLOYMENT HIGHER
The Edmonton region has mostly experienced strong employment growth since the year 2000. The number of those
employed in metro Edmonton has grown by 268,000 from 491,200 in the year 2000 to 759,200 in the year 2015 (Statistics
Canada, 2016c).
14 | A P R O F I L E O F P O V E R T Y I N E D M O N T O N 2 0 1 7 U P D A T EDuring the first 18 months after the dramatic decline in energy prices, Edmonton’s economy was surprisingly resilient.
Employment in Edmonton continued to grow modestly in 2015 and early 2016. As pointed out in the October 2016
Economic Outlook from the City’s Chief Economist, in the second half of 2016 Edmonton is experiencing significant job
losses in construction and manufacturing that are only being partially offset by job gains in retail, public administration,
and education (City of Edmonton, 2016, October).
The employment rate is the number of employed persons as a percentage of the population 15 years of age and older.
The unemployment rate is the number of unemployed persons as a percentage of the labour force (employed and
unemployed). The employment rate has consistently been one of the highest among major Canadian cities, and the
unemployment rate one of the lowest since the year 2000.
Chart 14 shows the overall employment and unemployment rates from the years 2000 through 2016. Metro Edmonton’s
employment rate declined from 69.3% in 2014 to 68.3% in 2016. Edmonton’s unemployment rate went from an average of
5.2% in 2014 to an average of 7.1% in 2016.
Chart 14: Employment Status, 15 Years and Older, Edmonton CMA, (Statistics Canada, 2016c)
The unemployment rate for Indigenous Edmontonians living off‐reserve has climbed into double‐digits since the energy
downturn increasing from an average of 7.7% in 2014 to an average of 11.3% for the first 11 months of 2016.
EMPLOYMENT INSURANCE NUMBERS UP SHARPLY
Prior to the economic downturn, the vast majority of Edmontonians, including many living in poverty, were employed,
many full‐time. A direct consequence of higher unemployment in the Edmonton region is a sharp climb in the number of
those receiving regular benefits from the Employment Insurance Program. As shown on Chart 15, the number of persons
receiving EI regular benefits has gone up by a factor of about 2.5 times in the past two years, from an average of 10,361
recipients in 2014 to an average of 26,314 recipients during the first 11 months of 2016.
15 | A P R O F I L E O F P O V E R T Y I N E D M O N T O N 2 0 1 7 U P D A T EChart 15: Employment Insurance Beneficiaries, Annual Average, Edmonton CMA (Statistics Canada, 2017b)
SOCIAL ASSISTANCE CASELOADS RISING
Another predictable impact of the economic downturn is an increase in the number of Edmonton households receiving
Alberta Works (social assistance) benefits. The peak in social assistance caseloads tends to come later than the peak in
Employment Insurance caseloads. That’s because people without a job will exhaust their employment insurance eligibility
first. If they are still not able to secure employment, they then turn to Alberta Works for support.
As shown on Chart 16 below, the social assistance (Alberta Works) provincial caseload has grown from a monthly average
of 33,444 in 2014 to a monthly average of 47,530 in the first eleven months of 2016.
Chart 16: Social Assistance Caseload, Alberta (Government of Alberta, 2015)
16 | A P R O F I L E O F P O V E R T Y I N E D M O N T O N 2 0 1 7 U P D A T EECONOMIC DOWNTURN ADDS TO FOOD SECURITY CHALLENGES
An indicator of financial hardship for those experiencing job loss or wage cuts is an increase in food bank use.
Through its hamper program, Edmonton’s Food Bank served an average of 20,500 different people per month during
the calendar year 2016. An average of 38.8% (or 7,957) of those served per month by the food bank were children.
The highest monthly total was 23,681 people served in May during the immediate aftermath of the Fort McMurray
wildfire, but monthly numbers remained in the 20,000 range throughout the year. The March 2016 total of 20,431
people served was 59.3% higher than the 12,825 people served in the same month two years earlier before the
economic downturn (Edmonton’s Food Bank, 2017).
Between 2004 and 2014, the cost of healthy eating went up approximately 60% in Edmonton, about double the
increase of the overall cost of living. In 2015, the average cost of a nutritious food basket for a family of four went up
a further 7% due to widespread drought. However, in 2016, there has been a 5% decline in food prices compared to a
year earlier. The weekly cost of a nutritious food basket for an Edmonton family of four cost $227.95 in December
2016, $11.31 less than the same month one year earlier (Government of Alberta, 2017).
HOUSING AFFORDABILITY
There has been considerable improvement in rental housing availability since the January 2015 poverty profile. As
shown on Chart 17, in the past two years, the City’s rental vacancy rate has gone from 1.7% in October 2014 to 7.0%
in October 2016. There is a lag effect between an increase in the vacancy rate and decreases in rent. Despite a
significant increase in the vacancy rate in 2015, rents still went up albeit at a slower pace than in previous years.
However, in 2016, improved availability of rental accommodation is beginning to put downward pressure on rental
rates with monthly rents dropping by $26 per month.
At $1,229 per month average rent for a typical 2‐bedroom apartment, Edmonton still has the fourth highest rents in
the country. The city is 23.1% above the national average, and trailing only Vancouver, Montreal and Calgary among
major Canadian urban centres.
Paradoxically, during the same time frame that rental availability is increasing, so are wait lists for subsidized rental
accommodation. In its 2015 Annual Report, Capital Region Housing describes the situation as follows:
Dropping oil prices, rising unemployment and the increasing financial pressures on Albertans has led
to an unprecedented increase in demand for social housing units. Over the course of 2015, our waiting
list for Community Housing more than tripled, as we received an average of 231 new applications
each month. As of December 31, 2015 we had more than 4,100 families on our waiting list
(2016, p. 14).
The wait list has continued to grow throughout 2016. As of early December 2016, 4,800 families were waiting for
subsidized rental accommodation (Community of Lendrum Place, 2016).
17 | A P R O F I L E O F P O V E R T Y I N E D M O N T O N 2 0 1 7 U P D A T EChart 17: Average Monthly October Rent and Vacancy Rate, Edmonton City, (Canada Mortgage and
Housing Corporation, 2016)
The three orders of government are investing in additional affordable housing supply, which, combined with more
availability in the private sector, should begin to address Edmonton’s housing crunch. As a result of these
investments, there is currently more affordable housing under construction than there has been for many years.
Hundreds of units are currently under construction by major non‐profit housing developers including Capital Region
Housing, Greater Edmonton Foundation Seniors Housing, and the Right At Home Housing Society, with hundreds of
units more in the planning stage.
PROGRESS ON PLAN TO END HOMELESSNESS
The biennial homeless count conducted by Homeward Trust Edmonton found that homelessness in the city of
Edmonton almost tripled between 2000 and 2008. Due in large part to Edmonton’s 10 Year Plan to End Homelessness
adopted in early 2009, thousands of formerly homeless persons are being housed. The number of homeless persons
dropped from 3,079 in October 2008 to 1,752 in October 2016, a decrease of 43%. The October 2016 count found a
decrease of 24% since the count two years earlier (Chart 18). Reflecting the success of outreach efforts, the number
of unsheltered and provisionally accommodated homeless individuals declined 61% since the 2008 peak. Moreover,
the number of people staying in emergency shelters grew until 2014 but is currently dropping, from 1,343 in October
2014 to 1,120 in October 2016. Moreover, between the 2014 and 2016, the number of families and children being
provisionally accommodated in motels dropped by more than half (51%).
The extent of the decline in homeless numbers in the past two years caught many by surprise, even the Mayor of
Edmonton (Neufeld, 2016, November 29). In a recent editorial, Boyle Street Community Services Executive Director
Julian Daly expressed similar surprise, pointing to increases in the numbers observed camping in the river valley and
using Boyle Street as their mailing address in the past year (Daly, 2016).
18 | A P R O F I L E O F P O V E R T Y I N E D M O N T O N 2 0 1 7 U P D A T EChart 18: Number of Homeless Persons, Edmonton City, October 2000‐2016 (Homeward Trust, 2016)
The 2016 Homeless Count found that 59% of homeless persons were chronically homeless, rather than being
homeless as a result of an unforeseen emergency. People who are chronically homeless are more likely to be
addicted, have a serious mental illness, or both. One of the serious failings of the 10 Year Plan is the shortfall in the
number of permanent supportive housing (PSH) units developed. Instead of the 1,000 PSH units that were identified
as needed during the first 5 years of the plan, only 201 units were actually developed during the first 6 years leaving a
serious shortfall.
Most existing facilities with permanent onsite supports are located in a handful of inner city neighbourhoods. Finding
suitable sites elsewhere in Edmonton is a challenge.
AN UNEQUAL CITY
Over the past three decades, income inequality in Edmonton has increased, with most of the real income gains (after
adjusting for inflation) going to the top 1% of taxfilers.
Chart 19 below shows that the top 1% of taxfilers saw a 54.4% increase in their real after‐tax incomes compared to
only a 9.9% gain for the bottom 99% of taxfilers over the period 1982 to 2014. Even more dramatically, the top 0.1%
(one out of a thousand) of taxfilers saw a 147.4% increase in their real incomes compared to only a 4.7% increase in
the real incomes of the bottom 50% of taxfilers.
Chart 19: Real Median After‐Tax Income Growth, 1982‐2014, Edmonton CMA (Statistics Canada, 2016d)
19 | A P R O F I L E O F P O V E R T Y I N E D M O N T O N 2 0 1 7 U P D A T EPolicy decisions that tend to increase inequality include making personal income taxes flatter, implementing user fees
and means testing, and eroding universal public services like health care and education. Policy changes made recently
by the federal and Alberta governments may help reverse the trend toward greater inequality. This includes restoring
progressiveness to personal income tax so that higher income Albertans pay a higher rate of tax, and the
enhancements made to both federal and provincial child benefits.
GENDER DISPARITY
The most recently available data from the 2011 National Household Survey found that 13.5% of women in the city of
Edmonton lived in poverty compared to 11.9% of men. The gender disparity was highest among seniors 65 years and
older, where the 9.4% poverty rate for women was double the 4.7% rate for men. Taxfiler data does not allow
poverty rates to be broken down strictly by gender. However, with the highest poverty rates being experienced by
mostly female‐headed single parent families, it is not likely the situation has changed much (Statistics Canada, 2013).
In a recent study on gender equality, the Canadian Centre for Policy Alternatives ranked Edmonton 22nd out of the 25
largest Canadian urban centres. While Edmonton ranked near the top in terms of women’s health status, it ranked
near the bottom in the other indicators such as educational attainment, economic equality, civic leadership, and
personal security (McInturff, 2016).
IMPLEMENTATION ROADMAP’S IMPACT ON POVERTY REDUCTION
The first goal of the EndPovertyEdmonton Road Map approved by City Council is a recognition that eliminating
poverty is a profound act of reconciliation with Indigenous Edmontonians. Shaped through numerous engagements
and conversations, the starting actions are envisaged to lead to Indigenous Edmontonians enjoying prosperous lives,
being proud of their history and culture, and connected to the larger community.
There are several actions in the Implementation Road Map that will have a direct beneficial impact on the household
and family well‐being of low income Edmontonians. Action #13 is an initiative involving many Edmonton service
providing agencies led by the United Way of the Alberta Capital Region. The initiative has the target of assisting 1,000
families in five Edmonton communities with targeted supports to lift them out of poverty.
Action #14 calls on City Council to prepare a living wage policy for City staff and contracted services. Action #15
encourages all local employers to learn about and implement a living wage for their employees. Once implemented,
these actions should reduce the level of working poverty, and ensure that those working full‐time for the entire year
have a standard of living above the poverty line.
Action #18 calls for the implementation of a low income transit pass at a 62% discount to regular passes for all low
income transit users regardless of their source of income. The low income transit pass is being cost‐shared by the
provincial government as a three‐year pilot project. Implementation details are still being finalized and the low
income transit pass is scheduled to be in place by September 1, 2017 at a cost of $35 per month. The City anticipates
that 20,000 Edmontonians will access the low income transit pass, including 4,800 disabled Edmontonians who
currently buy the discounted AISH transit pass. (Edmonton City Council, 2016, June 28).
For low income Edmontonians who need transit, purchasing a monthly pass will save them about $700 for a single
adult, and $1,400 per year for a two‐adult household where both adults purchase transit passes. These are the direct
20 | A P R O F I L E O F P O V E R T Y I N E D M O N T O N 2 0 1 7 U P D A T Ebenefits. There will also be less tangible benefits such as improved quality of life as money saved on paying for transit
can be used instead for other household expenses.
Road Map Action #19 involves providing free transit passes to vulnerable youth and adults through social agencies.
Implementation of this action is already underway. A pilot project by which 100 transit passes were distributed free
of charge to vulnerable youth is being expanded with an additional 500 transit passes for both youth and adults.
Distribution and oversight is being done by several community agencies serving vulnerable clients.
Many other actions in the EndPovertyEdmonton Road Map will without a doubt help reduce poverty as they are
implemented. The effects of actions like establishing a community development corporation and anti‐racism
initiatives are likely to be longer‐term rather than immediate.
THE ROAD MAP POVERTY REDUCTION TARGET
The Implementation Road Map has set a target of lifting 10,000 people out of poverty in five years, by 2021. Using
the After‐Tax Low Income Measure (LIM) with the most recent data from 2014 found 107,960 Edmontonians living in
poverty. With the qualification that the City plans to use a more holistic poverty reduction measure (not only an
income measure like LIM), this would be a reduction of about 9% in the number of Edmontonians living in poverty
(Statistics Canada, 2016h).
One of the challenges in measuring actual results achieved against the target is how much to attribute to the City’s
actions and policies, and how much to attribute to actors beyond the City of Edmonton. For instance, poverty rates
almost always go up when there is a downturn in the economy such as the one currently being experienced.
However, with all of the policy changes and social investments being made by all orders of government in child
benefits, employment tax credits, minimum wage increases, carbon levy rebates and low income transit passes, the
net overall result is likely to be a reduction in the number of Edmonton families with children living in poverty even in
the absence of further actions.
The federal government has calculated that its new Canada Child Benefit alone might reduce child poverty rates
nationally by 40%. Another analysis by the Canadian Centre for Policy Alternatives forecasts a much lower reduction,
more in the range of a 10% reduction (Press, 2016, December 22).
The child poverty reduction impacts of the Canada Child Benefit (benefiting both low and middle income families)
and the new Alberta Child Benefit (targeted to the lowest income families) will be partly known with the release of
2016 taxfiler data in mid‐2018, and fully known when 2017 taxfiler data is released a year later. Regardless, combined
with the Alberta Family Employment Tax Credit enhancements and other changes, the results of the reduction of the
34,220 Edmonton children living in poverty as well as on the number of families with children living in poverty are
likely to be substantial and more than off‐set increases caused by the economic downturn.
The poverty reduction outlook is less clear for low income single adults and childless couples. For most there is likely
to be some benefit from carbon levy rebates, minimum wage increases and low income transit passes. However,
without other actions, it is unclear whether these changes will be enough to offset the higher poverty rates caused by
the economic downturn.
21 | A P R O F I L E O F P O V E R T Y I N E D M O N T O N 2 0 1 7 U P D A T ECONCLUSION
The two years since ESPC published A Profile of Poverty in Edmonton have been challenging ones for the city of
Edmonton and its residents. From the autumn of 2014, when oil prices topped $100 US per barrel, there was a rapid
descent to the $30 to $40 US per barrel range. Oil prices have only crawled back into the $50 US per barrel range in
recent months. Alberta oil is priced at a significant discount to the above prices.
Job growth has slowed markedly and the final six months of 2016 have been marked by job losses exceeding new
jobs created. The number of Edmontonians needing to access employment insurance, social assistance, and using the
food bank are all up sharply. The number of people moving to Edmonton has also slowed, helping to make rents
somewhat more affordable. A higher vacancy rate and additional investment in affordable housing by the three
orders of government provides hope for continued progress in reducing the number of homeless Edmontonians.
So far, there have been no widespread reductions in public spending by any of the three orders of government,
further cushioning Edmonton’s economy from the recession that has more severely impacted Calgary and the rest of
Alberta. In fact, to counter the effects of the recession, infrastructure spending on major transportation, post‐
secondary, and healthcare projects has been growing. In addition, the federal and provincial governments are also
making significant new investments in social infrastructure including the enhanced Canada Child Benefit, the new
Alberta Child Benefit, provincial minimum wage increases, and affordable housing.
There is also evidence that, at the beginning of 2017, the Alberta economy has hit or is near the bottom. But any
recovery is likely to be slow and uneven. Most analysts don’t expect oil to get back to $100 per barrel any time soon,
perhaps not for a decade or more due to the United States shale oil revolution. This revolution in drilling technologies
has led to millions of additional barrels of oil per day flooding onto the global market. ATB Financial’s most recent
forecast is that, after contracting by 4% in 2015 and 2.6% in 2016, Alberta’s real GDP will grow by 2.1% in 2017 and
2.2% in 2018. The unemployment rate is not expected to improve until 2018 (ATB Financial, 2016).
Edmonton’s poverty reduction initiative—supported by investments made by other orders of government—has
gotten off to a promising start despite the strong economic headwinds the city has been facing. However, these
efforts are in the very early stages. There will no doubt be unexpected challenges that will have to be met and
overcome if the community’s goal of ending poverty in a generation is to be achieved.
22 | A P R O F I L E O F P O V E R T Y I N E D M O N T O N 2 0 1 7 U P D A T EREFERENCES
ATB Financial. (2016). Alberta economic outlook winter 2016/2017. Retrieved from
http://www.atb.com/SiteCollectionDocuments/About/Alberta‐Economic‐Outlook‐Winter20162017.pdf
Canada Mortgage and Housing Corporation. (2016, October). Rental market report Edmonton CMA. Retrieved
from https://www.cmhc‐schl.gc.ca/odpub/esub/64379/64379_2016_A01.pdf?fr=1484781550913
Capital Regional Housing. (2016). From the inside out: 2015 annual report. Retrieved from
http://crhc.ca/media/85248/capital‐region‐housing‐annual‐report‐2015.pdf
City of Edmonton (2016). Municipal Census. Retrieved from https://www.edmonton.ca/city_government/municipal‐
census.aspx?utm_source=virtualaddress&utm_campaign=census
City of Edmonton (2016, October). Economic outlook: Economic insights. Retrieved from
https://www.edmonton.ca/business_economy/documents/Economic_Update_October_2016.pdf
City of Edmonton (2017). End poverty Edmonton implementation road map. Retrieved from
https://www.endpovertyedmonton.ca/implementation/
Community of Lendrum Place. (2016). Capital regional housing: Lendrum redevelopment of Lendrum Manor &
Lendrum Villa. Retrieved from http://www.lendrum.org/crh‐lendrum‐redevelopment.html
Daly, Julian. (2016). Executive director Julian Daly guest editorial (Edmonton Journal). [Editorial]. Retrieved from
http://boylestreet.org/executive‐director‐julian‐daly‐guest‐editorial‐edmonton‐journal/
Edmonton City Council: City Council Minutes. (2016, June, 28). Low income transit pass – creative distribution
approaches – CR_3203. Retrieved from
http://sirepub.edmonton.ca/sirepub/agdocs.aspx?doctype=agenda&itemid=52014
Edmonton’s Food Bank. (2017). Personal communication via electronic mail.
Edmonton School Boards. (2016). Annual education results reports; Three year education Plan 2016‐2019 of
Edmonton Public Schools and Edmonton Catholic Schools.
Edmonton Social Planning Council. (2016a). More than minimum: calculating Edmonton’s living wage: 2016
update. Retrieved from http://edmontonsocialplanning.ca/index.php/news/espc‐news/265‐more‐than‐minimum‐
calculating‐edmonton‐s‐living‐wage‐2016‐update
Edmonton Social Planning Council. (2016a). Calculating Edmonton’s living wage: Other family types 2016 update.
Retrieved from http://edmontonsocialplanning.ca/index.php/news/espc‐news/285‐living‐wage‐2016‐update‐lone‐
parent‐and‐single‐adult
Edmonton Social Planning Council & Edmonton Community Foundation. (2016). Vital signs: We are all
immigrants. Retrieved from http://edmontonsocialplanning.ca/index.php/resources/digital‐resources/a‐espc‐
documents/a06‐newsletters/a06e‐vital‐signs/901‐vitalsigns‐2016
Government of Alberta. (2015). Income support caseload, Alberta. Retrieved from
http://open.alberta.ca/dataset/income‐support‐caseload‐alberta/resource/07b7a69b‐af57‐4227‐92ad‐2187959a0bf8
Government of Alberta. (2016a). Alberta labour force profiles – Indigenous people 2015. Retrieved from
https://work.alberta.ca/documents/labour‐profile‐indigenous‐people.pdf
Government of Alberta. (2016b). Fiscal plan 2016‐2019. Retrieved from
http://finance.alberta.ca/publications/budget/budget2016/fiscal‐plan‐complete.pdf
Government of Alberta. (2016c). Upcoming changes to minimum wage. Retrieved from
https://work.alberta.ca/employment‐standards/minimum‐wage.html
Government of Alberta. (2017). Edmonton nutritious food basket prices: Average weekly cost for Edmonton.
Retrieved from http://open.alberta.ca/publications/2725193
23 | A P R O F I L E O F P O V E R T Y I N E D M O N T O N 2 0 1 7 U P D A T EGovernment of Canada. (2016a). Canada – Admissions of permanent residents by province/territory and census
metropolitan area (CMA) of intended destination (Q3 2016 ranking), Q1 2014‐ Q3 2016.
Government of Canada (2016b). Canada – Admissions of Syrian Refugees by province/territory and census
metropolitan area (CMA) of intended destination and immigration category, November 4, 2015 – September 30, 2016.
Homeward Trust Edmonton. (2016). Edmonton point in time homeless count. Retrieved from
http://www.homewardtrust.ca/wp‐content/uploads/2016/12/2016‐Preliminary‐Homeless‐Count‐Numbers.pdf
McInturff, Kate, & The Canadian Research Institute for the Advancement of Women. (2016). The best and worst
places to be a woman in Canada 2016: The Gender Gap in Canada’s 25 Biggest Cities. Retrieved from
https://www.policyalternatives.ca/publications/reports/best‐and‐worst‐places‐be‐woman‐canada‐2015
Neufeld, Lydia. (2016, November 29). Number of homeless in Edmonton decreasing, latest count suggests.
Canadian Broadcast Corporation News. Retrieved from http://www.cbc.ca/news/canada/edmonton/homeless‐
edmonton‐count‐shelter‐homeward‐trust‐1.3872830
Public Interest Alberta. (2016). Nearly one in five employed Albertans earn low wages. Retrieved from
http://www.pialberta.org/nearly_one_in_five_employed_albertans_earn_low_wages.
Press, J. (2016, December 22). Liberal government oversold child benefit’s impact on poverty rates, documents
suggest. National Post. Retrieved from http://www.nationalpost.com/m/wp/news/canada/canadian‐
politics/blog.html?b=news.nationalpost.com/news/documents‐raise‐questions‐about‐child‐benefits‐impact‐on‐
poverty‐rates
Statistics Canada. (2013). NHS profile, Edmonton, CMA, Alberta, 2011. Retrieved from
http://www12.statcan.gc.ca/nhs‐enm/2011/dp‐pd/prof/index.cfm?Lang=E
Statistics Canada. (2014). Survey of labour income and dynamics (SLID) masterfile. [Custom Tabulations].
Statistics Canada. (2015). Annual income estimates for census families and individuals (T1 family file): Family
data: User's guide. Retrieved from http://communitydata.ca/sites/default/files/sc_t1ff_f_guide_en.pdf
Statistics Canada. (2016a). Family characteristics, by family type and sources of income, annual. CANSIM
Table 111‐0014.
Statistics Canada. (2016b). Family characteristics, low income measures (LIM), by family type and family type
composition, annual (number unless otherwise noted). CANSIM Table 111‐0015.
Statistics Canada. (2016c). Neighbourhood income and demographics, taxfilers and dependents with after‐tax
income, by sex and age group, annual (number unless otherwise noted). CANSIM Table 111‐0043.
Statistics Canada. (2016d). High income trends of taxfilers in Canada, provinces and census metropolitan areas
(CMA), specific geographic area thresholds, annual. CANSIM Table 204‐0002
Statistics Canada. (2016e). Census program release schedule. Retrieved from
https://www12.statcan.gc.ca/census‐recensement/2016/ref/release‐dates‐diffusion‐eng.cfm.
Statistics Canada. (2016f). Annual income estimates for census families and individuals (T1 family file) – Family
data, user guide. Retrieved from http://www23.statcan.gc.ca/imdb/p2SV.pl?Function=getSurvey&SDDS=4105
Statistics Canada. (2016g). Median age by census metropolitan area, July 1, 2015, chart 1.4. Retrieved from
http://www.statcan.gc.ca/pub/91‐214‐x/2016000/section01‐eng.htm (accessed 01/26/17).
Statistics Canada. (2016h). Table F‐18 family data ‐ After‐tax low income (based on after‐tax low income
measures, LIMs), 2000 to 2014. [Custom Tabulations].
Statistics Canada. (2017a). Employment Insurance program (EI), number of disqualifications and disentitlements
by province and reason, unadjusted for seasonality, monthly (persons). CANSIM Table 204‐0033
24 | A P R O F I L E O F P O V E R T Y I N E D M O N T O N 2 0 1 7 U P D A T EYou can also read