SASOL LIMITED Investor Fact Sheet - Lake Charles Chemicals Project 23 August 2016
←
→
Page content transcription
If your browser does not render page correctly, please read the page content below
SASOL LIMITED
Investor Fact Sheet – Lake Charles Chemicals Project
                                     23 August 2016
Purpose
The purpose of this document is to:
▪▪ provide an overview and further context on Sasol’s world-scale ethane cracker and derivatives unit, currently under construction
    near Lake Charles, Louisiana in the United States (US);
▪▪ highlight and provide further insight into the value contribution build-up of the different product ranges from the Lake Charles
    Chemicals Project (LCCP) project; and
▪▪ create an understanding of how Sasol views the key drivers and value creation of the LCCP.

Although we expect a wide range of stakeholders to read this document, it has primarily been prepared to enable Sasol shareholders
and investors to understand and assess the value contribution of the LCCP.

Updating of project fact sheet
This fact sheet will in future be updated as and when appropriate. Key project progress measures will in future be provided to the
market on a regular basis as part of the Sasol’s quarterly Business Performance Metrics reporting. We also need to draw the readers’
attention to the cautionary note regarding forward-looking statements contained below.

 Table of contents:
 1.     Executive summary                                                                                          1
 2.     Project overview                                                                                           3
 3.     Sasol investment rationale                                                                                 5
 4.     Project review                                                                                             6
 5.     Project schedule                                                                                           7
 6.     Capital expenditure                                                                                        8
 7.     Project funding                                                                                            9
 8.     LCCP - feedstock and product pricing view                                                                 10
 9.     Additional project-related information                                                                    12
 10.    Project returns and sensitivities                                                                         12

FORWARD-LOOKING INFORMATION
Disclaimer – Forward-looking statements: Sasol may, in this document, make certain statements that are not historical facts and relate to analyses and other
information which are based on forecasts of future results and estimates of amounts not yet determinable. These statements may also relate to our future
prospects, developments and, business strategies and industry dynamics including commodity prices. Examples of such forward-looking statements include, but
are not limited to, statements regarding anticipated capital expenditure, project completion schedule, availability of funding, impact on gearing ratio and projected
returns of our LCCP project, as well as commodity prices, exchange rate fluctuations, volume growth, increases in market share, total shareholder return, executing
our growth projects and cost reductions, including in connection with our BPEP and RP. Words such as “believe”, “anticipate”, “expect”, “intend”, “seek”, “will”, “plan”,
“could”, “may”, “endeavour”, “target”, “forecast” and, “project” and “confident” and similar expressions are intended to identify such forward-looking statements, but
are not the exclusive means of identifying such statements. By their very nature, forward-looking statements involve inherent risks and uncertainties, both general
and specific, and there are risks that the predictions, forecasts, projections and other forward-looking statements will not be achieved. If one or more of these risks
materialise, or should underlying assumptions prove incorrect, our actual results may differ materially from those anticipated. You should understand that a number
of important factors could cause actual results to differ materially from the plans, objectives, expectations, estimates and intentions expressed in such forward-
looking statements. These factors are discussed more fully herein and in our most recent annual report on Form 20-F filed on 9 October 2015 and in other filings with
the United States Securities and Exchange Commission. The list of factors discussed therein is not exhaustive; when relying on forward-looking statements to make
investment decisions, you should carefully consider both these factors and other uncertainties and events. Forward-looking statements apply only as of the date on
which they are made, and we do not undertake any obligation to update or revise any of them, whether as a result of new information, future events or otherwise.

    Sasol LCCP Investor Fact Sheet 2016
1. EXECUTIVE SUMMARY
Introduction
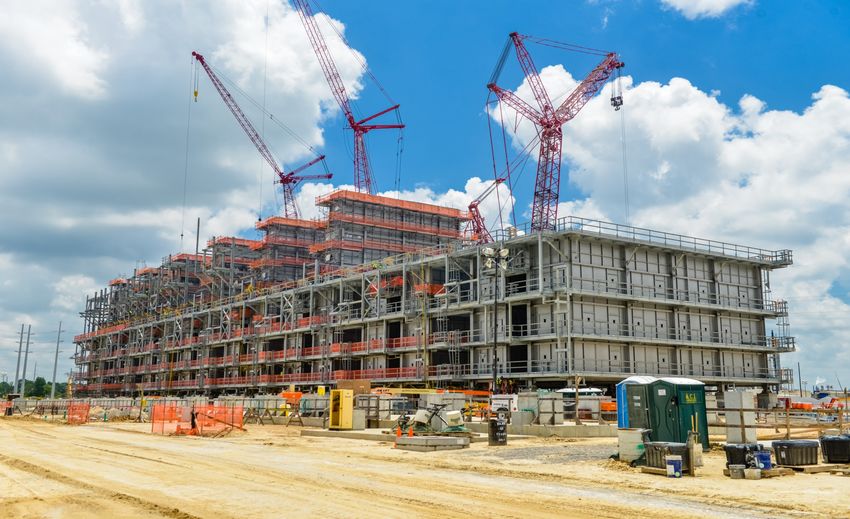
The Lake Charles Chemical Project (LCCP) consists of a world-scale 1,5 million ton per year ethane cracker, and six downstream
chemical units which is currently under construction near Lake Charles, Louisiana in the USA, adjacent to Sasol’s existing chemical
operations. At 30 June 2016, the capital expenditure to date on LCCP was $4,8 billion, and the overall project completion was
around 50%.
Key project metrics
Total project output capacity 1,77 mtpa
Ethane consumption 100,000 bpd
Ethylene production 1,54 mtpa
First unit beneficial operation 2nd half CY2018
Total project beneficial operation 2nd half CY2019
Capex spent to date (30 June 2016) US$4,8 billion
Total project capex US$11,0 billion
EBITDA from all derivative products (full run rate – year 6) US$1 380m – US$1 480m per annum
Review outcome
Sasol has now completed its detailed review of the LCCP and has confirmed that a high degree of certainty exists over the updated
capital cost estimated at $11 billion. This is an increase of $2,1 billion from the original estimate at the time of final investment
decision (FID) in October 2014 and can be reconciled as follows:
FID cost estimate (October 2014) US$8,9 billion
Increase in the site and civil costs US$750 million ▪▪ Further groundwork due to poorer than anticipated
subsurface conditions compared to FID estimates
▪▪ Significant weather delays (c. 50% more rain days than
the 10-year average)
▪▪ Conscious decision to avoid schedule delays and proceed
with out-of-sequence site preparation activities, while
waiting for a variation of permit conditions to be granted
Increase in EPCM contractor costs US$680 million ▪▪ Increase in contractor wage rates compared to the FID
estimate
▪▪ Increase in contractor engineering hours due to increases
in material quantities
▪▪ Lower engineering productivity during the development
of the utilities, off-site and infrastructure detailed design
and materials procurement management processes
Increase in total labour cost US$670 million ▪▪ Additional materials due to lower FID estimates than final
engineering estimates
▪▪ Conscious decision to utilise higher skilled labour mix to
enable planned productivity improvements
▪▪ Lump sum contracts were placed at higher labour rates
Current cost estimate including US$11 billion ▪▪ The estimate has been confirmed by a third party
contingencies assurance provider and the contingency is considered
sufficient when measured against industry norms for this
stage of project completion.
The schedule for LCCP remains the same as previously communicated. The first unit, the linear low-density polyethylene unit, is
expected to achieve beneficial operation in the second half of calendar year 2018, which will be followed by the ethane cracker and
ethylene oxide and mono ethylene glycol units later that year, with the low-density polyethylene unit shortly thereafter. This will
result in over 80% of the total output from LCCP reaching beneficial operation by early 2019. The remaining derivative units will
reach beneficial operation by the second half of 2019.
Sasol LCCP Investor Fact Sheet 2016 1The LCCP funding strategy has not changed as a result of the higher capital expenditure estimates and Sasol does not expect to
exceed its self-imposed gearing ceiling which is well below the gearing maintenance ratio covenant of 2,5 times, which Sasol is
subject to in certain of its corporate funding agreements.
Remedial action taken to deliver successful execution of the LCCP
Several changes have been, or are in the process of being, implemented to ensure that the project has a good probability of being
completed within the updated cost and schedule guidance. Some of the key actions implemented are as follows:
▪▪ Key project management changes on both sides, including deployment of three experienced Sasol project personnel to oversee
engineering, procurement and construction have been effected;
▪▪ Improvement of the control base management process and associated change management process;
▪▪ Improvement in managing work packages to ensure first quintile productivity for the remainder of the project; and
▪▪ Realignment of contracting strategies to ensure that the desired level of cost and productivity is achieved.
In addition, the site and civil work is now complete and the operations are less exposed to adverse weather.
Why we do not expect further cost overruns
At 30 June 2016, the overall project completion was around 50%, with engineering around 85% complete, procurement of
equipment almost 100% committed, and bulk materials procurement around two-thirds committed. In addition, fabrication of
the modules and piping spool pieces is well advanced, with site, civil and concrete work nearing completion, resulting in overall
construction progress around 15% complete. This, together with the detailed review process described above, results in a high
degree of certainty for the cost and schedule provided by the review.
We communicated in June 2016 that we were confident that we could reduce the project costs from the upper end of the range
which was communicated as $11 billion. We are now working off a $11 billion project cost as base case having built in sufficient
contingencies to have a high degree of certainty that we can avoid further cost overruns. Notwithstanding the current cost
estimate, various other savings opportunities have been identified to mitigate the increase in the overall capital cost estimate.
Why we believe LCCP remains an attractive investment
Despite the current cost estimate of $11 billion, we still consider the LCCP to be a sound strategic investment that is of significant
importance to Sasol’s future growth and will return value to our shareholders for many years into the future. LCCP will transform
the existing Lake Charles site into an integrated, multi-asset site that will allow fixed and infrastructure costs to be spread over
multiple product lines, and provide opportunities for investment in additional downstream chemical facilities in the future.
Further benefits include:
▪▪ Project returns over the remaining construction period remain in excess of our hurdle rate;
▪▪ The attractive position of the LCCP on the global ethylene cost curve places LCCP in a competitive position to successfully
weather market volatility;
▪▪ Production of low-cost polyethylene produced from the two new, large polyethylene facilities that make use of world-class
technology;
▪▪ Improving earnings stability throughout commodity chemical cycle;
▪▪ Anticipated margin expansion through securing long-term supply and removing offsite toll-processing;
▪▪ Anticipated earnings growth as technology and application development drive the transition from lower to higher value
products;
▪▪ Full value chain integration with the existing ethoxylation units at Lake Charles; and
▪▪ Allowing for further LCCP expansion or other site specific investment opportunities in future.
2 Sasol LCCP Investor Fact Sheet 20162. PROJECT OVERVIEW
The LCCP consists of a world-scale 1,5 million ton per year ethane cracker, and six downstream chemical production facilities –
two large polymers plants (low-density and linear low-density polyethylene) and an ethylene oxide/ethylene glycol plant, which
together will consume around two thirds of the ethylene produced by the cracker; and three smaller, higher-value derivative
plants, which will produce specialty alcohols, ethoxylates and alumina products. The project is under construction near Lake
Charles, Louisiana in the USA, adjacent to Sasol’s existing chemical operations. Sasol’s existing operational footprint at this site
consists of a 455 ktpa cracker and several other petrochemical units. The scale of the new LCCP facility coupled with the additional
infrastructure, civil works and site preparation required, characterises the project as a greenfield expansion. Sasol has selected
Fluor Technip Integrated (FTI) a joint venture of Fluor and Technip, as the primary engineering, procurement, and construction
management (EPCm) contractor for this project.
The LCCP is structured along four product groupings, as reflected below:
▪▪ Ethylene oxide (EO) value chain: ethylene oxide, mono ethylene glycol (MEG), and ethoxylates (ETO);
▪▪ ZAG: Ziegler alcohols, Alumina and Guerbet alcohols;
▪▪ Polyethylene (PE): Linear low-density polyethylene (LLDPE) and low-density polyethylene (LDPE); and
▪▪ Ethylene.
The estimated external supply volumes for these product groupings are shown in the table below.
Grouping Asset Demand External sales
EO value chain EO/EG EO to existing on-site ethoxylation plants 380 ktpa*
MEG to merchant market
ETO Merchant market
ZAG Ziegler Merchant market 160 ktpa
Alumina Merchant market
Guerbet Merchant market
Polyethylene LLDPE Merchant market 900 ktpa
LDPE Merchant market
Ethylene JV and merchant market 330 ktpa
*Includes EO supply to existing ethoxylation facilities.
The EO value chain consists of a 300 ktpa crude EO unit with hydrolysis and purification capacity, and 100 ktpa of ethoxylation
capacity. Production of purified EO will displace external purchases used to feed the current ethoxylation units, as well as feeding
the new ethoxylation units, with hydrolysis to ethylene glycol consuming the remainder of the production. The ethoxylation unit
(100 ktpa) supplements existing capacity on site, as well as production capacity in Europe and China.
The Ziegler alcohol unit (173 ktpa) supplements existing capacity on site and adds to Sasol’s global production of alcohols. The
output will be used both for feedstock to derivative units and sales to the merchant market. Alumina (30 ktpa) supplements
existing capacity on site and Europe. Guerbet alcohols are currently produced in Sasol’s European operations, and the new 30 ktpa
unit will add to Sasol’s global production capacity.
The polyethylene plants will collectively be capable of producing up to 900 ktpa of LDPE and LLDPE depending on product slate. Sasol
currently manufactures both LDPE and LLDPE in South Africa, and additional LDPE in its joint venture with Petronas in Malaysia.
The remaining ethylene will supply Sasol’s share of its joint venture with Ineos in Texas that will produce HDPE (50% shareholding
in Gemini HDPE), with the balance being sold to the merchant market.
Sasol LCCP Investor Fact Sheet 2016 3The various process units, product groupings and capacities are illustrated in the process flow schematic below.
MEG
Oxygen
Ethylene
oxide EO value chain
(380ktpa)1
PEO
External Ethoxylates
alcohol
Guerbet
Ethane alcohols ZAG2
100 000 bpd
Ethylene Ziegler (160ktpa)
ETHANE 1,54 mt
CRACKER Alumina
LLDPE
1-Hexene Polyethylene
1-Octene (900ktpa)
LDPE
Ethylene to Gemini
joint venture
(220ktpa)
Merchant ethylene
(110ktpa)
Product groupings
EO value chain ZAG2 Polyethylene
1
External sales and transfers to existing operation. 2
Zieger Alumina Guerbet external sales.
The new production from LCCP will be reported in Sasol’s business segments as follows:
Base Chemicals
Sales of polyethylene will be reported in the Base Chemicals segment.
Performance Chemicals
The LCCP adds capacity to Performance Chemicals product volumes that are already produced and sold by Sasol on both a regional
and global basis. The ethylene, Ziegler alcohol, and ethoxylation plants add to capacity of existing units in Lake Charles. The
Guerbet alcohol plant supplements existing production capacity in Brunsbüttel, Germany. The EO/MEG plant completes integration
of the ethoxylate value chain. Sales of products in the EO value chain and the specialised ZAG products will be reported in the
Performance Chemicals segment.
4 Sasol LCCP Investor Fact Sheet 20163. SASOL INVESTMENT RATIONALE
Currently, most of Sasol’s chemical production facilities are located in South Africa, Europe and at the Lake Charles site in Louisiana
in the USA. The change in the dynamics of the ethane supply situation in North America provided an opportunity for Sasol to
invest in a world-scale ethane cracker that could be supplied with abundant, low-cost feedstock, which would be sited in a location
with robust infrastructure and easy access to both US and international markets. In October 2014, Sasol took a decision to proceed
with the construction of the LCCP, which is located adjacent to Sasol’s existing chemical operations near Lake Charles.
This investment will transform Sasol’s Lake Charles site into an integrated, multi-asset site that will allow fixed and infrastructure
costs to be spread over multiple product lines, and provide opportunities for investment in additional downstream chemical facilities
in the future. This facility is expected to benefit from a cost position in the lower quartile of the global ethylene cost curve.
The LCCP investment also provides the opportunity for full value chain integration of the existing units. The EO facility will replace
EO that is currently toll-processed offsite, thus reducing costs and securing the long-term supply of EO for these units, and
achieving full vertical integration of the existing ethoxylation units.
Sasol’s Base Chemicals segment is expected to benefit from the LCCP’s first quartile position on the global ethylene cost curve,
and low-cost PE produced from the two new, large PE facilities that make use of world-class technology, allowing growth for this
segment into existing and new markets.
The specialty products from LCCP that form part of Sasol’s Performance Chemicals segment are intended to provide stability to
mitigate the impact of the commodity chemicals cycle, improving earnings stability. Some of these products will be manufactured
using Sasol’s own technology, and build on existing global product lines where the company has over 30 years of market
experience. Earnings are expected to continue to grow after full rate operation, as technology and application development drive
the transition from lower to higher value markets.
The various downstream units that form part of the LCCP result in merchant ethylene sales being minimised, and positions Sasol
for future debottlenecking and expansion opportunities that will take advantage of the new infrastructure being constructed at
the LCCP site.
Investment differentiation from competitors
Sasol believes that the LCCP has a much greater diversity of product slate, technology and targeted end-use markets than most
of the other cracker projects being constructed on the US Gulf Coast. Similar projects under construction are committed almost
exclusively to commodity plastics and ethylene glycol. Sasol’s diversified and differentiated product slate allows it to participate in
numerous markets, many of which are insulated from traditional chemical cycles. This should result in stable earnings across the
life of Sasol’s project.
This is illustrated in the figure below, which compares the EBITDA breakdown by product group from Sasol’s LCCP to the average
of the large-scale crackers currently under construction in the US Gulf Coast, which are much more focused on polymers and
MEG products.
Sasol Cracker EBITDA by Product Group USGC Cracker EBITDA by Product Group
20% 20%
2%
EO value chain Speciality
50%
ZAG EO/EG
PE 78% PE/PVC
30%
Note: The figure above is based on internal company estimates, based on published derivative unit capacities of the world-scale ethane crackers
under construction in the US Gulf coast.
In addition to the anticipated contribution to earnings stability, Sasol’s unique derivatives add significantly higher value for each
ton of ethylene consumed.
Sasol LCCP Investor Fact Sheet 2016 5The diagram below demonstrates the projected incremental value added from the polyethylene, EO and ZAG value chains versus
merchant ethylene sales.
Uplift Over Ethylene
EBITDA per ton ethylene
Merchant ethylene
PE
EO value chain
ZAG
Project year
In the figure above, merchant ethylene EBITDA per ton has been indexed to 100. The EBITDA/ton for each of the three product
groupings is then shown on a relative basis versus merchant ethylene in order to illustrate the value added by these products.
Ramp-up strategy and approach
The initial products introduced to the market will be the large volume commodities: ethylene, PE, and MEG. Though lower in
unit margin, these products allow for an efficient start-up of the LCCP complex, immediately add value, and displace purchased
feedstock in the existing operation.
The next phase will include Ziegler alcohol and alumina, initially focused on large volume merchant markets. Coordination of these
new units with the existing plants is expected to synergistically enhance value by reducing working capital, fixed costs, and supply
chain costs.
The last phase consists of the full ramp-up and utilisation of specialty Guerbet alcohol and ethoxylates in high margin applications.
After full rate operation project earnings are expected to continue to expand as Performance Chemicals shifts product from lower
to higher value applications. As EO demand grows with the ethoxylate business, MEG production will transition to higher value
purified EO. Ongoing technology and applications development are anticipated to pull alumina and Guerbet alcohols into new high
margin markets. Finally, as these differentiated businesses grow, Ziegler alcohols will continue to shift to higher value derivatives.
4. PROJECT REVIEW
The detailed review of the LCCP was initiated by Sasol in March 2016, following the decision to pace the execution of the project
to support the company’s low oil price Response Plan. At the time, Sasol stated that the overall end-of-job project cost estimate
remained under pressure. Reviews of this nature are not uncommon in large megaprojects, and are carried out once the
engineering is substantially complete. This provides a consistent baseline and material and quantity information, which can be
compared against that assumed during the preparation of the original estimate.
The LCCP project review involved the detailed evaluation and quantity verification of over 60 000 individual line items. This was
carried out by a team of experienced personnel from Sasol, Fluor and Technip, drawn from various disciplines including project
management, project controls, procurement, engineering and construction. Another team, separate from the review team, was
also established to independently verify the accuracy and completeness of the design and quantities.
Once the quantities and specifications of each line item had been verified, pricing and unit installation rates were reviewed,
drawing on the actual procurement costs for LCCP and the actual field construction productivity factors obtained to date during
LCCP execution. These were also benchmarked against previous and current US Gulf Coast projects.
An optimised execution strategy was developed, again drawing from the experience gained to date in the execution of the LCCP.
This information was used to develop an updated estimate for LCCP. A probabilistic risk analysis was carried out at a discipline line
item level, which resulted in an estimate of the capital cost to be spent, together with an estimate of the contingency allowance
required for completion of the project with a high level of certainty.
6 Sasol LCCP Investor Fact Sheet 2016Independent third parties then reviewed the completeness of the review and estimate process, and confirmed that the process
followed was complete and correct.
The review process has shown that there is an increase in the site and civil costs of around $750 million. This is due to further
ground works required to establish the site compared to what was estimated at FID as a result of poorer than anticipated
subsurface conditions. Geotechnical studies were carried out prior to FID. However, these did not reveal the full extent of the poor
ground conditions until site preparation was further advanced, resulting in the need to remove substantially more ground than
initially estimated. In addition, significant weather delays were experienced, with approximately 50% more rain days occurring
than the 10 year average. A conscious decision to avoid schedule delays and proceed with out-of-sequence site preparation
activities while waiting for a variation of permit conditions to be granted also led to additional costs. With site and civil works
substantially completed, management is focused on using these learnings to optimise on the execution of other areas of the
project going forward.
The home office and construction costs of the EPCm have increased by around $680 million, mainly as a result of an increase in
contractor wage rates compared to the estimate, lower engineering productivity during the development of the utilities, off-site
and infrastructure detailed design and materials procurement management processes, and an increase in contractor engineering
hours, as a result of increases in material quantities. Systems integration difficulties and inefficiencies relating to procurement by
the contractor also resulted in materials not always being available at the construction site when required. Sasol’s management
has now initiated a work face planning process to improve this going forward.
The total labour cost is expected to increase by around $670 million. This increase is largely due to the additional quantities of
materials that need to be installed, resulting in an increase of around $200 million in the total labour cost. Management has taken
the decision to utilise a higher skilled crew mix to enable planned productivity improvements on the project, which has led to an
increase of around $350 million in the total estimated labour cost. These labour rates and crew mixes have been independently
benchmarked as being market related for the region. In addition, lump sum contracts were placed at higher labour rates than
estimated.
The review has also found that the project control base management system can be improved, which will result in a more
effective, efficient and earlier detection of deviations from the control base, as well as the associated change management
required. Management has subsequently implemented various risk and change management mitigating actions that will enhance
preventative controls and optimise the project execution going forward.
Further key mitigating actions include, but are not limited to, key project management changes on both sides, including the
deployment of three experienced Sasol project personnel to oversee engineering, procurement, and construction, improvement
in managing work packages to ensure first quintile productivity for the remainder of the project and realignment of contracting
strategies to ensure that desired levels of cost and productivity are achieved.
The updated LCCP estimate includes a contingency allowance which is expected to be sufficient to effectively take the project to
beneficial operation. Given that the project is around 50% complete and many of the risks that existed at the time of FID have
since been reduced or removed, the updated estimate includes a lower contingency allowance. Note that the increased costs listed
above are net of the change in contingency allowance.
At 30 June 2016, the overall project completion was around 50%, with engineering around 85% complete, procurement of
equipment almost 100% committed, and bulk materials procurement around two-thirds committed. In addition, fabrication of
the modules and piping spool pieces is well advanced, with site, civil and concrete work nearing completion, resulting in overall
construction progress around 15% complete. This, together with the detailed review process described above, results in Sasol
being confident that a high degree of certainty for the cost and schedule provided by the review.
Unplanned event-driven risks, such as abnormal weather, hurricanes, wind delays etc, which could either impact construction
activities or the delivery of materials, equipment and modules to the site, are not included in the estimate. However, given that the
site and civil works, and thus the site drainage and paving, are nearly completed, the impacts of abnormal weather are able to be
better managed.
5. PROJECT SCHEDULE
The slower rate of capital spend until June 2018, due to Sasol’s low oil price Response Plan, coupled with project delays experienced
in developing the site infrastructure resulted in an extended project schedule. Based on the outcome of the detailed project review it
is now planned that the first unit, the linear low-density polyethylene (LLDPE) unit, is projected to achieve beneficial operation early
in the second half of calendar year 2018. This will be followed by beneficial operation (BO) achieved on the ethane cracker and EO/EG
unit later that year, and the low-density polyethylene (LDPE) unit early in calendar year 2019*. The remaining volumes from the other
derivative units are expected to reach beneficial operation by the second half of 2019.
Sasol LCCP Investor Fact Sheet 2016 7Overall progress of the project continues with no scope changes and management remains confident in delivering against the
revised schedule.
The LCCP beneficial operation schedule can be summarised as follows:
Final investment decision (FID) October 2014
Linear low-density polyethylene unit BO 2nd half CY2018
Ethane cracker BO 2nd half CY2018
Ethylene oxide/ethylene glycol BO 2nd half CY2018
Low-density polyethylene unit BO early 1st half CY2019
Zeigler and Guerbet alcohols, ethoxylation BO 2nd half CY2019
* The schedule above implies that over 80% (330 ktpa ethylene, 900 ktpa PE and 280 ktpa of the EO value chain) of the total 1,77 mtpa output from
LCCP will have reached beneficial operation early in the 1st half of 2019.
6. CAPITAL EXPENDITURE
Following the detailed review of the cost estimates for the LCCP, we confirm that the overall end-of-job capex estimate is
estimated at $11,0 billion. This includes the once-off infrastructure costs to convert a large greenfields site into an integrated,
multi-asset site similar to Sasol’s Secunda operations in South Africa. The infrastructure costs for the LCCP site include the costs
associated with land acquisition, permitting, site clearing and preparation. The costs of the integrated project management team,
are also included in the project estimate.
The amount of contingency included in the estimate is based on the risks associated with the remaining work, and was calculated
on the basis that it provides a high degree of certainty for the total project cost estimate. The contingency was evaluated by the
independent project advisor and benchmarked against their experience with similar projects in comparable stages of completion.
They concluded that the contingency was sufficient, given the improvements to the project management and control system that
Sasol has implemented, which reduce the project’s risk profile.
The approximate split of the capex for the various units is shown in the table below:
Capital component with UOI**
Units Capital component breakdown* allocated
Ethane cracker $3,0 billion $4,3 billion
Base Chemicals (Polyethylene) $1,8 billion $2,6 billion
Performance chemicals (EO value chain and ZAG) $2,8 billion $4,1 billion
Utilities and offsites $1,8 billion
Infrastructure $1,6 billion
Total cost $11,0 billion $11,0 billion
*Includes contingencies and owners cost allocated to assets.
** Utilities, offsites and infrastructure.
8 Sasol LCCP Investor Fact Sheet 2016The LCCP’s expected capital cash flow requirements, taking into consideration Sasol’s low oil price Response Plan requirements,
can be summarised as follows:
Capitalised pre-FID expenditure $0,6bn
Cumulative capital expenditure as at 30 June 2016 $4,3bn*
Projected capital expenditure (cash flow) FY17 – $3,3bn
FY18 – $2,5bn
FY19 – $0,9bn
* Capital expenditure cost flow of $4,8bn.
7. PROJECT FUNDING
In order to mitigate the risk of the funding requirement of the LCCP to Sasol, a project-based loan facility was put in place to
partially fund the LCCP. This project-based loan is for a maximum amount of US$4 billion, with a final maturity date seven years
from inception in December 2014. The loan bears interest at a variable, LIBOR-based interest rate. Note that 50% of this loan
facility was swapped to a fixed interest rate of 2,7%.
The balance of the funding requirement of the LCCP is intended to be funded from Group resources through intra-group loans to
and equity investment in the LCCP. Sasol makes use of a Central Treasury function to optimise its cash management and interest
expenses. Due to the practical constraints of managing cash flows in multiple currencies, in multiple jurisdictions, and in multiple
legal entities, Sasol carries a significant cash balance. The free cash flow from Group operations includes a significant dollar and
euro component (equivalent to approximately $2,5 billion in cash held offshore from our existing international operations) which
will be utilised in the funding of the LCCP. The funding of the Central Treasury function is supplemented by loans and loan facilities
at a Group level as required from time to time, which includes the proceeds from the $1,5 billion Revolving Credit Facility (maturing
CY2021) and the current $1 billion bond (maturing in CY2022).
US$ billion
Capital cost – LCCP 11,0
Uses of funds 11,0
Debt 7,0
Project-specific bank term loan* 4,0
Intra-group debt – subordinated shareholders loan** 3,0
Equity contribution to the project 4,0
Total sources of funds 11,0
* Bank term loan, which matures in December 2021 and is priced at a spread over US dollar LIBOR of 2,25%. Interest rate swap in place to fix rate for
50% of loan facility.
**Relates to a loan between the LCCP and the Sasol Central Treasury, funded from the Group pool of funds.
Although the capital expenditure for LCCP has increased, Sasol does not expect this to result in it exceeding the self-imposed
gearing ceiling, which is well below the gearing maintenance ratio covenant of 2,5 times which Sasol is subject to in certain of its
corporate funding agreements. Sasol is continuing with its previously announced low oil price Response Plan, and will manage its
balance sheet to incorporate the current estimated capital expenditure. The funding strategy has not changed as a result of the
higher capital expenditure estimates.
Interest during construction is not included in the $11bn capital cost estimate.
Working capital
The net working capital investment required is around 10 to 12% of the LCCP’s revenue, which is not included in the $11bn capital
cost estimate.
Sasol LCCP Investor Fact Sheet 2016 98. LCCP – FEEDSTOCK AND PRODUCT PRICING OUTLOOK
Ethane
We expect ethane demand to increase significantly over the next five years, with ethane pipeline exports, terminals for waterborne
exports and crackers, under construction.
By 2022, nine new crackers are expected to eventually consume 670 000 barrels per day (bpd) of ethane. In addition, around
320 000 bpd of exports are expected.
The ethane price is thus expected to rise, to cover extraction and logistics costs to the Gulf Coast.
The range of future ethane prices predicted by external advisors (Nexant, Wood Mackenzie and IHS) for different time periods is
as follows:
FY17 – FY21 average FY22 – FY26 average FY27 – FY37 average
(real c/gal*) (real c/gal) (real c/gal)
Ethane price 30 – 40 35 – 60 50 – 75
*US cents per gallon.
Sasol’s ethane price assumption for LCCP is in line with the ranges shown above.
The LCCP cracker is projected to produce 1,54 million tons/year of ethylene, and will consume around 100 000 bpd of ethane.
Base Chemicals
Ethylene
Global demand for ethylene is about 150 mtpa currently, growing at the equivalent of about four world-scale crackers per year.
Eight new US ethane crackers have taken FID and are scheduled to come online during the period to 2019, which is likely to place
downward pressure on US ethylene prices.
For the last three decades, the US ethylene market has been structured such that there is sufficient downstream derivative
capacity to consume all the merchant ethylene and this allows the US crackers to operate at full capacity, if required. The new US
ethane cracker complexes coming online are forecast to cause an overcapacity of US merchant ethylene in the FY19–21 period
approximately, as inadequate derivative capacity is likely to come online.
It is very likely that this anticipated oversupply of merchant ethylene will result in lower ethylene prices until more derivative
capacity comes online to consume the excess ethylene. As a result, the US ethylene price is likely to trade near its floor value. In the
longer term, the prices of ethylene and polyethylene are likely to be set by reinvestment costs of new Asian naphtha crackers and
are expected to follow oil price trends due to the oil-naphtha link.
Based on these assumptions, we estimate that the earnings before interest, tax, depreciation and amortisation (EBITDA) for the
ethylene products may develop as follows:
Ethylene Year 1 Full run rate – Year 3
Merchant volumes ktpa 200 110
Gemini JV volumes ktpa 220 220
EBITDA, USD million* 180 – 200 160 – 180
*Nominal.
Polyethylene (PE)
Western European crackers and PE plants are anticipated to face competition from increased PE exports as the US crackers come
online. Thus, European PE prices are likely to experience some downward pressure as new US ethane crackers come online and
start increasing exports. In other regions, PE prices are likely to track oil price trends, driven by naphtha feedstock (the price of
which is linked to oil price) cost pass through to polymer prices.
Major polyethylene investments in North America (NA) will change the global supply balance as investments there are expected to
continue to be cost advantaged, similar to Middle Eastern PE investments, compared to other global regions. These investments
will change the NA export PE market from a spot business to a strategic business that will require NA producers to become globally
focused. Although PE prices in the US are expected to compress in the short term, prices are expected to rebound by 2020 and
with the low ethane prices, integrated margins are expected to be above historical averages. Possible project delays for both the
new cracker investments and PE plants in NA are also expected to support higher margins.
10 Sasol LCCP Investor Fact Sheet 2016Based on these assumptions, we project that the EBITDA for the PE products may develop as follows:
Year 1 Full run rate – Year 3
PE Volumes ktpa 470 880
EBITDA, USD million* 200 – 220 630 – 650
*Nominal
Performance Chemicals
Performance Chemicals participates in many differentiated markets where success results from close collaboration with the
customer. This results in existing products being enhanced and new products being developed. Over time, margins are expected to
expand from higher value products, and the creation of new markets that are likely to pay for the performance of these speciality
products. This is expected to result in long-term bottom line growth in excess of inflation. Examples include surfactants for oil and
gas recovery and alumina for abrasives, performance additives, and catalysts. Upside potential exists for faster ramp-up of the ZAG
units compared to the current baseline assumptions.
Sasol is the largest and most diversified global producer of C6+ alcohols, and operates alcohol plants based on a number of
technologies and feedstocks in US, Europe, South Africa, and Asia. Sasol also has a global presence in ethoxylation with existing
capacity in Europe and China.
Sasol has diversified feedstocks, uses a range of licensed and its own technologies, and produces a broad slate of alcohols, which
are summarised in the table below.
ALCOHOL FEEDSTOCK, TECHNOLOGY AND PRODUCT SLATE COMPARISON
FEEDSTOCK TECHNOLOGY PRODUCTS
C16-C17-Semi Linear
C12-C15-Semi linear
Tailor-made blends
C9-C11-Semi linear
C12-C32-Guerbets
C12-C15-Branched
C7-C9-Semi linear
C9-C11-Branched
Single fractions
Hydrogenation
C18-C22-Linear
C16-C18-Linear
C12-C16-Linear
C8-C10-Linear
C8-Branched
Natural Oils
C6-Linear
Kerosene
Ethylene
Coal/Gas
Guerbet
Ziegler
C20+
Oxo
Sasol
Competitor 1
Competitor 2
Competitor 3
Competitor 4
The additional alumina capacity associated with the Ziegler alcohol unit will allow Sasol to further grow its alumina business in
the existing global specialty alumina markets, as well as into new markets for alumina-based products that are currently under
development. The current alumina base case for LCCP considers only revenues that can be generated using the equipment
included in the LCCP scope. There is a potential for further significant additional margin to be unlocked, through upgrading the
value of alumina via further processing (alternative drying technologies, shaped carrier opportunities and further calcination and
doping) into a range of specialty and differentiated products. This will however be considered at a later stage.
Based on these assumptions, we project that the EBITDA for the Performance Chemicals business may develop as follows:
EO value chain Year 1 Full run rate – Year 4 Comments
MEG, ktpa 180 220
Purified EO, ktpa 50 60 To existing operation
ETO, ktpa – 100
EBITDA, USD million* – 240 – 270
*Nominal.
Sasol LCCP Investor Fact Sheet 2016 11ZAG Year 1 Full run rate – Year 6 Comments
Alcohols, ktpa 80 120 Ziegler and Guerbet**
Alumina, ktpa 20 30
EBITDA, USD million* – 350 – 380
*Nominal.
**Guerbet volumes will continue to ramp-up after year 6.
Note: Please refer to the ramp-up strategy in section 3, which provides details on the planned market penetration and strategy in the initial years.
9. ADDITIONAL PROJECT-RELATED INFORMATION
Costs of operation
The forecasted total cost of operating the plant (excluding feedstock) over the life of the project is given below as an annual
average in real terms over various time horizons.
(US$ m) Years 1 – 3 Years 4 – 7 Years 8 – 20
Total costs of operation 350 – 380 450 – 480 510 – 530
Tax
The United States operates a combination of Federal and State tax regimes, and we expect an effective tax rate of between 36 and
37% on the taxable income derived. We also expect that, due to the permitted accelerated amortisation of capital expenditure
that the LCCP will only be in a tax-paying position from FY24 onwards. Statutory incentives, for which the ethane cracker and
derivatives complex qualifies in accordance with the applicable legislation, include the industrial property tax exemption, enterprise
zone programme and quality jobs programmes. These tax incentives have been included in the EBITDA numbers provided above.
Depreciation
The LCCP facility will be depreciated over 25 years (4% depreciation per annum).
10. PROJECT RETURNS AND SENSITIVITIES
The expected returns from the LCCP have also been updated, taking into account Sasol’s updated oil and petrochemical price
forecasts (based on a panel of three independent market consultants – Nexant, Wood Mackenzie and IHS) and the revised cost
and schedule resulting from the review process. On an unlevered total project cost basis, and including Sasol’s lower-for-much-
longer oil price outlook, the returns from LCCP are expected to be above the company’s US dollar weighted average cost of capital
of 8%, although below the returns expected at the time of final investment decision in October 2014. Despite the lower expected
returns, Sasol still considers the LCCP to be a sound investment that will return value to Sasol’s shareholders for many years into
the future.
12 Sasol LCCP Investor Fact Sheet 2016The figure below provides an update of the expected IRR range of the LCCP project, as well as key sensitivities that may further
positively or negatively impact the project’s future economics:
Project IRR <
Sasol US$ Sasol US hurdle Sasol US hurdle
WACC: 8% rate rate 10,4%
Crude oil price Panel of three average low oil case Panel of three average high oil case
Ethane price Ethane at ceiling Ethane at floor
Ethane price 10c/g higher 10c/g lower
Naphta/Ethane ratio Ratio reduced by 0,5 Ratio increased by 0,5
Capital (EOJ) - $500m
Schedule delay (three month change)
The project economics sensitivity diagram above provides an indicative illustration of the changes to the project’s IRR should the
key drivers of the project move (positively or negatively) relative to Sasol’s current assumptions.
The first sensitivity is based on the average of three independent market consultants’ outlook for the crude oil price. We have
flexed the sensitivity to represent their low and high oil case scenario, and the impact on the project economics. However, it
is important to note that this is a chemical project and the oil price movement is only reflected by the change in ethylene and
polyethylene pricing due to the linkage of these products to oil. Impacts of lower/higher oil prices are not filtered through into
the ethane pricing assumptions, despite the interdependency, as the sensitivities are calculated by changing one variable, while
keeping the other variables constant.
The second and third sensitivities illustrate the impact of changes to the ethane pricing, which is the key driver of the project
economics. Ethane pricing floats between its energy value, (ethane at floor) whereby it is rejected back into natural gas, and its
propane ceiling (ethane at ceiling). The propane ceiling price is reflective of the maximum price that flexi crackers would pay for
ethane before switching to propane as an alternative feedstock. The third sensitivity illustrates the impact of changing the panel
of three average ethane price by 10 cents per gallon over the life of the project.
The high naphtha-to-ethane price ratio over the last few years is indicative of the substantial cost advantage that ethane
feedstock crackers, similar to the ones being built on the US Gulf Coast, benefit from in terms of the margin they receive as a
result of their position in the lower quartile of the ethylene cost curve, coupled with PE prices that are set by marginal naphtha
crackers in Asia. Based on our expectations of an increasing ethane price (as outlined in section 8) we have flexed the ratio by 0,5
to illustrate the potential impact on the project economics.
The capital and schedule sensitivity is based on the latest capital cost and schedule of the project as identified in the review and
shows the relatively smaller impact of further capital overruns/savings (US$500 million) or schedule changes. Note that schedule
and capital changes are shown independently of each other.
Based on Sasol’s calculations, we estimate the sensitivities for the project to be as follows;
▪▪ For every 10c/g movement in ethane price from the base assumption, IRR is impacted by approximately 1%;
▪▪ For every $500 million in capex overspend above $11,0 billion, IRR is impacted by approximately 0,3%; and
▪▪ For every three-month schedule delay, IRR is impacted by approximately 0,2%.
These sensitivities are calculated by changing one variable, while keeping the other variables constant. However, such sensitivities
may not provide a reasonable indication of the effect of the change in any one variable, given that the variables are not necessarily
independent of each other.
Sasol LCCP Investor Fact Sheet 2016 13www.sasol.com
You can also read