Managed Futures / Global Macro Outlook 2019 - It's time to stick the landing RCMAlterna t ves - HubSpot
←
→
Page content transcription
If your browser does not render page correctly, please read the page content below

It’s time to
 RCM
Alternat ves           stick the landing

 Managed Futures
  / Global Macro
    Outlook 2019
               318 W Adams St 10th FL | Chicago, IL 60606 | 855-726-0060
                       www.rcmalternatives.com | invest@rcmam.com
RCM Alternatives: Managed Futures Outlook 2019                                                                               RCM

Managed Futures / Global Macro Outlook 2019
Is this asset class working for anyone? The past 10
years have been as mixed of a mixed bag as you can get,
with some good performance, some poor performance
(2018 chief among them), and a whole lot of middling
performance (’11, ’12, ‘15, ’16). All for an end result,
a total return, of just above even for the SocGen
Managed Futures Index. 10 years, 79 basis points,
and a return of -6.24% over the past four years. Is this
working for you? (see Fig.1 below)

Investors have been answering no to that question
of late. As witnessed by the new managed futures
barometer, AQR’s managed futures mutual fund,
AQMIX, which shed more assets than most will ever
manage. AQMIX had seen outflows of about $4.5
billion in 2018 as the fund lost -8.8%, and assets
declined -40%. That leaves them around $7 billion,                                                                     unsplash.com
down from a high of nearly $14 billion, and shows
investors are voting with their wallets.                         expecting around the bend for the better part of the
                                                                 last decade? The asset class has been bemoaning the
What’s irking investors in this particular alternative           lack of volatility, the lack of a correction, and central
investment is that 2018 should have/could have been              bank suppressed movement in markets; only to fumble
a good year for the asset class in the face of a stock           at the goal line when volatility finally returned and
market correction. You know, that one we’ve all been             markets started moving.

Fig. 1: Managed Futures - The last 10 years

 20%
                                                            Thanks
                                                            Crude Oil!
 15%
              We can handle
              declining vol...look!

                                                                                                                          ?
 10%
                                                Watching                                     if you can’t
                                                paint dry                we have no          beat’em...
                             actually...
  5% What?                   we sort of                                  memory of
     The crisis                                                                                             Stupid
     is over?                need it                                     this year
                                                                                                            VIX
  0%

                                      but not when it                               where...
 -5%                                                                                  is...
                                      immediately
                                      evaporates                                     the...
                                                                                     VOL
-10%
          2009      2010      2011      2012      2013        2014        2015       2016        2017       2018        2019
 Data: SocGen CTA Index

www.rcmalternatives.com
                                                        Futures Trading is complex and involves the risk of substantial losses.    2
                                                                Past performance is not necessarily indicative of future results
RCM Alternatives: Managed Futures Outlook 2019                                                                                RCM

Fig. 2: Volatility Increase/Decrease Across 47 Futures Markets

   Data:*Source
          RCM-Xinformation
                historical price
                             can database
                                 be found on pg. 18

Here’s a look inside the “engine room” of managed                  a far cry from 2008 when all 47 markets we track
futures/global macro programs; analyzing the volatility            saw vol expansions (averaging a whopping 89%), but
in the global markets these programs track – and                   still – it’s a weird year to be sure when we don’t see
specifically, whether that volatility was expanding or             positive performance on the back of so many volatility
contracting. Managed futures and global macro funds                expansions.
are often referred to as a “long volatility investment,”
simply meaning that they are expected to do well                   Turns out, it was a game of inches, indeed, in 2018,
when volatility is on the rise. So what was volatility             with just four days of activity sealing the fate for the
doing across the markets in a typical systematic trading           asset class, despite in line performance and the ability
program track? (see Fig. 2 above)                                  to capture market moves across the other 250 or so
                                                                   market days. Those four days, two rather infamous
It was on the rise, with 57% of the markets we track for           ones in February and another two rather innocuous
this study seeing expansions in volatility as measured by          ones in October, resulted in losses of nearly -9% for
their average true range, with those ranges increasing             the index, while the rest of the year clocked in a little
43% on average (and 30% at the median). Now, that’s                above 3%. (see Fig. 3 below)

Fig. 3: CTA Index vs VIX

                                           2/2 - 2/5       10/10 - 10/11 Rest of Year

            CTA Index                           -4.88%             -3.99%                          -3.08%
             VIX Move +177.06%                                 +56.61%                            +1.82%
  Data: SocGen CTA Index, CBOE VIX

www.rcmalternatives.com
                                                         Futures Trading is complex and involves the risk of substantial losses.    3
                                                                 Past performance is not necessarily indicative of future results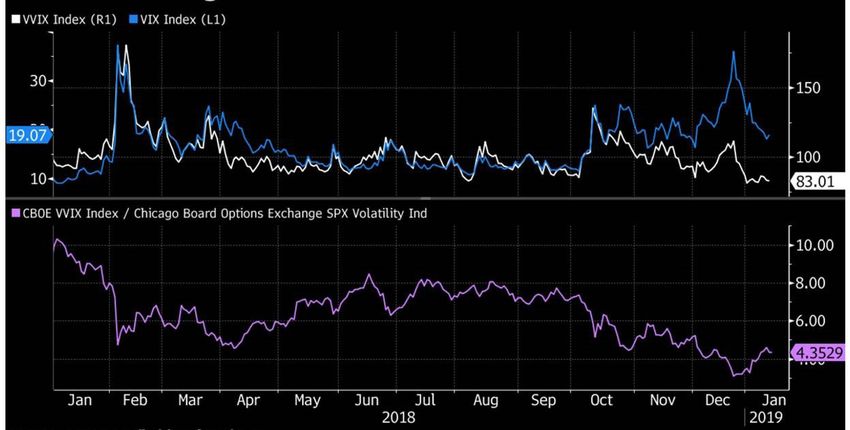
RCM Alternatives: Managed Futures Outlook 2019                                                                                  RCM

This is the opposite of what we expect from managed                adding real value to portfolios, was the allure of some
futures. We expect the asset class to have a positive              extra return enough to remove some of their normal
skew profile, seeing as how it is designed to risk small           long volatility profile? Did they get caught with their
amounts in order to put itself in position to earn large           hand in the cookie jar?
amounts when and if there are outlier moves. (see Fig.
                                                                   Fig. 5: Stocks VS Managed Futures
4 below) A handful of large negative outliers is sort of
just the opposite, and reminds us more of the stock
market’s risk profile, or that of option selling strategies.                                 1/26 - 2/8            10/4 - 10/22
Fig. 4: Skewing the VIX
                                                                            STOCKS            -10.10%                 -5.73%
                                                                        MANAGED
                                                                         FUTURES               -9.20%                 -4.82%

                                                                    Data: Socgen CTA Index, S&P 500

                                                                   The stats would seem to say yes to that charge, but in
                                                                   discussions with managers who had a poor February
                                                                   when the VIX spiked – there was a distinct disdain for
                                                                   that charge and denial that any losses were due to a
                                                                   change in risk profile.

                                                                   Instead, they counseled, the February losses were
                                                                   a plain and simple result of existing trends reversing
Data: Socgen CTA Index, CBOE VIX
                                                                   course. And because those reversals were far enough
All of this has led us to ask out loud more than a                 apart (eight months), the markets had time to establish
few times this year, did managed futures managers                  new momentum in the same direction (equities up,
get caught adding a little more short vol/long equity              energies up, metals up, foreign currencies up). So much
exposure to their portfolios in 2018? After years and              for the old saying, fool me once, shame on me, fool me
years of the short volatility and long equity trade                twice, shame on me.
                     S&P Up / Down Trend
Fig. 6: S&P Up/Down Trend

            310.00

            295.00
                                                                                                               Source: Gettyimages.com

            280.00

            265.00

            250.00
                 OCT - 17                JAN-18                  APR-18                    JUL-18                    OCT-18

Data: SPY                          SPY            20d MA              50d MA           Trend reversal signal

www.rcmalternatives.com
                                                           Futures Trading is complex and involves the risk of substantial losses.       4
                                                                   Past performance is not necessarily indicative of future results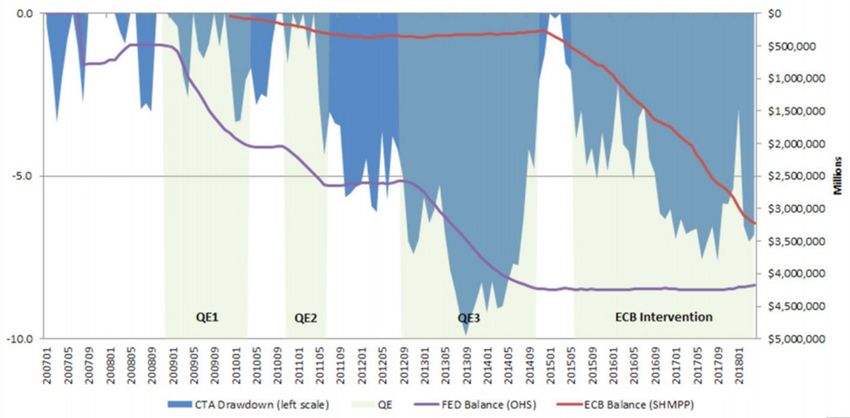
RCM Alternatives: Managed Futures Outlook 2019                                                                           RCM

Many systematic models were “fooled” into believing
the March through September rally was a new uptrend,
only to enter just as the nascent trend would unwind
once again. (see Fig. 6 on page 4)

Of course, it isn’t all about equities. The ability of
managed futures and macro to perform during a stock
market sell off ultimately comes from not just short
equity exposure, but even more so from exposure in
markets that react in kind (be it bonds up in a flight
to safety, foreign currencies moving, energy markets
reflecting new demand based on assumed economic
progress reflected in stock prices, and so on). To
perform in a crisis, managed futures need a bit of              qpr2l7.imagenii.com

contagion, where the illness extends into other markets
to drive them outside of their previous ranges either up    in 2018. Ouch! That’s a lot of whiplashing around.
or down.                                                    (see Fig. 7 below)

As SocGen points out in their annual CTA review,            So, that’s 2018 in a nutshell (to borrow a line from
that spreading of the illness was hard to come by           Austin Powers). Lots and lots of small trend indicator
in a consistent way in 2018. What most systematic           flip flops between long and short, bookmarked by
programs want to see in that regard is not just sympathy    two large trend reversals in February and October
moves in other markets like interest rates or currencies,   which caused outsized losses because of their timing
but follow through on those moves and not quick new         – unwinding quickly from the top of the trend (as
moves followed by trend reversals. Instead, we saw the      opposed to a slow roll over of a trend). It was five steps
most trend reversals in their trend indicator in 20 years   up, seven down. Five more steps up, then seven more
                                                                     down, leaving investors a few ladder rungs
Fig. 7: Number of position changes
for trend indicator by year                                          below where they started. But enough of
                                                                     2018, what’s 2019 likely to look like?

                                                                        What Could 2019
                                                                        Look Like?
                                                                        Well, with one month already in the books,
                                                                        we get to cheat a little here. As we write this,
                                                                        stocks have rallied more than 10% from their
                                                                        end of 2018 lows, crude oil has rallied more
                                                                        than 20% from its lows, and we are, generally
                                                                        speaking, in a bit of a transition period
                                                                        (technical analysis no man’s land) between the
                                                                        down trends that started with the October
                                                                        sell off in stocks, and the bounce from those
                                                                        lows. That has meant a small bit of trouble for
                                                                        systematic models which had pivoted to the
                                                                        short side in many of these markets (equities,
                                                                        energies, industrial metals, US dollar, interest
Source: SG CIB, Bloomberg

www.rcmalternatives.com
                                                    Futures Trading is complex and involves the risk of substantial losses.    5
                                                            Past performance is not necessarily indicative of future results
RCM Alternatives: Managed Futures Outlook 2019                                                                                RCM

rates), with managed futures looking at a loss of                insightful whitepaper titled “Volatility in Transition”.
-1.90% for January, which is not the way we wanted               Pearl made noise in 2018 when they logged a +19%
to begin to recover from an ugly 2018.                           month during February’s vol spike, and have performed
                                                                 well during falling and flat volatility periods as well
So what can break us out of the malaise. Here are                (past performance is not necessarily indicative of
some factors which could help and hurt the asset                 future results). They live and breath this stuff, so it was
class in 2019:                                                   interesting to hear them highlight some stats such as:

                                                                           We are in the 35th month since the bottom
Possibly Helping:                                                          of our latest Realized Volatility period. On
A Higher Volatility Regime                                                 average, it has taken Realized Volatility
                                                                           approximately 41 months to then make a move
                                                                           into [a new higher regime] its 90th percentile.
Orange is the new black. Different is the new normal.
Is 20 VIX the new 15 VIX? That was the question
put forward by Bloomberg at the end of the year                  It sure feels like we’re in a new, higher volatility regime,
in a piece titled: “Battered and Bruised, Wall Street            with the days of every vol spike being met with faster
Makes Peace With Volatility”, where they have some               and faster evaporations of that volatility as sellers sold
juicy quotes like:                                               each spike en masse to capture the natural decay in
                                                                 volatility. And the question is whether we stay at these
        Markets are “beginning to accept a shift                 elevated levels in the VIX for quite some time, like we
        in the volatility regime back to more                    saw in the 2007 to 2012 period, where the good years
        historically average levels,” said Patrick               were very good for managed futures.
        Hennessy, head trader at IPS Strategic
        Capital in Denver, Colorado.
                                                                 Why would a higher volatility regime be a good thing?
        Put simply, market players are wagering the              Well, taking some liberty with a big assumption that
        gauge will remain higher for longer — but                the equity market volatility as represented by the
        they also reckon it will be little changed               VIX would spill over into increased volatility in other
        down the line. – Wall Street Journal                     markets like bonds, currencies, and commodities; a
                                                                 higher volatility regime would represent a greater
And that’s just the topic that the VIX specialists               opportunity set for traders.
over at Pearl Capital Advisors considered in their
                                                                 Imagine the crude oil market, for example, having a
                                                                 volatility of $0.25 per day, representing a dollar value
Fig. 8: VIX levels and trends in transition: 1990 to present

 Source: Pearl Capital whitepaper

www.rcmalternatives.com				                              Futures
                                                            		   Trading is complex and involves the risk of substantial losses.    6
                                                                 Past performance is not necessarily indicative of future results
RCM Alternatives: Managed Futures Outlook 2019                                                                                                   RCM

of $250 per contract. Trading a single contract, the                           what? While there have been performers in niche
amount of money you could expect to make or lose                               spaces like hog trading and energy focused funds, most
each day, on average given that volatility level, would                        of the strategies based on defined alternative premia
be $250. Now, assume the volatility jumps to $1.05                             have underperformed of late. Need some proof? The
per day. Now you’re looking at potential gains or losses                       genius bar over at Resolve Asset Management came
of just over $1,000. Of course, the potential gain and                         up with the following graphic (see Fig. 9 below) which
the potential loss increase, but professional managers                         shows plainly that base alternative strategies like
typically risk a small fraction of the amount they stand                       carry, value, momentum, and trend have greatly under
to gain should markets move in their direction. The                            performed over the past 10 years as compared to the
result – you go from the possibility of risking $250 to                        27 years prior to that.
make $500 in a low volatility regime, to risking $500
to make $1,500 per trade. The increase in volatility can                       That’s a shorter term observation just begging for
lead to a non-linear increase in the trade’s profit factor.                    some normal reversion to the mean within each of
                                                                               those strategy types, which should filter down into the
So, yeah, bring on a higher volatility regime.                                 myriad of systemic models based in whole or in part on
                                                                               those core principles.
Reversion to the Premia Mean                                                   Now, trying to predict when this underperformance
                                                                               will revert to the mean, exactly, is a fool’s errand to be
While a new, higher, volatilty regime may help, it’s                           sure. And, there’s plenty of folks out there who would
not enough these days to be able to rely on just an                            argue that there’s some inherent problem in these
expansion of volatility with all of the diversification                        alternaitve premia in the current market environment
amongst managed futures/macro strategies. Indeed,                              causing their underperformance, meaning they won’t
this is what was seen in 2018. Higher vol alone didn’t                         revert to the mean at all. But those are just the sort
get the job done for the average CTA as represented                            of attitudes that make contrarians salivate at the
by the indices.                                                                opportunities. And the timing need not be exact,
                                                                               considering that each of these sub strategies would
Today’s strategies range from pure trend following, to                         need to out preform their longer term average over
risk parity, to carry and defensive strategies designed to                     several years to bring the overall performance in line
capture negative moves in equity markets. And guess                            with the mean.

Fig. 9: Simulated returns for alternative premia since the Global Financial Crisis,
scaled to 10% ex post volatility since inception

                      Pre-Crisis (1950-2007)        Post-Crisis (2008-2018)          Last 5 Years (2018-2018)
   15.0%
                                                                                                                        12.6%
                                                                                               11.5%

   10.0%                                                           9%                9.1%

                                         6.5%
               5.2%                                                           4.8%
    5.0%
                                                         3%
                                                                                                        2.4%

    0.0%
                                                                                                                                 -0.1%
                                                 -0.6%
                      -1.4%                                                                                     -1.4%
                                                                                                                                         -2.6%
   -5.0%
                              -5.9%
                      VALUE                    MOMENTUM                 DEFENSIVE                   DIVERSIFIED                 DIVERSIFIED
  -10.0%                EP                       HML                       BAB                         CARRY                      TREND

 Source: Resolve Asset Management

www.rcmalternatives.com
                                                                   Futures Trading is complex and involves the risk of substantial losses.         7
                                                                           Past performance is not necessarily indicative of future results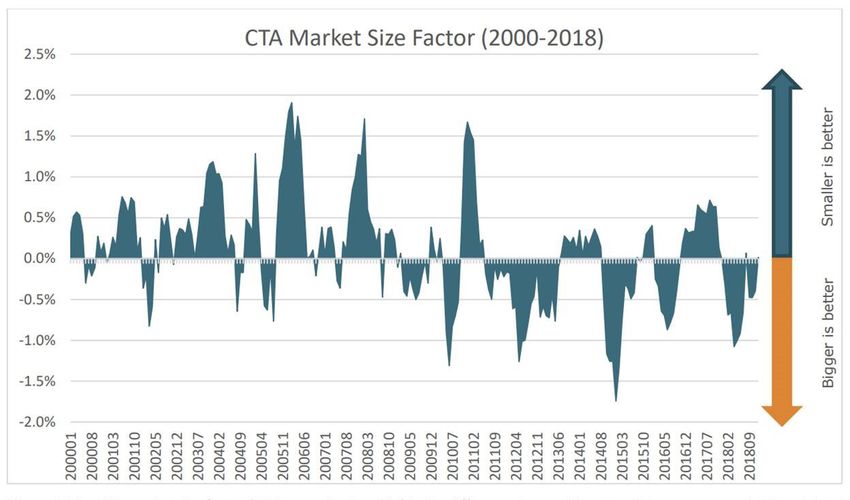
RCM Alternatives: Managed Futures Outlook 2019                                                                          RCM
Fig. 10: CTA drawdown and Central Bank activity

Source: Totem Asset Management

End of QE / More QT                                        growing central bank balance sheet and eerily mirrored
                                                           drawdown in systematic hedge funds.
One of the most interesting charts we came across in
2018 was courtesy of Andrew Strasman of Totem Asset        So, what happens when all of this cash pumped into
Mgmt. He was looking to put numbers (and a chart)          the system comes back out in the form of QT, or
to the overarching feeling amongst many systematic         quantitative tightening? We’ve only just begun the
trading advisors over the past 10 years that central       process, with barely a trickle coming off the Fed’s
bank intervention, known as Quantitative Easing (QE),      balance sheet, and the ECB and others yet to start.
was messing with the natural flow of markets resulting     (see Fig. 11 below) The billion dollar question is what
in issues for their models. See Fig. 10 above to view      happens when the tightening picks up speed and we
what he came up with.                                      sell off a trillion or more of these assets (in the form
                                                           of treasuries and mortgage backed securities)? Will it
You can clearly see a connection between the US’s QE       provide a tailwind for managed futures and macro in
efforts from 2009 through 2014, as represented by the      a mirror image of the headwind it caused when being
growth of the Fed’s balance sheet (inverted
                                            Fig. 11: Fed balance sheet holdings
for ease of comparison in the chart) and a
healthy drawdown in the CTA indices. But
perhaps more telling is the reversal of the
drawdown and new equity highs as the
Fed balance sheet stopped growing. And
perhaps even more telling than that, is the
resumption of the CTA index drawdown
when a new QE player came to the plate
in the form of the ECB. Their actions
became known as an intervention instead
of QE, but the effect was the same – a Source: Federal Reserve

www.rcmalternatives.com				                        Futures
                                                      		   Trading is complex and involves the risk of substantial losses.    8
                                                           Past performance is not necessarily indicative of future results
RCM Alternatives: Managed Futures Outlook 2019                                                                               RCM

put on? It surely won’t match exactly – and
the Fed won’t tighten at the risk of knowingly
plunging the US into recession or the like. They
have choices on when and what to tighten. But
we can’t stop looking at the Totem Asset chart
and thinking a reversal of the balance sheet
trend could have a role in adding volatility and
pushing longer duration trends in markets like
interest rates and currencies.

The Return of Ag?
There’s more than one market in the world of
alternative investments, with most investment
programs covering a universe upwards of 75+              static.panoramio.com

markets spanning stock indices, currencies,
interest rates, energies, softs, grains, metals,                  bonds. A drought in Brazil, for example, is not a macro
and more. What’s more, most systematic programs                   event driven by changes in capital flows and interest
risk balance their portfolios in order to ensure that             rate differentials. It just plain didn’t rain there.
they make roughly the same amount of money from
a breakout in soybeans as the S&Ps. So when looking               So it was with great interest that we read one of
for catalysts for an uptick in performance in 2019, we            the latest pieces from one of the smartest people
need to consider the smaller markets like wheat and               in the space – AlhpaSimplex’s Kathryn Kamynski –
corn, right alongside the huge markets of crude oil and           highlighting the historical performance split between so
US 10-Year note futures.                                          called bigger and smaller markets covered by managed
                                                                  futures programs. (see Fig. 12 below)
In theory, these smaller markets can help pick up the
slack when and if there are periods lacking large macro           You can’t help but notice the left side of the chart
moves, which would be reflected in markets like oil and           representing roughly 2000 to 2009 (we need to talk to
                                                                  Kathryn about that date formatting…) has many more
Fig. 12: CTA market size factor (2008-2018)                                                    observations where smaller
                                                                                               is better than the right side
                                            Source: Kathryn Kaminski, Ph.D., AlphaSimplex      of the chart covering 2010
                                                                                               through 2018, where bigger
                                                                                               is better.

                                                                                               Now, some of that may
                                                                                               have to do with the QE
                                                                                               phenomenon           mentioned
                                                                                               above, but we also know that
                                                                                               Ag traders in particular have
                                                                                               been bemoaning the lack of
                                                                                               opportunity for roughly the
                                                                                               same amount of time the
                                                                                               bigger markets have been
                                                                                               outperforming – leading us
                                                                                               to believe a lot of that smaller
                                                                                               market      underperformance
                                                                                               of late is due in no small part

www.rcmalternatives.com
                                                        Futures Trading is complex and involves the risk of substantial losses.    9
                                                                Past performance is not necessarily indicative of future results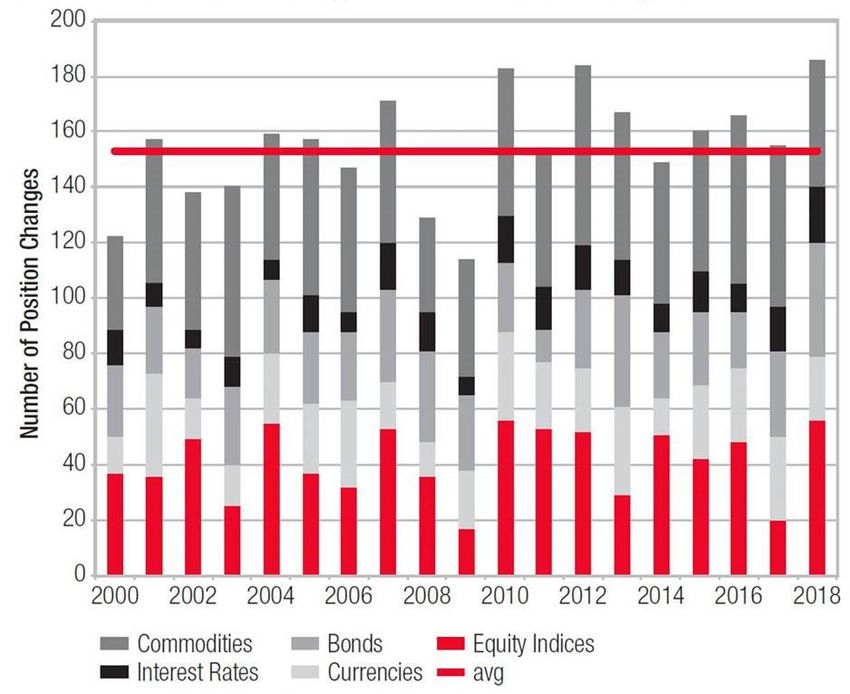
RCM Alternatives: Managed Futures Outlook 2019                                                                                             RCM

to a lack of opportunity in the ground agricultural
commodity markets. We’re talking row crops like corn,
wheat, and soybeans. And we’re talking the volatility
expansion engine which drives opportunity in the
space that has been particularly lacking amongst these
so-called Ag markets: (see Fig. 13)
Fig.13: Avg 3yr volatility increase/decrease - Ag Markets

         Bean Oil, Corn, Cotton, KC Wheat, Soy Meal, Soybeans, Wheat
 70%                                                                        environment of the past several years, but it wouldn’t
 60%                                                                        surprise us at all to see the smaller Ag markets awake
 50%                                                                        out of their long slumber to add to the equation in 2019.
 40%
 30%
 20%
                                                                            There you have it. Some possible tailwinds that could
 10%
  0%
                                                                            develop in 2019. What about some headwinds? What
-10%                                                                        sort of environments could appear to hinder overall
-20%                                                                        performance amongst the asset class? Next, let’s talk
       2007 2008 2009 2010 2011 2012 2013 2014 2015 2016 2017 2018          about what sort of factors might be Possibly Hurting the
Data: RCM-X historical price database                                       market in 2019.

That’s four straight years of volatility contraction for
the Ag markets, and a nasty bit of a down trend in the
                                                                            Possibly Hurting:
amount of vol since a spike in 2008. But there was that                     Lower Volatility
bit of a bounce last year, and we can’t help but think
that this lack of volatility doesn’t mesh well with what                    We touched on some of the arguments for why 2019
we observe around us.                                                       could be shaping up to move into a new, higher volatility
                                                                            regime. But, with a month+ of the year already under
It sure seems like we’re seeing an increase in volatility                   our belt, we also know that the year sure hasn’t started
in the weather, which is one of the biggest price                           out that way. We’ve gone down about -40% in the VIX,
drivers of Ag prices. Record forest fires. Bigger and                       from around 25 back to the 15 level. Now, it could be
costlier hurricanes. Hotter and longer droughts, and                        argued that may be proof of a higher regime, with the
so forth surely must cause some. And that’s just                            VIX standing at 15 after a rather straight up move in
the bit of speculation played out in an interesting                         equities of +15% to +20% or so from the Dec lows,
Bloomberg piece titled The Pessimists Guide to 2019:                        instead of its previous levels around 12.
Fire, Floods, and Famine which focuses on a sort of                               Source:
nightmare scenario for agriculture markets this year                        But even  if we didn’t have these 30 market days or so of
                                                                                newrepublic.com
centering around an intense El Niño causing supply                          observations, the 2018 volatility spike was shaping up
problems, and then those problems being exacerbated
by some political posturing to cause bread lines and
food inflation. It’s as out there as you can get – and
even admits that maybe it “…sounds farfetched”
before pointing out that “all of the weather scenarios
and most of the policy scenarios described here have
happened in the past. Just not at once”.

The likely path is surely somewhere between
that pessimists view and the declining volatility                              www.skiresort.info

www.rcmalternatives.com
                                                                     Futures Trading is complex and involves the risk of substantial losses.    10
                                                                             Past performance is not necessarily indicative of future results
RCM Alternatives: Managed Futures Outlook 2019 RCM
to be a bit of a sucker move for managed futures and Fig.15: A Recent Divergence
macro in our view. The problem was that we got the
statistical increase in vol just like the doctor ordered,
but it was in wrong direction. And it didn’t spill over
completey into other markets and get the needed
follow through. To paraphrase some stormtroopers: it
wasn’t the (vol) droids we were looking for.
That was bound to be bad news heading into 2019,
because there was no buffer to absorb the inevitable
contraction in volatility. The old model was a sort of
two steps forward when vol expanded, one step back
when it contracted. But with no forward momentum Source: Bloomberg
in 2018, we were bound to be looking at a two steps keeping an eye on in 2019 as a barometer for just how
backwards, one more step backwards start to the year. well different strategy types are able to capture that
The immediate issue is that the contraction in volatilty vol expansion. Generally speaking, a declining VVIX,
represented itself as reversals of the trends put in will signal a tougher environment for these strategies
place at the end of last year, just as many managed to harvest the increase (on a declining scale) of volatilty.
futures programs were getting in line with those (see Fig. 15 above)
moves. Sitting here a week into February, we already
know this happened, meaning we’re starting out 2019
on the wrong foot right out of the gate. Investor Risk Appetites
Fig.14: CTA Index & VIX - 2019 We asked back in 2017 if the investors complaining
20% 0% about below average returns might be just the thing
-1% that is causing the below average returns by their
10%
-1%
(en masse) desire for lower volatility, and there’s no
-2%
denying the shift from the days of 30%+ volatility
0%
inside of managed futures and global macro programs
-2%
to 10 vol targets, and the like as the investor base has
-10% -3%
shifted to more institutional. So, one headwind in 2019
-3%
-20% might be that head staring at you in the mirror – you,
-4%
the investor.
-4%
-30%
-5% And as the desire for less risk has increased, so too has
-40%
1/2 1/7 1/12 1/17 1/22 1/27 2/1 2/6
-5% the ability of systematic investment programs to deliver
an expected risk. Hedge funds and other alternative
VIX SOCGEN CTA INDEX
investments, especially in the managed futures and
Data: SocGen CTA Index, CBOE VIX macro space, measure and target risk on a per trade,
per market, per sector, and per portfolio basis. That’s
A Declining VVIX something a passive investment in the stock market
can’t do. We can’t ask the S&P to just give us a 10 vol
What’s more? A higher vol regime might not be the next year. You just get what you get.
panacea we think for everyone in the space. The end
of last year showed us that a higher volatilty can also Will we continue to see lower returns because of less
come with declining volatilty of volatility - which caught risk taking? Will investor appetite for less risk continue
out a few volatility traders who weren’t seeing the VIX to result in less return? That’s the trend, to be sure,
moves they expected given moves in the stock market. as we highlighted in a 2018 blog post talking about
The volatilty of volatilty, or VVIX as its called, is worth this Great Reset in investor appetite.
www.rcmalternatives.com
Futures Trading is complex and involves the risk of substantial losses. 11
Past performance is not necessarily indicative of future resultsRCM Alternatives: Managed Futures Outlook 2019 RCM
Fig.16: Hedge Fund Risk bank operations ‘confusing’ systematic models,
then 2019 could be problematic. We may need to
get through the QT portion of this historic policy
experiment, running off $50 billion a month on the
way to trillions less on the balance sheet, before a
systematic ‘all clear is signaled.’
Sharper Yield Curve
We’ve mentioned the issues with the short bond trade
(rates up) in both the 2017 and 2018 outlooks, where
research by Niederhoffer showed the annual roll cost
Data: Credit Suisse Hedge Fund Index to be significant enough to turn profits from having the
right direction on a short bond trade, to losses when
Fig.17: Hedge Fund Returns reflected through the contract by contract holding of
that short position. But an analysis of a simple short
trade in 10-Year Notes during all of 2018 showed that
the roll cost was a factor, but not much of a factor at
all. Perhaps because a flattening of the yield curve
overall percolated down into flatter futures curves
for individual fixed income futures markets, making
for a negligible roll cost. A re-steepening of the yield
curve and reflection in individual markets that future
rates across each duration will be higher may result in
enough of a roll cost to feel it in 2019.
Data: Credit Suisse Hedge Fund Index
Of course, many investors don’t care all that much if
they’re lowering the return by allocating assets to those
who meet their strict sets of parameters and mandates.
Because their return is decreasing, less than the volatility
is decreasing, causing a risk adjusted win.
http://cdn.welove2ski.com
QT
Two Outside the Box Thoughts
We showed earlier how well managed futures
drawdowns have tracked the increase in central bank One, managed futures and macro have long survived
balance sheets, positing that perhaps the unwinding of as the go-to example for diversification through an
those huge balance sheets would undo some of that alternative investment, providing long term non-
effect. But what if the issues the increase in these correlation to equity and bond markets. But that’s
balance sheets caused for alternative investment become a little problematic of late, because investors
programs wasn’t about the easing part, but instead (seemingly no matter their sophisticaiton level)
about the intervention? continue to confuse non-correlation with negative
correlation. They buy non-correlation expecting
If it’s not about easing or tightening, and instead about negative correlation, and then get upset when their
the creation of artificial demand or supply via central alternative investment is down in the same month
www.rcmalternatives.com
Futures Trading is complex and involves the risk of substantial losses. 12
Past performance is not necessarily indicative of future resultsRCM Alternatives: Managed Futures Outlook 2019 RCM
equity markets are. This has led to a shift in investor the gate, but also resetting markets to a more neutral
attitudes looking for something different out of their stance where they aren’t overbought as were heading
alternatives. People are moving towards wanting into 2018, or oversold as they were heading into 2019.
immediate diversification, not just non-correlation, From here (Feb) on, we’ll need new market movements
which sometimes provides negative correlation and to develop to drive returns. We’re looking at you Ag
sometimes doesn’t. Strategies are rolling out left and markets. And you, bonds – there’s 30 years of upside
right to try and provide this, knowing all the while that to those rates, after all.
it is a bit of a holy grail – wanting guaranteed insurance,
but not wanting to pay the monthly premiums. How In the end, managed futures and global macro won’t
will this end? We’re not sure, but it could skew the be poring over analysts’ reports and economic
return profile of managed futures away from what we projections to identify where to position portfolios
traditionally attribute to it, leaving investors a little for the remainder of 2019. They’ll do what they’ve
wanting when and if the old profile comes back with a always done (albeit perhaps with a little more machine
vengeance absent a stock market route (like agriculture learning as an assist). They’ll analyze prices in all sorts
markets moving as mentioned above). of markets and get into tons of moves, some false, and
some true breakouts. Some on a very short day to day
Two, to blame the quants and/or algos drumbeat, basis. Some on a much longer month to month basis.
which seems to be getting louder and louder with They’ll hope for some sort of catalyst (like a drought
each new time the stock markets fall a bit. Introducing or El Niño) to awaken the good kind of directional
headlines like: “Did robot algorithms trigger market volatility, and hope we enter a new higher vol regime
plunge?” and “This sell-off was caused by a computer more akin to the pre 2008 days.
driven footrace” and “A down day in the markets?
Analysts say blame the machines”. This is likely just Of course, a big year would come from true Black Swan
events that don’t already have 20 articles written on it
by different financial journalists. And certainly not ones
covered here. The biggest outliers come from way off
the radar. One thing’s for certain. There’s not much
room to the downside for the asset class as a whole
(as we know it). One bad year is just a bad year, not
a trend. Four in a row. That’s worrisome. Eight out of
10 being subpar – that’s pretty much a crisis (if not for
how the models work, at least for investor confidence
media.springernature.com
in them). Another year of poor returns could see the
likes of AQR’s managed futures fund get cut in half
fear of the new and fear of the unknown. But a small again, and hasten investor’s appetites for a more
part of us thinks there could be some push back strategic diversification approach where it isn’t just
and blow back by the general public against such passive diversification. But a new sort of on-demand
“machines” and ”algos” that could result in some sort active diversification which looks to cushion what
of new regulations or the like limiting progam’s ability seemingly everyone believes will be more frequent and
to efficiently trade their models. more violent equity market sell-offs.
We don’t believe investors should be ready to throw in
Conclusion the towel on the old model of passive diversification
just yet, but we’ll be analyzing this new type of model
day in and day out in 2019 just in case.
As always, it’s a hard year to handicap, especially when
we know that the first move in this chess match was
a contraction of the late 2018 volatility and reversals Jeff Malec, CAIA
in those trends. That’s starting us off down -3% out of Managing Director & Partner
www.rcmalternatives.com
Futures Trading is complex and involves the risk of substantial losses. 13
Past performance is not necessarily indicative of future resultsRCM Alternatives: Managed Futures Outlook 2019 RCM Disclaimer The information contained in this report is intended for informational purposes only. While the information and statistics given are believed to be complete and accurate, we cannot guarantee their completeness or accuracy. RCM Alternatives has not undertaken to verify the completeness or accuracy of any of the information and statistics provided by third parties. As past performance does not guarantee future results, these results may have no bearing on, and may not be indicative of, any individual returns realized through participation in this or any other investment. The risk of loss in trading commodity futures, whether on one’s own or through a managed account, can be substantial. You should therefore carefully consider whether such trading is suitable for you in light of your financial condition. You may sustain a total loss of the initial margin funds and any additional funds that you deposit with your broker to establish or maintain a position in the commodity futures market. Any specific investment or investment service contained or referred to in this report may not be suitable for all investors. You should not rely on any of the information as a substitute for the exercise of your own skill and judgment in making such a decision on the appropriateness of such investments. Finally, the ability to withstand losses and to adhere to a particular trading program in spite of trading losses are material points which can adversely affect investor performance.We recommend investors visit the Commodity Futures Trading Commission (“CFTC”) website at the following address before trading: https://www.cftc.gov/ConsumerProtection/index.htm Managed futures accounts can subject to substantial charges for management and advisory fees. The numbers within this website include all such fees, but it may be necessary for those accounts that are subject to these charges to make substantial trading profits in the future to avoid depletion or exhaustion of their assets. Investors interested in investing with a managed futures program (excepting those programs which are offered exclusively to qualified eligible persons as that term is defined by CFTC regulation 4.7) will be required to receive and sign off on a disclosure document in compliance with certain CFTC rules The disclosure documents contains a complete description of the principal risk factors and each fee to be charged to your account by the CTA, as well as the composite performance of accounts under the CTA’s management over at least the most recent five years. Investor interested in investing in any of the programs on this website are urged to carefully read these disclosure documents, including, but not limited to the performance information, before investing in any such programs. Those investors who are qualified eligible persons as that term is defined by CFTC regulation 4.7 and interested in investing in a program exempt from having to provide a disclosure document and considered by the regulations to be sophisticated enough to understand the risks and be able to interpret the accuracy and completeness of any performance information on their own. Reliance Capital Markets II LLC (“RCM”) receives a portion of the commodity brokerage commissions you pay in connection with your futures trading and/or a portion of the interest income (if any) earned on an account’s assets. CTAs may also pay RCM a portion of the fees they receive from accounts introduced to them by RCM. RCM Alternatives is a registered DBA of Reliance Capital Markets II LLC. www.rcmalternatives.com 14
RCM
   Alternat ves
318 W Adams St 10th FL
Chicago, IL 60606
855-726-0060

www.rcmalternatives.com
invest@rcmam.com
You can also read